JNJ Closed above the 20Week Moving Average bullish RSI-LongJNJ Closed above the 20week moving average,
has a bullish RSI divergence above 50 and
has a J-hook pattern.
Immediate target is 150 area and short to intermediate
price target appears to be 162.97-167 within a parallel
channel. 02/15/2019, Moody's maintains AAA rating
with rising revenue. After many years, TALC issues
are baked in. Evidence is earnings jump, buyouts, Apple deals, New Depression drug
with major Future cash flows and new revenue streams ahead.
Latest market decline had little impact on JNJ.
The worst appears behind JNJ with growing revenues.
JNJ


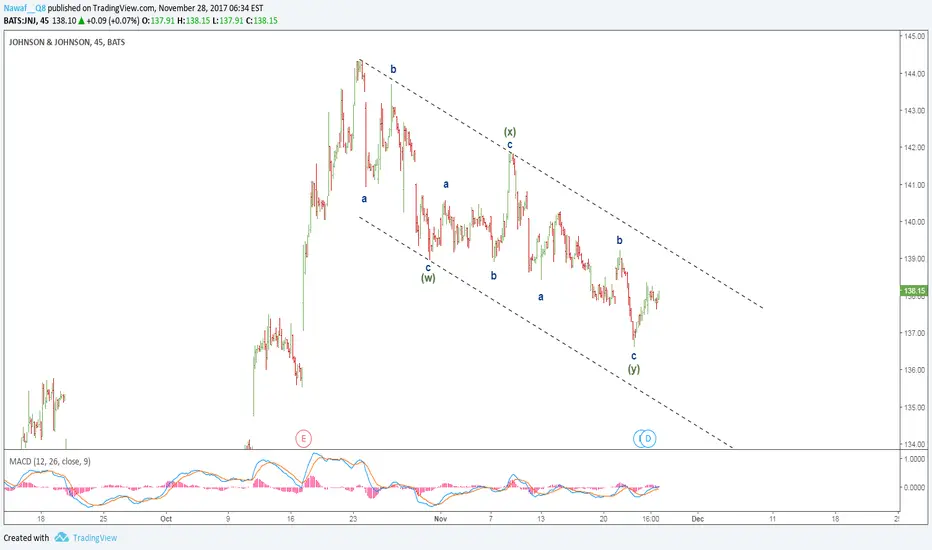
JNJ SELL (JOHNSON & JOHNSON)Hi there. Price is forming a continuation pattern to the downside. Wait for the price to complete the pattern and watch strong price action for sell.
For longer term, wait for the price to hit the bottom of the bigger pattern and watch strong price action for buy.

JOHNSON & JOHNSON (JNJ): ABC Correction In Progress?Find Winning Trades In Seconds >> efcindicator.com (Special Discount)
We just saw a submerged crossover bear flag (white bar). This corroborates with the continuation of ABC correction.

JNJ Approaching Support, Potential Bounce! JNJ is approaching our first support at 117.78 (horizontal overlap support, 100% fibonacci extension, 50%, 23.6% fibonacci retracement) where a strong bounce could occur above this level pushing price up to our major resistance at 136.78 (horizontal pullback resistance, 61.8% fibonacci retracement, 61.8% fibonacci extension).
Stochastic (89,5,3) is also approaching support where we might see a corresponding bounce in price.

Dow Stocks Johnson & Johnson (JNJ)A look at JNJ, A lot more weekly and monthly points where I see some resistance happening

JNJ Approaching Resistance, Potential Drop! JNJ is approaching our first resistance at 132.37 (horizontal pullback resistance, 61.8% Fibonacci extension, 23.6% Fibonacci retracement) where a strong drop might occur below this level pushing price down to our major support at 119.46 (horizontal swing low support, 100% Fibonacci extension).
RSI (89) is also seeing a bearish exit and we might see a corresponding drop in price.

JNJ - JOHNSON AND JOHNSON GOING FOR ONE MORE WAVE DOWN?JNJ has broken the main uptrend with a strong impulse. If it bounces to the level posted on chart i'm expecting one more wave down.

JNJ 60 Min - Bullish Cypher Pattern - Long SetupJNJ 60 Min Bullish Cypher Pattern - Long Setup
Bullish Cypher has been detected on JNJ 60 Min.
Price bounced several times about 141.95
Enter LONG JNJ at @ 142.7 with a stop loss going at @ 141.0. The first target is at @ 144.5 and the second target is at @ 146.20.
Enjoy our limited Content and Setups,
leave us a like and Comment!!

JNJ: All roads lead to 147It is crystal clear from this chart and various types of analysis that JNJ is in a zone that will probably lead to at least the 147 range. We can see a shaded channel that the stock has been ascending in for several months. We can also see that volume has been steadily increasing at a sustainable pace. From the wave count (please study Elliot Wave theory if you don't understand this) it is clear that there is a 70% chance JNJ will top out between 148.28 and 156.58 using Fibonacci levels derived from wave 3- trough to peak, and wave 4- peak to trough. Based on the standard assumption that the fifth wave will be more or less equal to the first in magnitude this would project a conservative target of at least 147 coinciding with the channel. Lastly please note that stocks and markets in general respect support and resistance levels- not specific time frames with the point being that I don't know when this price will likely be reached, just that its probably coming. Needless to day nothing is ever certain in trading so always manage risk and deal in probabilities, good luck.
Please feel free to leave feedback, questions and criticisms welcome.

Buy the dip on #JNJMy custom built "buy the dip" indicator started to give BUY signals on #JNJ a few days ago; factor confluence was given by the gap closure (see yellow box) where price action printed a neat bullish outside reversal candle at key support level.
Got in @ $130.65 and still riding


JOHNSON & JOHNSONAn eventual breakout of JOHNSON & JOHNSON of the blue trendline will give a bullish signal, with the target area at $ 126.90/127.00 and the stop loss at $ 119.90/120.00. For breakout, I mean a close of JNJ above the trendline.

JNJ Stock Bulls Aiming at $150 a ShareA textbook A-B-C zigzag correction with an ending diagonal wave C indicates the recent decline was just a pullback within the larger uptrend. $150 is still there for the taking!

JNJ - 10% Upside OpportunityPrice is showing sign of a completed ending diagonal structure.
We are looking for price to move higher from here potentially towards 133.43 - 136.93 area.
**Disclaimer - This analysis alone DOES NOT warrant a sell trade immediately. Before you enter any trade in the financial market, it is very important that you have a proper trading plan and risk management approach.
The sharing of this idea is neither necessarily indicative of nor a guarantee of future performance or success.

Johnson & Johnson (NYSE: JNJ)_May_08_2018JNJ has had a good run since the beginning of 2017. Although, the stock price has dropped from a high of $148 to $122, I think reality is catching up with investors that equity valuations have been quite expensive and that it is time for some correction. I believe the fundamentals of the company remain strong although the liabilities with rising interest rates may be a cause for concern.
I believe the current scenario presents an opportunity to short the stock. Based on the head the shoulder pattern, the price is expected to drop to $110-$115 range.

Johnson & Johnson shares Buy IdeaJNJ shares Buy Idea @ Weekly Demand Zone (114.70 - 110.71)
Buy Limit: 114.70
Stop Loss: 109.07
Take Profit: 128.32

JNJLong JNJ via short put spread.
Short Mar16 125/130 put spread for $1.10.
POP: 69%
BPR: $390
Max loss: $390
Max Win: $110
Target: 50-60% of credit received
Stop loss: Price at $127 or $350ish loss.
short 130 put: 37 delta
long 125 put: 15 delta
If this starts to get really ugly, I may pull off before $127.

JNJ wait for a break of supportJNJ made a bearish move after earnings.
There was a recent period of consolidation / pause.
Opportunity to look for break-down of support to make a bearish trade

JNJ: another fallen giantJNJ is yet another giant trading under the 200SMA.
Even though we had a strong earnings beat last week JNJ was not protected from the dip.
When the inevitable bottom is formed, I will be looking at these large caps under the 200 for bargain buys.
Hard to say what the near term status is for JNJ, following that of the market.
I would be looking for buys in the $122 range.

JNJ put saleJNJ had a massive move down on their earnings. This is one of the largest candles I can even find on the chart for JNJ. As is approached the 50EMA I was looking for Bull Put Spread or Put Sale premium. Because of dividends being at the end of February and the 200 SMA down around 134. It seems like a no brainer.