JOEUSDT 5D AnalysisJOE ~ 5D Analysis
#JOE Buy back from here. This is the lowest support block for now, Short term target 20%+, Long term target $0.5 - $1.4
JOE

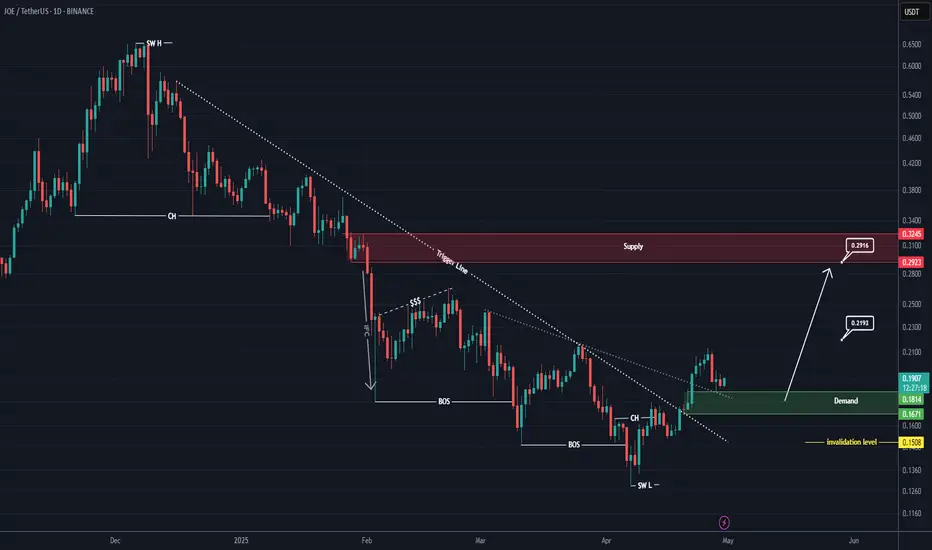
JOE Looks Bullish (1D)A 3D divergence is visible on the chart, indicating that sellers have exited their short positions.
A key trigger line has been broken, and the price has reclaimed critical levels.
We have identified two entry points where we plan to open buy/long positions.
A daily candle closing below the invalidation level will invalidate this analysis
Do not enter the position without capital management and stop setting
Comment if you have any questions
thank you

JOE Looks Bullish (1D)Two important trigger lines have been broken, and a bullish CH (Change of Character) is also visible on the chart. A key support zone has formed, which is expected to hold.
The correction that occurred has been sufficient in terms of both time and price, and the break of the trigger line indicates that the correction is likely over.
There is also a liquidity pool above the chart that is expected to be swept soon
Targets are marked on the chart.
A daily candle closing below the invalidation level would invalidate this analysis.
For risk management, please don't forget stop loss and capital management
Comment if you have any questions
Thank You
JOEUSDT 5DJOE ~ 5D Analysis
#JOE Buy gradually from here with a short -term target of at least 20%+. This is the lowest support for now.

JOE ( SPOT)BINANCE:JOEUSDT
JOE / USDT
1D time frame
analysis tools
____________
SMC
FVG
Trend lines
Fibonacci
Support & resistance
MACD Cross
EMA Cross
______________________________________________________________
Golden Advices.
********************
* Please calculate your losses before any entry.
* Do not enter any trade you find it not suitable for you.
* No FOMO - No Rush , it is a long journey.
Useful Tags.
****************
My total posts
www.tradingview.com

#JOE/USDT#JOE
The price is moving in a descending channel on the 1-hour frame and is expected to continue upwards
We have a trend to stabilize above the moving average 100 again
We have a descending trend on the RSI indicator that supports the rise by breaking it upwards
We have a support area at the lower limit of the channel at a price of 0.2222
Entry price 0.2530
First target 0.2661
Second target 0.2826
Third target 0.3032

JOEUSDT 1WJOE ~ 1W Analysis
#JOE So far it still continues to maintain this support block. Buy from here if you still have a Conviction on this coin.

Can #JOE Bulls Continue this Bullish Momentum? Key Levels Yello Paradisers! Is #JOE about to break out of this falling wedge, or will the bears take full control? Here's why the next move could be massive for #JOEUSDT:
💎#JOEUSD has been trading within a falling wedge formation, consistently rejecting from its descending resistance. This pattern is typically bullish, but we need a confirmed breakout before expecting an explosive move. Currently, JOE is holding above a strong support zone at $0.1390 - $0.2099, where buyers have previously stepped in.
💎A bullish divergence is forming on the MACD histogram, suggesting weakening bearish momentum. However, for bulls to take charge, #JOE must break through the descending resistance and reclaim $0.3709 as support. If this happens, we could see a strong rally toward the $0.60+ zone, where major resistance awaits.
💎The major support zone sits at $0.209 because the bulls have stepped here to defend this level. However, if it fails, the last line of defense is at the $0.139 strong support level. As long as support holds, buyers have a chance to push #JOE higher.
💎If the support at $0.139 fails, the bearish scenario could unfold, driving #JOEUSD into a deeper correction phase. The structure remains intact for now, but a breakdown would trigger further downside risk.
Stay focused, patient, and disciplined, Paradisers🥂
MyCryptoParadise
iFeel the success🌴

Alikze »» JOE | Ascending channel - 1W🔍 Technical analysis: Ascending channel - 1W
📣 BINANCE:JOEUSDT It is moving in an ascending channel on the weekly time frame.
🟢 Given the positive reactions and demand in the bottom area of the ascending channel, the upward movement can continue its growth to the supply area and, if supported in the middle area of the channel, the movement can continue to the ceiling of the ascending channel.
💎 Furthermore, with the failure of the first ascending channel, it can continue its growth to the extent of the first channel to the large supply area.
⚠️ In addition, if the ascending channel breaks and consolidates below it, the upward scenario is invalidated and must be re-examined and updated. ⚠️
»»»«««»»»«««»»»«««
Please support this idea 💡 with a LIKE 👍 and COMMENT 💬 if you find it useful and Click "Follow" on our profile if you'd like these trade ideas delivered straight to your email 📧 in the future.
Thanks for your continued support.🙏
Best Regards,❤️
Alikze.
»»»«««»»»«««»»»«««

#JOE (SPOT) entry ( 0.3000 - 0.3900) T.(1.9400) SL(0.2809)BINANCE:JOEUSDT
#JOE / USDT
Entry ( 0.3000 - 0.3900)
SL 1D close below 0.2809
T1 0.7420
T2 0.9500
T3 1.3000
T4 1.9400
This trade is updating for last trade due to Bull run situation now ........ check it below
______________________________________________________________
Golden Advices.
********************
* collect the coin slowly in the entry range.
* Please calculate your losses before the entry.
* Do not enter any trade you find it not suitable for you.
* No FOMO - No Rush , it is a long journey.
Useful Tags.
****************
My total posts
www.tradingview.com
1Million Journey
www.tradingview.com
www.tradingview.com
**********************************************************************************************
#Manta #OMNI #DYM #AI #IO #XAI #ACE #NFP #RAD #WLD #ORDI #BLUR #SUI #VOXEL #AEVO #VITE #APE #RDNT #FLUX #NMR #VANRY #TRB #HBAR #DGB #XEC #ERN #ALT #IO #ACA #HIVE #ASTR #ARDR #PIXEL #LTO #AERGO #SCRT #ATA #HOOK #FLOW #KSM #HFT #MINA #DATA #SC #JOE #RDNT #IQ #CFX #BICO #CTSI #KMD #FXS #DEGO #FORTH #AST #PORTAL #CYBER #RIF #ENJ #ZIL #APT #GALA #STEEM #ONE #LINK #NTRN #COTI #RENDER #ICX #IMX #ALICE #PYR #PORTAL #GRT #GMT #IDEX #NEAR #ICP #ETH #QTUM #VET #QNT #API3 #BURGER #MOVR #SKL #BAND #ETHFI #SAND #IOTX #T #GTC #PDA #GMX #REZ #DUSK #BNX #SPELL #POWR #JOE

AVAX - update - and its lil bro JOEAVAX - update - and its lil bro JOE
well avax farted around quite a bit there, and was offset late pumper, that happened last time. hence why ive rotated some early winners gains into JOE.
presumably lower market cap and high volume avax dex joe will outperform. look at the joe/avax chart.. looks bottomed.
some new functionality coming from the joe team as well. which will no doubt catalyst more pump.
seem to remember joe doing a 150% move in two days once , or was it 300% in a week or so. it was quite impressive.
*buckles up*

$JOE COIN BOUTTA FLYit's a joe eat joe world
joe boutta fly
the yellow guy gains wings
uhhh buy NYSE:JOE

#JOE (SPOT) entry range(0.3000 - 0.3830) T.(0.7420) SL(0.2809)BINANCE:JOEUSDT
entry range (0.3000 - 0.3830)
Target1 (0.7420)
1 Extra Targets(optional) in chart, if you like to continue in the trade with making stoploss very high.
SL .1D close below (0.2809)
1:3 Trade
*** collect the coin slowly in the entry range ***
*** this coin is very heavy, it may take long time to achieve the target***
**** #Manta ,#OMNI, #DYM, #AI, #IO, #XAI , #ACE #NFP #RAD #WLD #ORDI #BLUR #SUI #Voxel #AEVO #VITE #APE #RDNT #FLUX #NMR #VANRY #TRB #HBAR #DGB #XEC #ERN #ALT #IO #ACA #HIVE #ASTR #ARDR #PIXEL #LTO #AERGO #SCRT #ATA #HOOK #FLOW #KSM #HFT #MINA #DATA #SC #JOE ****

JOEUSDTJOE ~ 1W
#JOE If you are a holder of this Coin,. one of these support blocks will bouncing the price. if you want to buy again,. You can place on one of these support blocks. Minimum target 20%++

JOEUSDT Symmetric Traingle!JOEUSDT technical analysis update
JOE price has broken out of the triangle pattern and is now retesting the support line. Once the retest is complete, we can expect a strong bullish move.
And JOE price trading above 100 EMA
Regards
Hexa

JOE ANALYSIS (12H)It seems that on the chart we have a large diametric that the F wave is ending.
The green range is the best and least risky place for buy/long positions.
The targets are marked on the chart.
Closing a daily candle below the invalidation level will violate the analysis.
For risk management, please don't forget stop loss and capital management
Comment if you have any questions
Thank You

Major Bullish Breakout on the Horizon for JOEUSDT: Don't Miss!!Yello, Paradisers! Have you been watching #JOEUSDT lately? If not, you might want to pay close attention now.
💎#JOEUSDT is currently compressed between the falling wedge trendlines, setting the stage for a potentially massive bullish breakout. Right now, #JOE is facing descending resistance, but the increasing volume and the support of the 50 EMA are bolstering a bullish outlook.
After a continuous month-long decline, J$OE has reached a critical liquidity zone. This is a prime setup for breaching the upper trend line of the wedge.
If #JOE fails to break the upper trendline, we might see a retest of the bullish order block at $0.276, which has historically provided strong support and bullish momentum.
Should $0.276 fail to hold, the next support level to watch is at $0.252. If this level also fails, we could see a continued downward trend for #Joe.
Discipline, patience, robust strategies, and trading tactics are the only ways you can make it long-term in this market. Stay focused, Paradisers!
MyCryptoParadise
iFeel the success🌴


JOE still seems bearishFrom where we entered "start" on the chart, it seems that Joe has entered the correction phase.
This correction phase appears to be a diametric pattern.
If it reaches the red range, we expect a downward price rejection.
Now the price is going to complete the F wave.
For risk management, please don't forget stop loss and capital management
When we reach the first target, save some profit and then change the stop to entry
Comment if you have any questions
Thank You

#JOE/USDT#JOE
The price is moving in a 1-hour bearish channel and sticking to it well
The price rebounded well from the lower channel border at the green support level 0.4900
We have a tendency to stabilize above the Moving Average 100
We are oversold on the RSI indicator and we have a downtrend that is expected to break higher to support the rise
Entry price is 0.5000
The first target is 0.5290
The second target is 0.5542
The third target is 0.5800

JOE/USDT bullish horizon from demand? 🚀JOE Analysis
💎 Paradisers, get ready for a fantastic opportunity with #JOEUSDT as it shows a high probability of a bullish continuation from its demand zone.
💎 We've noted that NYSE:JOE consistently adheres to a descending channel, frequently respecting its channel resistance. Currently, as the price approaches a key demand zone, maintaining momentum at this level could likely result in a bullish move. Historically, when the price has reached this level, it has initiated a strong upward surge.
💎 However, as savvy traders, it's crucial to consider all outcomes. If the price of #JOE breaks below this demand level, it could invalidate the bullish outlook, possibly leading to a significant price decline. Stay alert and be prepared to adjust your strategies according to market changes.
MyCryptoParadise
iFeel the success🌴

JOE/USDT Ready to Rally From a Key Support? 👀🚀Positive Signs 💎Paradisers, let's explore the recent market activity surrounding #JOEUSDT.
💎Right now, #Joe is showing positive signs as it rebounds from the Bullish OB area. This momentum suggests that the asset might attempt to test the resistance trendline just above its current level.
💎If #JOE successfully breaks through this resistance, it could signal a continuation of the upward trend, with the potential to reach our target resistance zone higher up.
💎However, if NYSE:JOE struggles to break out and faces rejection, it might shift into a downward trend, possibly revisiting the Demand area to rebuild strength.
💎To maintain its bullish outlook, #JOE needs to bounce back from the Bullish OB area. If it drops below this level, it could lead to further downward movement, potentially driving Joe toward lower support areas or deeper into bearish territory. Stay tuned to see how #JOE navigates these critical levels.

JOE/USDT Getting Ready for A Bull Run? 👀🚀JOE Analysis💎Paradisers, let's cast our gaze on #JOEUSDT, as it showcases intriguing market dynamics with an impending retest of the Bullish Order Block (OB) within a descending channel.
💎At this juncture, #JOE is poised to revisit the demand zone following its encounter with the descending resistance. This presents a chance for the asset to rebound from this zone and ascend, eyeing the bearish OB area as its subsequent milestone.
💎However, if NYSE:JOE struggles to rally and penetrates below the demand zone, it could withdraw to the Bullish OB vicinity around the $0.4461 mark, in pursuit of revitalized momentum for an upturn.
💎The Bullish OB zone has historically been a pivotal area, reliably inducing significant recoveries upon its testing. Nonetheless, a breach of this zone, affirming a bearish trend, might see the price embarking on a Bullish journey from a lower standpoint.
💎If #JOE does not harness this upward force from the secondary level, it's geared to persist in its bearish descent. Rest assured, Paradisers, your ParadiseTeam remains vigilant, ready to escort you through these intricate market maneuvers.
