Breakout Play on Johnson & Johnson Johnson & Johnson just posted better-than-expected EPS data for Q1. Meanwhile, the company's shares continue to strengthen above the 50-day MA (in green).
A potential breakout above the clearly visible Bullish Pennant would signify mounting bullish momentum, which can be taken advantage of. Bulls can catch a potential upswing towards the major resistance level at 170.00, with the potential for further gains above.
Johnson_and_johnson

JOHNSON & JOHNSON (JNJ)In my work, I always try to combine fundamental analysis and technical analysis.
They are both important, especially on a topic as important as the covid vaccine.
Johnson & Johnson is about to be marketed, after the approval of the EMA on 11 March.
Exactly after the announcement, I bought the stock.
The JnJ vaccine has a much lower distribution cost than Pfizer since it can be stored at refrigerator temperatures, like AstraZeneca.
The difference is in the prestige and history that the company has.
Moreover, the share according to the average of analysts, still has ample room for growth, with an average target of $ 185 and a second "high" at $ 200.
Technically speaking, the price bounced off the bullish support trendline on Thursday, March 4th, and then broke the resistance trendline on the 12th, exactly the day after the announcement of the EMA's approval.
The trend is clearly bullish, but, even keeping in mind the analysts' opinion, I believe the first target in area 170 is more likely.
If everything goes well with the vaccine, the analyst targets could be greatly raised.
It is a different trade, to be constantly monitored with a trailing stop, in case there will be any hitches or cases of a block, as happened for AstraZeneca. Such an open market scenario would cause a crash, so you have to be ready to get out quickly.
Lazy Bull
1st target: 170
2nd target: 180
3rd target: 200
DISCLAIMER: I am not a financial advisor nor a CPA. These posts, videos, and any other contents are for educational and entertainment purposes only. Investing of any kind involves risk. While it is possible to minimize risk, your investments are solely your responsibility. It is imperative that you conduct your own research. I am merely sharing my opinion with no guarantee of gains or losses on investments.

Johnson & Johnson should stick to baby wipes.....Vaccine Recall!With the news that the CDC is pausing J&J vaccine distribution due to blood clot issues.
I'm assuming we should see it tank at the open? You're guess is as good as mine.
In my opinion if we see price drop it should be a good time to buy, because everyone else is selling.
The level I'm interested in is $147-$150.
It is an untested point of control where institutions may have some buy orders sitting.
Watch for an ABCD on the line chart (close to close) for entry.
We may not break the 2021 high, but if the March equal highs remain untouched, I would look to enter because there is still possibly liquidity there.
$150 should give a nice reaction if we hit it while those highs are untouched.
Let's Elevate,
Gio

JNJ BULLISH BREAKOUT With good news out regarding the one-shot vaccine and multiple bullish signals this could be a great play.
Descending wedge and potential inverse head and shoulders could see price rise to £170 and beyond.
Beware of some resistance around £165.

Johnson & Johnson (JNJ) Buy Signals on D1.Johnson & Johnson (JNJ), D1: Support line + Mirror level + Bollinger bands + Inside bar

JNJ Stock analysis version 2 Going long on JNJ
- Bounce on EMA 100
- Hidden Divergence (Continuation of Uptrend)
- Bounce on the trendline
- TP Fib 1.272 or 1.00

New Bullish trend for Johnson&Johnson or... ?JNJ was made beautiful double bottoms where later than is made breakthrough resistance line and now he's back to testing.
Setups what needs to be looking for is if the price bounce and go up, or if some correction will happen to us, ABCD pattern looking pretty interesting...
If JNJ will rebound from support line, price target what we are will looking for is approx. at 186 or more if JNJ will give us ABCD patterns.
Market now is in very hot situation where we will see who is gonna win at this moment, bulls or bears.
Thank you for reading, feel free to leave like or comment if you like my analysis and work :)

Johnson & Johnson Buy📈 NYSE:JNJ Long D1
🛒Buy above = 168.04
🎯Target1 = 173.36
🎯Target2 = 176.65
🎯Target3 = 181.98
⛔️Stop-loss = 159.42
❌Cancel trade = 159.42

If chart goes up black line !EVERYTHING IS POSSIBLE! (Big event)If chart goes up black line !EVERYTHING IS POSSIBLE! (Big event)
And to 24 FEB to 8 MARS= 2 choices
1: The bottom after the big bull Event! ( around 5.48$- 5.67$ ) after that another bull because is the max bottom line.
OR
2: The maximun Bull trend ( if the chart doesn't go up the black line ) and after that bear trend. ( the bottom will be 4.50$.. something around that)
I choose option 1 because :
-spyk etf J&J Vaccine efficacity will be on top at this time.
-WEED will be legalize in entire USA in this period too
-is the fucking futur soo bull all in!! imposible human can go futher with out fixed mental issue! mental issue is not imagination for creation! mental issue are BIG WALLS. and everyone know right now we are at the top of thechnologie. SOMETHING BIG WILL CHANGE. LIKE THE INITIATION OF INTERNET.
MAYBE CLOUD INTERNET...LIMITLESS PERFOMANCE.
MAYBE REAL A.I ACESSIBILITY
MAYBE ROBOT WHO TAKE PHYSICALL WORKS
MAYBE EVERYTHING WILL BE AUTOMATIC IN A WAY THAT CHANGE ALL OUR ENTIRE HABITS ( COVID IS A GOOD INICIATION)

Mid Term J&J sketch. Johnson & Johnson. Post close of NYSE -1/26/2021.
My sketch of J&J indicates:
that we have broken above LT trend line and have gained momentum ahead of ST Trend line.
we have a perfect FB setup with a Retrace to? 0.5 is my guess.
interested to see if Momentum indicates a strong trend redirect and the beginning of a fourth EW.
Note: I did not use support / Resistance in this chart but may take a look tomorrow at shorter time frame to see where the daily traders are pressuring.
Cheers !


J&J target price at $180.35 +17%J&J has activated a second impulse structure with target price at $180.35 that is +17% from current price. This value has as well a bigger second impulse structure activated with target price $228.66 +48% from current price.


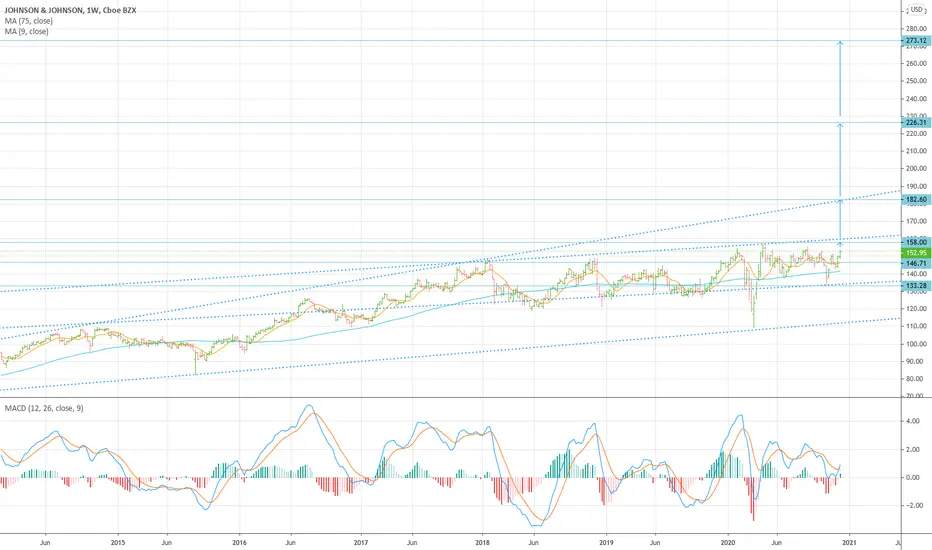
NYSE:JNJ Johnson stock price forecast, Buy Breakout, Target 226.Johnson & Johnson (NYSE: JNJ)
Trade : Buy Breakout
Entry : 158
Target : 226.31 (68.31, +43.23%)
Stop : 145 (-13, -8.23%)
Posted on Sunday, December 13, 2020
Note : Johnson & Johnson stock price hasn't moved for a long time. Stocks like this, once they begin to move, often show very big moves. Not sure yet, but JNJ stock seems to be preparing for a rise. It would be better to find opportunities to buy when the price break out 158.0. If the prediction is right, resistances could be 158, 182.60 and 226.31. Supports could be 146.71 and 133.28. If they have been preparing something very big, there is a possibility that their stock price could rise over 270 level.
Technical outlook: JNJ bullish scenario:Technical outlook:
JNJ bullish scenario:
We have technical figure Triangle in US company Johnson & Johnson (JNJ) at daily chart. Johnson & Johnson is an American multinational corporation founded in 1886 that develops medical devices, pharmaceutical, and consumer packaged goods. Its common stock is a component of the Dow Jones Industrial Average and the company is ranked No. 37 on the 2018 Fortune 500 list of the largest United States corporations by total revenue. The Triangle has broken through the resistance line at 09/12/2020, if the price holds above this level we can have possible bullish price movement with forecast for the next 13 days towards 158.15 USD. Our stop loss order should be placed at 143.06 USD if we decide to enter this position.
Fundamentals:
- Mexico could order an additional 22 million doses of coronavirus vaccine from Johnson & Johnson’s Janssen unit under a memorandum of understanding signed this week, Deputy Health Minister Hugo Lopez-Gatell said on Tuesday.


JNJ - buy support zone (gray) analysisHello traders,
Description of the analysis:
Johnson & Johnson ( JNJ ) support zones ideal for timing long positions (gray). Trade what you understand, trade carefully and sparingly according to the business plan.
About me:
Hi, my name is Jacob Kovarik and I´m trading on stock exchange since 2008. I started with a capital of 3000 USD. My first strategy was based on OTM options. (American stock index and their ETF ). I´ve learnt on my path that professional trading is based on two main fundaments which have to complement each other, to make a bussiness attitude profitable. I´ve tried a lot of techniques and many manners how to analyze the market. From basic technical analysis to fundamental analysis of single title. My analytics gradually changed into professional attitude. I work with logical advantages of stock exchange (return of value back to average, volume , expected volatility , advantage of high stop-loss, the breakdown of time in options, statistics and cosistent thorough control of risk). At the moment, my main target is ITM on SPM index. Biggest part of my current bussiness activity comes from e mini futures (NQ, ES). I´m trader of positions. I´m from Czech republic and I take care of a private fund (over $4.000.000 USD). During my career I´ve earned a lot of valuable experience, such as functionality of strategies and what is more important, control of emotions. Professional trading is, in my opinion, certain kind of mental training and if we are able to control our emotions, accomplishment will show up. I will share with you my analysis and trades on my profile. I wish to all of you successul trades.
Jacob

Johnson and Johnson - JNJ top-down video AnalysisHello everyone, here is the top-down analysis for JNJ, feel free to request any pair/instrument or ask any questions in the comment section below.
Best of luck!
