US30 Holds Above 44500 – Bullish Momentum in PlayUS30 | Technical Overview
The price action continues to reflect a bullish bias, supported by strong earnings reports and solid U.S. economic data. As long as the index trades above 44500, the upward momentum is expected to continue.
Technical Outlook:
Price remains bullish above 44500, with upside targets at 44640 and 44760.
A confirmed 1H close below 44500 would shift momentum to the downside, exposing support levels at 44350 and 44215.
Key Levels:
• Pivot: 44500
• Resistance: 44640 / 44760 / 44920
• Support: 44350 / 44215 / 44075
Jones

US30 | Bearish Pressure Builds Below 44,170 — Breakout or BounceUS30: Eyes on Earnings and News
US stocks edged higher pre-market after Trump denied plans to fire Fed Chair Powell, easing market concerns. With corporate earnings in focus, sentiment remains cautiously optimistic.
Technical View:
The price holds bullish momentum above 44170, targeting 44280 and 44500.
A 1H close below 44170 may lead to a drop toward 44075, and breaking below that would open the path to 43960 and 43630.
A 1H close above 44280 strengthens the bullish case toward 44500.
Key Levels:
Resistance: 44280, 44410, 44500
Support: 44075, 43960, 43630
previous idea:

US30 – Bearish Outlook Below 44,500 as CPI Looms US30 – Bearish Outlook Below 44,500 as CPI Looms
US30 rallied and successfully reached our resistance target, as expected in the previous analysis.
However, with today’s CPI release, the market is likely to see increased volatility. As long as the index trades below 44,500–44,570, the bias remains bearish, with downside targets at 44,210 and 43,960.
• If CPI prints below 2.6%, we may see a bullish breakout toward 45,100
• Above or equal to 2.6% supports continuation of the bearish move
However, we expect a 2.7% reading, driven by tariff-related price increases, which would support the bearish scenario.

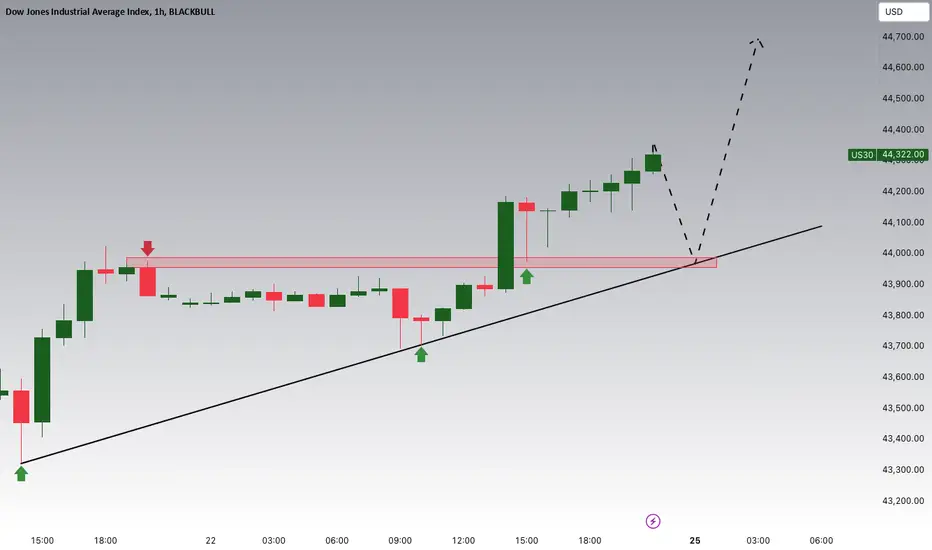
US30 Bearish Below 44490 – Watching 44180 US30 Analysis
US30 remains bearish below 44490, with downside targets at 44180 and 43960.
A 1H close below 44180 would confirm continuation toward 43630.
To turn bullish, price must break above 44490.
Pivot: 44430
Resistance: 44460, 44550, 44760
Support: 44180, 43960, 43630

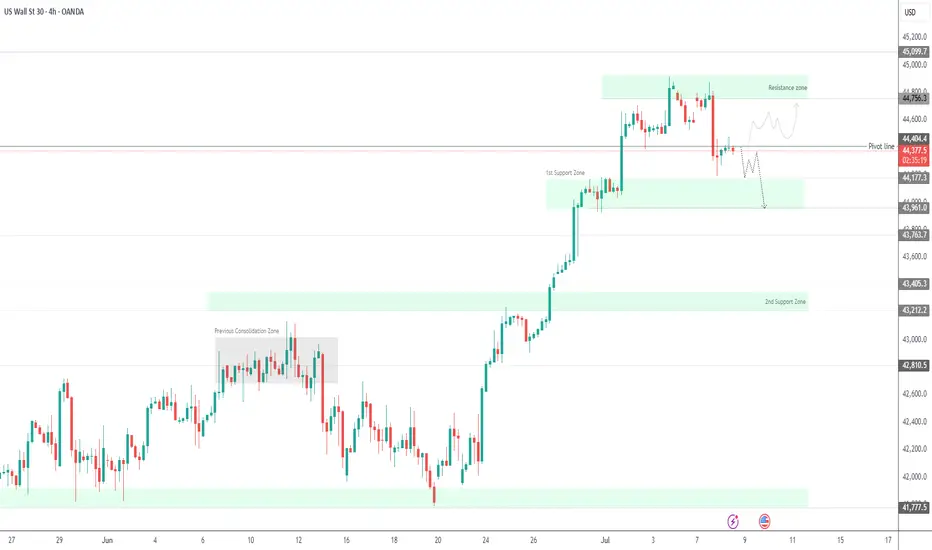
US30 Consolidates Below Resistance – Tariff Risks LoomUS30 – Market Overview
The price is currently consolidating within the range of 44490 to 44180, awaiting a breakout to determine the next directional move.
Bearish Scenario:
As long as the price trades below 44490, we expect bearish volatility to retest 44180.
A confirmed 1H close below 44180 would open the path toward 43960 and 43760.
Bullish Scenario:
If the price closes above 44490, it will likely trigger a bullish move toward 44750, with potential extension to 44970 ATH and beyond.
Note: Market sentiment remains sensitive to tariff-related developments, which may drive sharp moves in either direction.
Pivot Level: 44490
Support: 44180, 43960, 43770
Resistance: 44750, 44960, 45100

Dow Jones Below Key Pivot – Tariff Talks to Define Next MoveDow Jones – Overview
Fundamental Outlook:
In April, President Trump capped all so-called reciprocal tariffs at 10% until July 9, giving room for trade negotiations with key partners. That same month, the Nasdaq slipped into bear market territory, while the Dow and S&P 500 entered correction zones.
Since then, Wall Street has rebounded sharply. Last week, both the Nasdaq and S&P 500 surged to all-time highs, driven by a strong labor market that helped ease recession fears.
Technical Outlook:
Currently, Dow Jones is trading below the pivot level at 44410, which signals ongoing bearish momentum.
A sustained move below 44410 supports further downside toward 44180, with a break below this level opening the path to 43960.
However, if price reverses and closes above 44410 on the 1H or 4H timeframe, it may trigger a bullish move targeting 44750 and beyond.
Support: 44180 / 43960 / 43770
Resistance: 44515 / 44750 / 45100
Note:
Progress in tariff negotiations would likely support further upside in U.S. indices.
Lack of resolution may keep the Dow under bearish pressure in the short term.
Dow Jones Gains on Rate Cut Hopes and Ceasefire Relief US30 OVERVIEW
Wall Street Rises on Fed Rate Cut Hopes and Geopolitical De-escalation
The Dow Jones (US30) remains under bullish pressure, supported by rising expectations of a Federal Reserve rate cut later this year and a ceasefire agreement between Iran and Israel, which has eased market tensions.
TECHNICAL OUTLOOK – US30
The price maintains a bullish bias as long as it trades above the pivot level at 42,810, with upside potential toward the key resistance at 43,210.
A short-term bearish correction is possible toward 42,810 or even 42,670, but the broader structure remains bullish above these levels.
Resistance Levels: 43,060 → 43,210 → 43,350
Support Levels: 42,670 → 42,420 → 42,160
A sustained break below 42,670 could signal deeper correction, while a clear move above 43,210 would confirm continued bullish momentum.

Falling towards major support?Dow Jones (US30) is falling towards the pivot and could bounce to the 1st resistance that aligns with the 78.6% Fibonacci retracement.
Pivot: 41,520.25
1st Support: 40,653.80
1st Resistance: 43,238.47
Risk Warning:
Trading Forex and CFDs carries a high level of risk to your capital and you should only trade with money you can afford to lose. Trading Forex and CFDs may not be suitable for all investors, so please ensure that you fully understand the risks involved and seek independent advice if necessary.
Disclaimer:
The above opinions given constitute general market commentary, and do not constitute the opinion or advice of IC Markets or any form of personal or investment advice.
Any opinions, news, research, analyses, prices, other information, or links to third-party sites contained on this website are provided on an "as-is" basis, are intended only to be informative, is not an advice nor a recommendation, nor research, or a record of our trading prices, or an offer of, or solicitation for a transaction in any financial instrument and thus should not be treated as such. The information provided does not involve any specific investment objectives, financial situation and needs of any specific person who may receive it. Please be aware, that past performance is not a reliable indicator of future performance and/or results. Past Performance or Forward-looking scenarios based upon the reasonable beliefs of the third-party provider are not a guarantee of future performance. Actual results may differ materially from those anticipated in forward-looking or past performance statements. IC Markets makes no representation or warranty and assumes no liability as to the accuracy or completeness of the information provided, nor any loss arising from any investment based on a recommendation, forecast or any information supplied by any third-party.

Dow 200 Points from Major SupportThe Dow Jones is just about 200 points from major support. I should caution there's often a move through support and slightly below, but this is where all the buyers are.
(I should have drawn the arrow to hit the next major resistance/support around 2031 lol, but you get the idea)
Good luck!
2025 is a Bull Year I would like to start the year with what I expect if we talk about the crypto market - a bull market until September 2025
If we talk about the stock market - bullish or flat as it was in 2005 and 2015.
If we take statistics in years that end in the number 5 (1895, 1905, 1915, 1925, 1935, 1945, 1955, 1965, 1975, 1975, 1985, 1995, 2005, 2015) - we see bull markets.
Below, I have shown weekly charts of each year ending in the number 5.
1905
1915
1925
1935
1945
1955
1965
1975
1985
1995
2005
2015
2025
Here, we saw that all years are bullish, but 2005 and 2015 were reaccumulation.
Positive Scenarios for 2025
Soft monetary policy: If the Federal Reserve keeps rates at levels that support credit growth and capital availability, it will support the corporate sector and business expansion.
Technological breakthrough: A recovery in investment in artificial intelligence, green energy and biotechnology could create new growth drivers for the Dow Jones.
Sustainable global development: If geopolitical tensions diminish and international trade relations stabilize, the global economy will gain new momentum, reflected in the index's growth.
Negative Scenarios for 2025
Tight monetary policy: A sharp rise in interest rates could reduce the availability of capital, which could slow economic growth and pressure corporate profits.
Geopolitical instability: Increased conflict or trade wars between major economies could lead to declining investor confidence and capital outflows from the market.
Declining technological development: If leading sectors such as technology and green energy do not show the expected growth, it could affect market expectations and valuations.
Conclusion
Analyzing the history of the Dow Jones, years ending in 5 represent unique periods of growth and recovery. Against the backdrop of current macroeconomic and geopolitical conditions, 2025 could be a year of significant opportunity.
The optimistic scenario is based on continued loose monetary policy, innovation, and stabilization of global relations. However, the risks associated with tight monetary policy and global instability require caution.
For investors, 2025 could be a year of essential choices. Focus on long-term trends, analyze macroeconomic indicators, and diversify your portfolio. History shows that even in times of uncertainty, the market has the potential to grow.
And for years that end in number 7 according to bearish statistics, I will write about this in 2027
Best regards EXCAVO

DOW JONES SCENARIOSHello
for DJ is now following its uptrend corridor but when it breaks down this red corridor it will at least run to that midline of the yellow corridor, so in this case if this scenario wont happend you can guide yourself by keeping eys on my drawings on my chart.
NB: just be simple

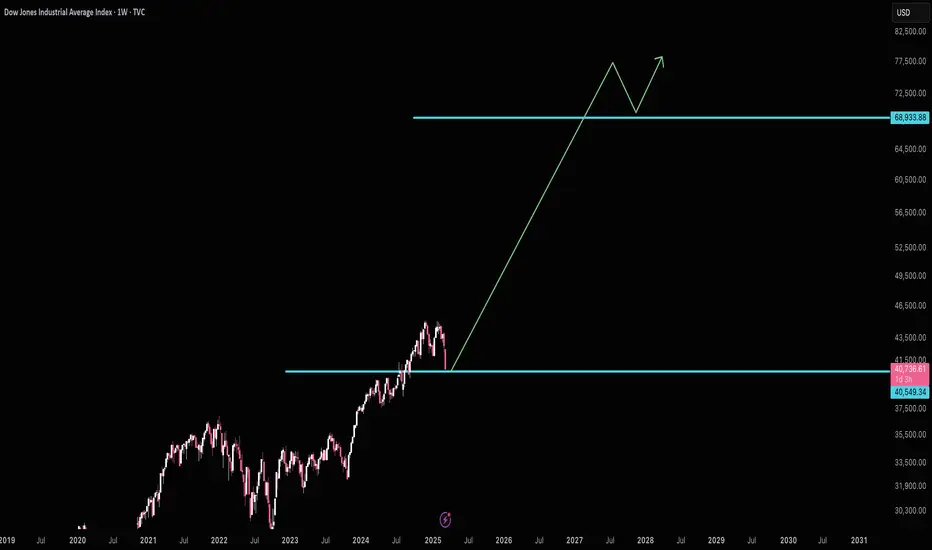
Major crash imminent?Is there a coming market crash? Technically it looks that way. In the past 130 years, price on the Dow has never been above the upper trendline, except twice, and the first time it happened, it happened just before the major crash in 1929 that set off the Great Depression. The second time is NOW. It's happening right now .
Also, every time price gets close to the upper trendline, it falls back down (2000, 2008, covid, and in June this year, it fell by 20%.)
Right now, the DOW is at 45000. If one looks at the long term trend line, a healthy price level right now should be around 18000...a hefty 60% drop.

Dow Jones Is Approaching Important SupportHey Traders, in today's trading session we are monitoring US30 for a buying opportunity around 44,000 zone, Dow Jones is trading in an uptrend and currently is in a correction phase in which it is approaching the trend at 44,000 support and resistance area.
Trade safe, Joe.
Dow Jones US30 - Lets attack ATH again!Hi Again,
Today I am sharing opportunity for long positions just before much anticipated FOMC meeting tonight.
Call it a risky trade, but if longing US30 now is risky, what the hell are currencies, gold and especially, NASDAQ and SPX doing ??
The plan is to attack 39700 area and break ATH. Who said 40000 Dow Jones is the limit?
Stop loss up to you. Safe stop loss is in 38400 area and lower due to nature of this structure they built.
Long now and lets talk tomorrow :)
Good luck and play safe!

DOW JONES: Close to our Target. Is it a buy after?Dow Jones is almost oversold on its 1D technical outlook (RSI = 31.431, MACD = -279.330, ADX = 39.462) and is approaching our TP = 37,300 that we called nearly one month ago. The target will be a direct hit at the middle of the long term Channel Up and approach the 0.382 Fibonacci. As long as the 1D MA200 supports, we will then reverse to buying, at least on the short term, expecting a rebound to the 0.786 Fib (TP = 39,350) like on January 16th 2023.
See how our prior idea has worked out:
## If you like our free content follow our profile to get more daily ideas. ##
## Comments and likes are greatly appreciated. ##

US30We are on track and going very nicely to what we wanted before we go with the market. Keep holding that patience and stop those fingers from executing any trades.
As we move lower, think of possible moves which could invalidate the forecast:
Bull momentum taking over
New rejection level
Fake outs to the downside
Major news announcements
Wrong psychology
Wait, hold, plan, wait some more

US30 OUTLOOK & TRADE IDEA | 1HMedium safe buys because there was no HTF POI mitigation.
What do you think?
LQP = Liquidity Pool
2WT = 2 Way Trap

The whole market looks bullishBitcoin has a insane large descending triangle or wedge which already broke out from the upside and will have a bullish continuation until end of the year most likely.
S&P, Dow, Nasdaq have all a large descendinge broadening wedge which is ultimately bullish. Momentum is being built up and we can foresee a sudden but steady rise as well.
Gold has been hammering on the 2000 usd/ounce resistance for the 3th time, but might have a break out as well.. though it could have an averse effect if the stockmarket and cryptomarket turns bullish.
Nothing more to say.
Place your bets.

DJ30 H4 | Potential pullback before bullish bounceDJ30 could fall towards a pullback support and potentially bounce off this level to rise towards our take-profit target.
Entry: 37,665.45
Why we like it:
There is a pullback support level
Stop Loss: 37,247.85
Why we like it:
There is a pullback support level
Take Profit: 38,250.77
Why we like it:
There is a resistance that aligns with the 161.8% Fibonacci extension level
Please be advised that the information presented on TradingView is provided to Vantage (‘Vantage Global Limited’, ‘we’) by a third-party provider (‘Everest Fortune Group’). Please be reminded that you are solely responsible for the trading decisions on your account. There is a very high degree of risk involved in trading. Any information and/or content is intended entirely for research, educational and informational purposes only and does not constitute investment or consultation advice or investment strategy. The information is not tailored to the investment needs of any specific person and therefore does not involve a consideration of any of the investment objectives, financial situation or needs of any viewer that may receive it. Kindly also note that past performance is not a reliable indicator of future results. Actual results may differ materially from those anticipated in forward-looking or past performance statements. We assume no liability as to the accuracy or completeness of any of the information and/or content provided herein and the Company cannot be held responsible for any omission, mistake nor for any loss or damage including without limitation to any loss of profit which may arise from reliance on any information supplied by Everest Fortune Group.

DOW JONES 1st 1W Bullish Cross since 2016. Can we see 42k next?Dow Jones (DJI) is forming this week the first MA50 (blue trend-line) / MA100 (green trend-line) Bullish Cross (when the former crosses above the latter) on the 1W time-frame since September 2016 (assuming January/ February 2021 was flat due to the COVIC flash crash).
This on its own is a major long-term buy signal, especially since the 1W MA50 has been supporting since March. As you can see the 2022 - 2023 price action is very similar to the 2015 - 2016 sequence. Both fractals started on a Bear Cycle under Lower Highs, which bottomed after marginally breaking below the 1W MA200 (orange trend-line). The new Bull Cycle was confirmed after the price broke above the Lower Highs trend-line and turned it into a Support being formerly a Resistance. The 1W MA50/100 Bearish Cross signified the bottom. Notice how even the 1W RSI and 1W MACD fractals are identical with their respective Higher Lows.
It appears that Dow is currently past the initial Channel Down and on the Circle pattern, which in 2016 was the final consolidation before a hyper aggressive rally that topped in January 2018. Before that top it reached the 1.5 and 1.786 Fibonacci extensions.
We treat the current pull-back as the last opportunity to buy this upcoming rally while the price is still that low. Having relatively low expectations, we expect to see at least 42000 (1.5 Fibonacci) by the end of Q1 - start of Q2 2024.
-------------------------------------------------------------------------------
** Please LIKE 👍, FOLLOW ✅, SHARE 🙌 and COMMENT ✍ if you enjoy this idea! Also share your ideas and charts in the comments section below! **
-------------------------------------------------------------------------------
💸💸💸💸💸💸
👇 👇 👇 👇 👇 👇

D-JONES, Important Levels To Consider Next Times!Hello Traders Investors And Community, welcome to this update-analysis where we are looking at the DOW JONES Industry Index 4-hour timeframe perspective, the recent price-action, the current importances in the structure, what to consider next times and how to handle upcoming situations in the right manner. As the overall stock-market is recovering from its corona-breakdowns seen this year there are major indices which already filled important key-levels such as the huge gap in the SPX which I mentioned and now filled properly, the DOW is still below these levels and could possibly follow-up with its gap-fill. In this case I detected some important signals which can make this happen when the DOW moves correctly within its range, but this does not mean the market is comptletely bullish as the bear-market is still not confirmedly over bearish action can increase again as markets approaching solid supply zones.
Looking at my chart you can watch there that the index just moved above its descending-channel-formation and formed this smaller ascending-channel-formation where it also moved above the upper boundary, these factors give an increased bullish pace within here and can indicate continuation to the upside which will be given when the index manages to travel above the last rising resistance of its channel as you can watch it in my chart, it is either possible to form a consolidation before doing this or a immediate breakthrough, a consolidation is more likely within this structure. When this properly plays out the index will look for the gap to be filled which will be crucial as this can be a point where supply enters the market as people taking profit and the price moves to the downside therefore it can also be considered a possible short-zone as you can watch it marked in my chart.
It is highly important to take note that although the index sending some decent bullish signals at the moment it is still not confirmedly bullish not only because there are still remaining strong resistance-levels but also because there is still a huge difference between real economy and stock-market as stock-market is showing gains real economy is in a decline, to provide a healthy unspeculative market environment these two need definitely move together. When the index approaches the higher levels we need to elevate and be prepared for possible bearish signs as this will be crucial level where selling pressure can enter while many retailers rushed into the market to do not pass away the rally smart-money is still not fully in the market and in the sidelines this can be a indication for more bearish pressure assuming over the course of next weeks and months.
In this manner, thank you for watching, support for more market insight and have a good day!
“Forecast is a mixed fortune in todays market environment. ”
Information provided is only educational and should not be used to take action in the markets

US30 DOW JONESTRADE IDEA: US30 4H been a while looking at indice market,but today US30 caught my eye as the market strongly rejected at weekly price level 35678.81 giving us those strong bearish candlesticks all the way till 35217.91 then we had a bearish correction,as i prepare to look for selling opportunities just below my monthly resistance level 35480.23 where we can see candlestick rejection preparing to melt looking forward to a new structure formation.

Dow jones buyIm buying this currency pair based of monthly key levels and the consistent higher highs on a daily time frame, it has higher lows also so i dont want to be caught selling.
