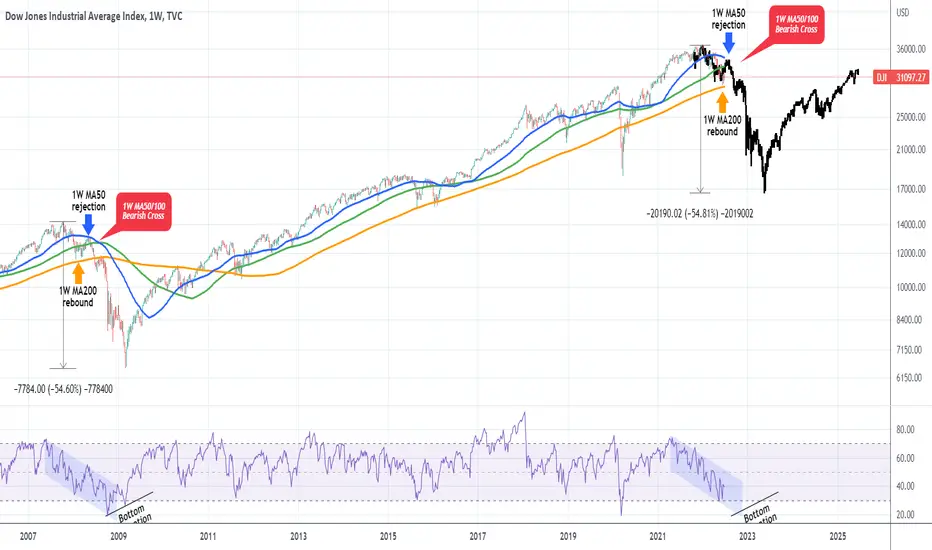
DOW JONES repeating the doom fractal of 2008??This analysis on the 1W time-frame illustrates the Dow Jones Industrial Average (DJI) on the log scale. The emphasis is on the comparison of this year's correction with the Subprime Mortgage Crisis that started after the October 2007 peak and bottomed in March 2009.
As you see so far this year's correction has been following the fractal extremely closely. Emphasis is given on the fact that at the moment we seem to be at the point where the price is rebounding after near contact with the 1W MA200 (orange trend-line) similar to March 2008. If we get a rejection on the 1W MA50 (blue trend-line) by the end of the Summer, then the fractal will get most likely confirmed and a 1W MA50/100 Bearish Cross after a break below the 1W MA200, can initiate the final and most aggressive part of the index collapse. That may take us to levels not see since early 2016.
Now of course that comparison alone can't form any trading strategies but could be used as a long-term benchmark for entering/ exiting on time. Even the 1W RSI sequences are so far identical as the sentiment of realism vs denial certainly seems to be in the early 2008 levels.
Food for though for sure. What's your opinion?
--------------------------------------------------------------------------------------------------------
** Please support this idea with your likes and comments, it is the best way to keep it relevant and support me. **
--------------------------------------------------------------------------------------------------------
Jones
BTC is looking exactly like the fractal after great depression BTC is looking like the DOW JONES after the great depression occurred.
This suggests a strong Bullish market around the corner in Bitcoin.
I will be watching closely so I can best take advantage of buying setups.
Excited about these patterns!
Stay profitable.

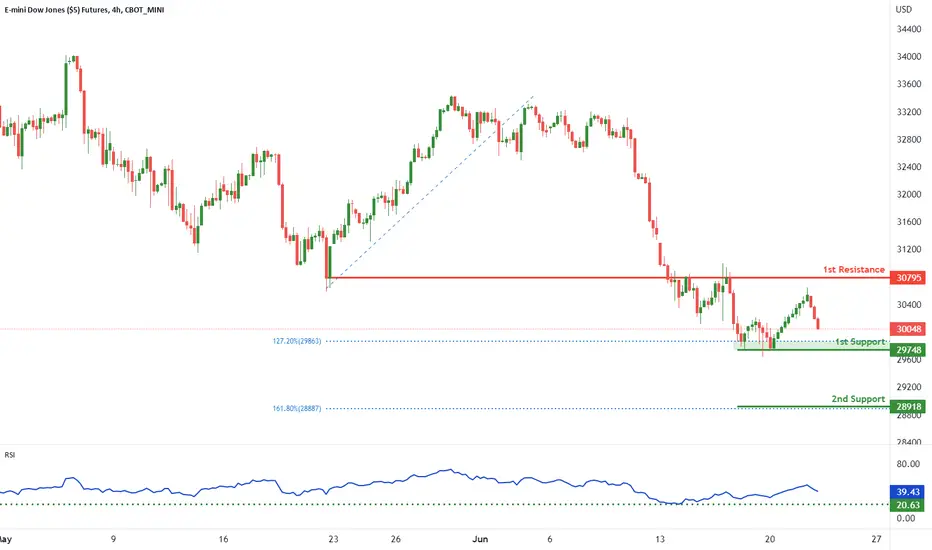
Dow Jones potential for a drop! | 22nd June 2022On the H4, with price expected to bounce off the stochastics indicator, we have a bullish bias that price will rise from our 1st support at 29748 where the 127.2% Fibonacci extension is to our 1st resistance at 30795 in line with the horizontal pullback support. Alternatively, price may break structure and head for 2nd support where the 161.8% Fibonacci extension is.
Any opinions, news, research, analyses, prices, other information, or links to third-party sites contained on this website are provided on an "as-is" basis, as general market commentary, and do not constitute investment advice. The market commentary has not been prepared in accordance with legal requirements designed to promote the independence of investment research, and it is therefore not subject to any prohibition on dealing ahead of dissemination. Although this commentary is not produced by an independent source, FXCM takes all sufficient steps to eliminate or prevent any conflicts of interest arising out of the production and dissemination of this communication. The employees of FXCM commit to acting in the clients' best interests and represent their views without misleading, deceiving, or otherwise impairing the clients' ability to make informed investment decisions. For more information about the FXCM's internal organizational and administrative arrangements for the prevention of conflicts, please refer to the Firms' Managing Conflicts Policy. Please ensure that you read and understand our Full Disclaimer and Liability provision concerning the foregoing Information, which can be accessed on the website.

DOW JONES Critical Channel bottom test.Dow Jones (DJI) has been trading within a Channel Down since its All Time High on January 04 2022. It is the very same Channel on which we based the accurate sell call 10 days ago as the price failed to break above the 1D MA50 (blue trend-line) for more than a week:
Right now the index broke below the previous Support and made a new Low. In fact it is exactly on the Lower Lows trend-line of the Channel. The 1W MA200 (red trend-line) is at 29300 but if it closes a 1D candle below the Lower Lows trend-line, it will most likely break below the 1W MA200 as well and reach the -0.236 Fibonacci extension around 28770.
Until that happens, we have to follow the accurate long-term pattern and go on a tight SL buy towards the Lower Highs (top) trend-line around 33000. The 1D RSI is just above the oversol 30.00 level which has worked as a buy entry for many months.
--------------------------------------------------------------------------------------------------------
** Please support this idea with your likes and comments, it is the best way to keep it relevant and support me. **
--------------------------------------------------------------------------------------------------------

Dow Jones Potential bullish rise | 9th June 2022On the H4, with RSI moving in an ascending trendline, we have a bullish bias that price will rise from our 1st support at 32685 where the horizontal swing low support and 38.2% fibonacci retracement are to our 1st resistance at 34042 in line with the swing high resistance and 161.8% Fibonacci extension. Alternatively, price may break structure and head for 2nd support at 31876 where the pullback support, 78.6% fibonacci projection and 78.6% fibonacci retracement are.
Any opinions, news, research, analyses, prices, other information, or links to third-party sites contained on this website are provided on an "as-is" basis, as general market commentary, and do not constitute investment advice. The market commentary has not been prepared in accordance with legal requirements designed to promote the independence of investment research, and it is therefore not subject to any prohibition on dealing ahead of dissemination. Although this commentary is not produced by an independent source, FXCM takes all sufficient steps to eliminate or prevent any conflicts of interest arising out of the production and dissemination of this communication. The employees of FXCM commit to acting in the clients' best interests and represent their views without misleading, deceiving, or otherwise impairing the clients' ability to make informed investment decisions. For more information about the FXCM's internal organizational and administrative arrangements for the prevention of conflicts, please refer to the Firms' Managing Conflicts Policy. Please ensure that you read and understand our Full Disclaimer and Liability provision concerning the foregoing Information, which can be accessed on the website.

DOW JONES Consolidating below the 1D MA50 for a weekDow Jones (DJI) eventually rebounded at the bottom (Lower Lows trend-line) of its long-term Channel Down, since our last analysis that indicated a sold R/R ratio for going long:
Since the end of May though, the index has failed just before a 1D MA50 (blue trend-line) test and turned sideways below that level. This is similar to the last Lower High formation on the Channel Down, as shown on the previous analysis.
Technically, as long as the price remains below the Lower Highs trend-line, it is a sell (on a tight SL of course) opportunity towards the 30650 Support and if that breaks, towards the -0.236 Fibonacci extension around 29500.
Even in the event of a break-out, we still can't call a long-term bullish reversal as the range within roughly 34150 - 35540 is a Neutral Zone (we can apply tight scalping strategies there) as late March - late April showed. Only with a weekly candle close above the 35875 Resistance, we can assume that Dow has resumed its long-term bullish trend.
--------------------------------------------------------------------------------------------------------
Please like, subscribe and share your ideas and charts with the community!
--------------------------------------------------------------------------------------------------------

DJI potential for rise! | 26th May 2022On the H4, with price expected to bounce off the ichimoku cloud, we have a bullish bias that price will rise to our 1st resistance at 32696 where the swing high resistance is from our 1st support at 31886 in line with the pullback support, 78.6% fibonacci retracement and 61.8%% fibonacci retracement. Alternatively, price may break 1st support structure and head for 2nd support at 31491 where the horizontal swing low support is.
Any opinions, news, research, analyses, prices, other information, or links to third-party sites contained on this website are provided on an "as-is" basis, as general market commentary, and do not constitute investment advice. The market commentary has not been prepared in accordance with legal requirements designed to promote the independence of investment research, and it is therefore not subject to any prohibition on dealing ahead of dissemination. Although this commentary is not produced by an independent source, FXCM takes all sufficient steps to eliminate or prevent any conflicts of interest arising out of the production and dissemination of this communication. The employees of FXCM commit to acting in the clients' best interests and represent their views without misleading, deceiving, or otherwise impairing the clients' ability to make informed investment decisions. For more information about the FXCM's internal organizational and administrative arrangements for the prevention of conflicts, please refer to the Firms' Managing Conflicts Policy. Please ensure that you read and understand our Full Disclaimer and Liability provision concerning the foregoing Information, which can be accessed on the website.

DOW JONES 1 month target at 33170 unless the Low breaks.Dow Jones (DJI) has been trading within a Channel Down throughout this whole 2022 correction. Friday's low along with the 1D RSI sequence, resemble the bottom fractal of the last Lower Low within the Channel Down on March 08. The index rebounded to just above the 0.618 Fibonacci retracement level at the time to price the Lower High. Currently the 0.618 Fib is around 33670. That is our target on a 1 month horizon, unless Friday's low breaks, in which case we will sell hedge it to the -0.236 Fib extension at 29500.
--------------------------------------------------------------------------------------------------------
Please like, subscribe and share your ideas and charts with the community!
--------------------------------------------------------------------------------------------------------

Dow Jones potential for a drop! | 18th May 2022On the H4, with price moving below the ichimoku cloud, we have a bearish bias that price will drop from our 1st resistance at 32553 where the 50% Fibonacci retracement is to our 1st support at 31294 in line with the swing low support. Alternatively, price may break 1st resistance structure and head for 2nd resistance where the 78.6% Fibonacci retracement.
Any opinions, news, research, analyses, prices, other information, or links to third-party sites contained on this website are provided on an "as-is" basis, as general market commentary, and do not constitute investment advice. The market commentary has not been prepared in accordance with legal requirements designed to promote the independence of investment research, and it is therefore not subject to any prohibition on dealing ahead of dissemination. Although this commentary is not produced by an independent source, FXCM takes all sufficient steps to eliminate or prevent any conflicts of interest arising out of the production and dissemination of this communication. The employees of FXCM commit to acting in the clients' best interests and represent their views without misleading, deceiving, or otherwise impairing the clients' ability to make informed investment decisions. For more information about the FXCM's internal organizational and administrative arrangements for the prevention of conflicts, please refer to the Firms' Managing Conflicts Policy. Please ensure that you read and understand our Full Disclaimer and Liability provision concerning the foregoing Information, which can be accessed on the website.

DJI - Historic ComparisonDoes history repeat itself?
Comparing Macro Environments and getting a clue from the charts.
Lets follow this idea over the months to come.
cheers!

US30 SELLUS30 Sell,
using the same strategy as in forex I am see how I translates
FVG + Order Block into FVG 1H

DIA (Dow Jones ETF) - Weekly - Support, Resistance, TrendlinesDIA (Dow Jones ETF) - Weekly chart.
Support, Resistance, Trendlines for reference.
05/11/2022.

DOW JONES Bullish on Higher Lows but mind fractal continuationThe Dow Jones index (DJI), eventually fulfilled the selling sequence of January's fractal which I mentioned as possibility on my last analysis:
The index is now very close to the Higher Lows trend-line of the February 24 Low and even though the January fractal hints to more selling, if the Higher Lows hold, I expect a rebound towards the 0.618 Fibonacci retracement level at around 34350, as in Jan. A 1D candle close below the Higher Lows though, keeps the fractal intact and we can see the 32240 Support being tested, even a new Lower Lows trend-line towards the -0.236 Fibonacci extension but for this very pessimistic scenario, a strong bearish catalyst is needed, but it's often found during earnings seasons.
--------------------------------------------------------------------------------------------------------
** Please support this idea with your likes and comments, it is the best way to keep it relevant and support me. **
--------------------------------------------------------------------------------------------------------

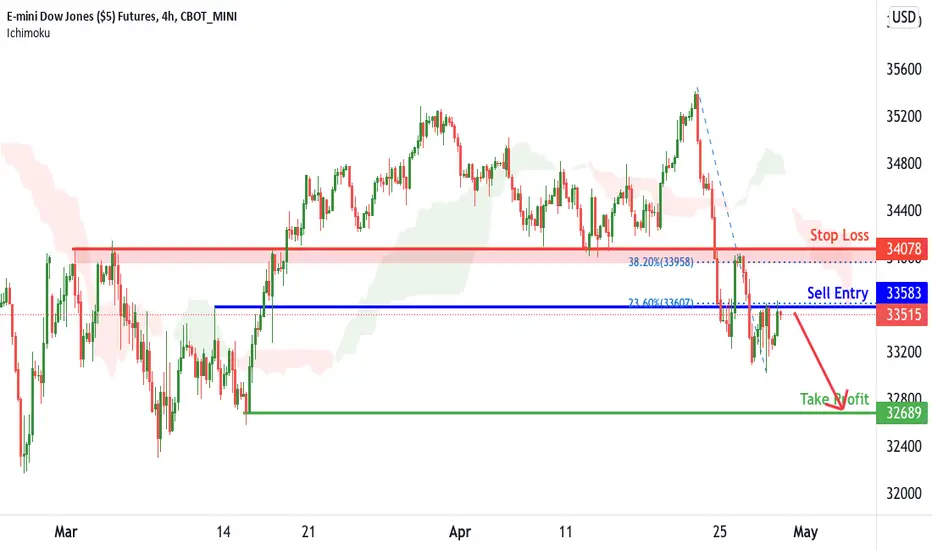
DJI Potential bearish drop | 28th Apr 2022On the H4, with price moving below the ichimoku cloud, we have a bearish bias that price will drop from our entry at 33583 where the horizontal overlap resistance is to our take profit at 32689 in line with the horizontal swing low support. Alternatively, price may break structure and head for stop loss where the horizontal overlap resistance and 38.2% Fibonacci retracement is at 34078.
Any opinions, news, research, analyses, prices, other information, or links to third-party sites contained on this website are provided on an "as-is" basis, as general market commentary, and do not constitute investment advice. The market commentary has not been prepared in accordance with legal requirements designed to promote the independence of investment research, and it is therefore not subject to any prohibition on dealing ahead of dissemination. Although this commentary is not produced by an independent source, FXCM takes all sufficient steps to eliminate or prevent any conflicts of interest arising out of the production and dissemination of this communication. The employees of FXCM commit to acting in the clients' best interests and represent their views without misleading, deceiving, or otherwise impairing the clients' ability to make informed investment decisions. For more information about the FXCM's internal organizational and administrative arrangements for the prevention of conflicts, please refer to the Firms' Managing Conflicts Policy. Please ensure that you read and understand our Full Disclaimer and Liability provision concerning the foregoing Information, which can be accessed on the website.
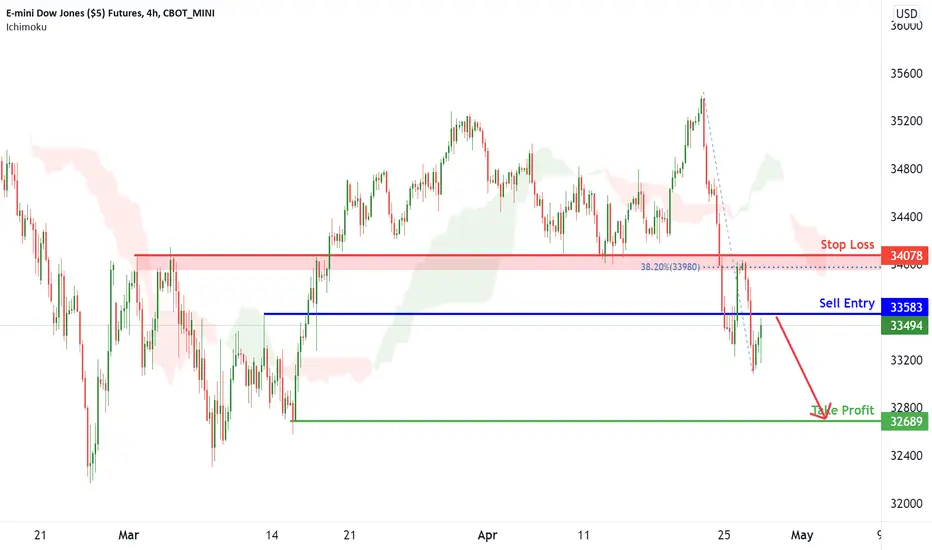
DJI Potential drop | 27th Mar 2022On the H4, with price moving below the ichimoku cloud, we have a bearish bias that price will drop from our entry at 33583 where the horizontal overlap resistance is to our take profit at 32689 in line with the horizontal swing low support. Alternatively, price may break structure and head for stop loss where the horizontal overlap resistance and 38.2% Fibonacci retracement is at 34078.
Any opinions, news, research, analyses, prices, other information, or links to third-party sites contained on this website are provided on an "as-is" basis, as general market commentary, and do not constitute investment advice. The market commentary has not been prepared in accordance with legal requirements designed to promote the independence of investment research, and it is therefore not subject to any prohibition on dealing ahead of dissemination. Although this commentary is not produced by an independent source, FXCM takes all sufficient steps to eliminate or prevent any conflicts of interest arising out of the production and dissemination of this communication. The employees of FXCM commit to acting in the clients' best interests and represent their views without misleading, deceiving, or otherwise impairing the clients' ability to make informed investment decisions. For more information about the FXCM's internal organizational and administrative arrangements for the prevention of conflicts, please refer to the Firms' Managing Conflicts Policy. Please ensure that you read and understand our Full Disclaimer and Liability provision concerning the foregoing Information, which can be accessed on the website.
Dow Jones Potential bullish rise | 25th Apr 2022On the H4, with price moving above the ichimoku cloud, we have a bullish bias that price will rise to our 1st resistance at 34078 where the overlap resistance is from our 1st support at 33354 in line with the horizontal pullback support and 61.8% Fibonacci retracement. Alternatively, price may break 1st support structure and head for 2nd support where the horizontal swing low support is at 32670.
Any opinions, news, research, analyses, prices, other information, or links to third-party sites contained on this website are provided on an "as-is" basis, as general market commentary, and do not constitute investment advice. The market commentary has not been prepared in accordance with legal requirements designed to promote the independence of investment research, and it is therefore not subject to any prohibition on dealing ahead of dissemination. Although this commentary is not produced by an independent source, FXCM takes all sufficient steps to eliminate or prevent any conflicts of interest arising out of the production and dissemination of this communication. The employees of FXCM commit to acting in the clients' best interests and represent their views without misleading, deceiving, or otherwise impairing the clients' ability to make informed investment decisions. For more information about the FXCM's internal organizational and administrative arrangements for the prevention of conflicts, please refer to the Firms' Managing Conflicts Policy. Please ensure that you read and understand our Full Disclaimer and Liability provision concerning the foregoing Information, which can be accessed on the website.

Dow Jones Futures - retesting $36,000All eyes on the Dow futures /YM. The Dow has not been able to sustain above the $36,000 level for several months now. Will it finally have the momentum to go to newer heights?

USDOLLAR potential for bullish continuation! | 11th March 2022Prices are on bullish momentum and consolidating in a parallel channel. We see the potential for further bullish continuation from our buy entry at 38.2% Fibonacci retracement towards our Take Profit at 12346 in line with 100% Fibonacci Projection and 61.8% Fibonacci retracement. Prices are trading above our ichimoku cloud support, further supporting our bullish bias.
Any opinions, news, research, analyses, prices, other information, or links to third-party sites contained on this website are provided on an "as-is" basis, as general market commentary, and do not constitute investment advice. The market commentary has not been prepared in accordance with legal requirements designed to promote the independence of investment research, and it is therefore not subject to any prohibition on dealing ahead of dissemination. Although this commentary is not produced by an independent source, FXCM takes all sufficient steps to eliminate or prevent any conflicts of interest arising out of the production and dissemination of this communication. The employees of FXCM commit to acting in the clients' best interests and represent their views without misleading, deceiving, or otherwise impairing the clients' ability to make informed investment decisions. For more information about the FXCM's internal organizational and administrative arrangements for the prevention of conflicts, please refer to the Firms' Managing Conflicts Policy. Please ensure that you read and understand our Full Disclaimer and Liability provision concerning the foregoing Information, which can be accessed on the website.

DOW JONES INTO GREEN TREND - low time frameHello trading friends,
dow jones and other important trend stocks could make a difference in different markets - and it's important to follow it to see last trends
Know that since Ukraine and Russia - there could be many unexpected trends - most traders know that even without seeing the news trends - depending on TA and the right risk management could they be still into long-term profitable trades. most news is also played already out.
Also, we have seen that BTC depends last times on dow jones trends.
What is the trend of dow jones at this moment?
We have seen more times dow jones did try to confirm for an uptrend, from there it did breakdown , also with some panic trends on the countries we did add - further, at this moment Dow Jones did not confirm the breakdown trend - and are into low time frame on green trend.
It's important that dow jones confirm also the main trend of the uptrend - we could see this coming time a breakout if this trend happened.
Have a great day
Give your nice like - if you like content and follow for more updates

Will the Dow Jones bounce off this trend line?Just sharing this idea to see what everyone thinks, the Dow Jones has already bounced off the top trend line and now looks like it will test it again, will it bounce off the trend line again?


DOW JONES SHOWS BREAKDOWN TRENDS - WITH POSSIBLE NEW FALLHello trading friends,
The opening of dow jones - looks to enter a new downtrend coming time.
There are also new world changes that could make this trend go into breakdown - into trading there is noting called 100% right - so on this way manage your risk at all time.
Data
Data shows that us30 depending on the last trends Ukraine and Russia - and since we have today a new call enter that Ukraine wants to come into EU - and that some countries accept that - could means this for the Russia conflict , as we know Russia never would accept this, and could be much worse - and depending on this expecting it could change the price action coming time for dow jones. there is still noting confirmed - but the step looks near.
The target could go back to 32300 and below. this could bring new fall to dow jones.
BTC follows the trend of dow jones, and we have seen this more times. what means BTC will also break down when that happens.
Coming times with this new weekly chart it's important to follow the trends.
Have a great day.
Markets go on their way, and it can take some time before it shows some new changes.
When there is expecting for breakdown trend - it means not that it should go directly to the target.
@ Peace to anyone - The war has only bad effects.
