JP MORGAN (JPM)96.3$ is possible target of impulse wave 3.
the impulse wave #4 has several possible targets:
# 67.26
# 78.34
# 82.18
# 85.19
Lets wait for correction and first of all wait for confirmation of end the impulse wave #3
JPM

Technical Double Top Could Lead to JP Morgan Chase (JPM) DropJP Morgan Chase & Co recently achieved a double top pattern. This pattern is a significant technical signal that normally sends the stock down to a common level of support. The double top and other technical indicators are detailed below. JP Morgan Chase has been in a long term bull trend and will most likely continue after the stock drops.
When we look at technical indicators, the relative strength index (RSI) is at 55.7791. RSI tends to determine trends, momentum, overbought and oversold levels as well as likelihood of price swings. I personally use anything above 75 as overbought and anything under 25 as oversold. Currently the RSI is neutral and has been moving downward. It is roughly at the same level it was last time a top was reached. This lead to a continual decline for the RSI and the stock. This is the first indication of likely downward movement in the short-term.
The positive vortex indicator (VI) is at 0.9785 and the negative is at 0.9991. When the positive level is higher than 1 and higher than the negative indicator, the overall price action is moving upward. When the negative level is higher than 1 and higher than the positive indicator, the overall price action is moving downward. The positive and negative levels have been moving in a manner consistent with downward movement for the stock The negative indicator has been rising at the same time the positive has fallen. They have just passed each other which will lead to a continual decline for the stock. Once again, this indicator is roughly at the same level it was when the last top was declining. This is the second indication of likely downward movement in the short-term.
The stochastic oscillator K value is 63.1339 and D value is 76.4461. This is a cyclical oscillator that is highly accurate and can be used to identify overbought/oversold levels as well as pending reversals and short-term activity. I personally use anything above 80 as overbought and below 20 as oversold. When the K value is higher than the D value, the stock is trending up. When the D value is higher that the K value the stock is trending down. The stochastic is departing overbought territory which tends to lead to a decline for the stock. This is the third indication of likely downward movement in the short-term. This indicator is also near the same level it was as the last top was declining.
SPECIFIC ANALYSIS
The first top occurred in early March. The stock proceeded to drop 13.13% over the next 62 trading days before rising again. The light blue line across the chart represents 86.56 which has been a commonly hit mark for the stock in its recent uptrend. The aforementioned top to this level took 14 trading days to occur and resulted in a 7.90% drop.
Since the stock first broke above the 86.56 mark in December 2016, that line was in a trading day's range 43 times. That is 30% of the previous 144 trading days. This common level will most likely be hit or provide support for the stock over the following 41 trading days.
The final level studied which is most strongly dictating my conservatively placed projection is a Fibonacci retracement. According to Investopedia, "Fibonacci retracement is created by taking two extreme points on a stock chart and dividing the vertical distance by the key Fibonacci ratios of 23.6%, 38.2%, 50%, 61.8% and 100%.". A 61.8% retracement from the bottom to the top of the recent vertical distance marries up exactly with the 86.56 level. If the stock were to give back 100% of its most recent movement (May 31 low of 81.64 to July 6 high of 94.51) the stock would drop to 81.64. This is the fourth indication of likely downward movement in the short-term.
Considering the RSI, VI, stochastic levels, and recent movement from the last top, the stock should see downward movement over the short to intermediate time period. Based on historical movement compared to current levels, the stock could drop at least 5% over the next 29 trading days if not sooner.

XLF potential bearish engulfing pattern forming.The XLF was off to the races this morning as the longer-dated maturities of the yield curve sold off, increasing the spread captured by banks who borrow-short and lend-long. In the middle of the day a key reversal occurred, setting us up for a bearish engulfing candle. This chart pattern is a rally above the previous day's high and a close below the previous day's low, and has a high probability of follow-through selling.

Testing a weekly resistance zone before earningsWFC is testing the top of a consolidation range before earnings.
WFC has been consolidating since it broke below a weekly uptrend line.
Bearish? Short as long as below 60$
Bullish? Buy the breakout?

Financials about to complete a second bearish harmonic patternNotice the Sell Zone shown in this chart

Watching a possible bearish cypher patternCompletion at 91.34 with PT1: 38.2% of CD leg, PT2: 61.8% of CD leg.

JP Morgan - Break below rising trend line would revive bearsThe chart shows fake head and shoulders breakdown. Only a break below the rising trend line would revive the bearish view.


JP Morgan Chase - Head and Shoulders BreakdowThe stock price looks set to test $75.00 levels (target as per the measured height method) in the wake of a flatter yield curve and a head and shoulders breakdown pattern

Bullish Symmetrical TriangleLike JPM and XLF to go higher from here, but I decided to put scarce capital to work in TSLA puts today instead: xdaystogo.com

WELLS FARGO and JPMORGAN CHASE UPDATE. I told you guys I couldn't afford two trades going against me. Am I worried about my WFC bull spread? A little. NOT because I think WFC is on a downward spiral BUT because I don't know if it'll get in my range in time (53ish). It won't stay down for long that I do know. I just hope it does it in time. I have a lot of trades going against me. WFC, HLF, and EBAY (I got into it by accident, LONG STORY) but anyways i'm optimistic about all of my trades (maybe not EBAY, i'm neutral on it by the way) we shall see. So far I got two winner trades this year. URBN and LULU. I'm going to keep on keeping on. Atleast I knew JPM was going down on earnings. I did underestimate WFC though but it wasn't slaughter. JPM's hit was a bit more blunt and I also expect JPM to go up, even faster than WFC although I know banks follow eachother, but WFC can't catch a break. NOT LIKE THEY DESERVE IT!! THEY WONT EVEN HIRE ME! haha

JPM continues to see strengthWith the enactment of deregulation on Dodd-Frank, large banks are gapping up to a higher level. Since Trump's election, JPM has jumped almost 30% and it's gonna retest 88 so as to open the new territory.

More upside potential towards earnings...butBAC monthly chart analysis shows two things:
1) The post elections rally drove Bank of America above a major weekly structure zone (18$) that now should act as support (green box)
2) Next major structure zone is way up near 25$. Also where the price will meet the 200 months MA line and complete a bearish AB=CD pattern.
We are talking about a 10% additional rally in a stock that already doubled itself since 2015.
Will we see another push higher without any pullback?
Earnings are scheduled this week. The bearish scenario (short term pullback) involves a weekly Pinbar pattern. The bulls can either wait for the pullback to create better opportunities or bet blindly on the bullish sentiment that continues to dominate the market.
RSI and Stochastic are overbought but no Sell Signal provided yet..
Read more about BAC, JPM, XLF and DXY in this week's newsletter


JP Morgan remains strong - outperforming SP500The underlying bullish trend remains intact, as prices post new highs. Momentum studies are already overstretched, however, but downside risks are likely to remain limited as monthly studies remain strong and investors maintain a buy-into-dips strategy.
JP Morgan is also outperforming the SP500, and as a proxy for the broader based US Financials Sector, asset managers are likely to maintain an overweight stance in this sector.


JPM , Could certainly sufferIs no mystery that the banking sector uses after the elections will suffer a slowdown

Barclays PLC GETTING READY TO FILE BANKRUPTCY BY 2022From 2007 high it is going down trend. And now in near future it will re-test the 2009 low around $2.75.(see green line in the chart) If it fails to hold then BCS will go pennies on the dollar. Though you might have missed the maximum profit ratio by shorting but still you guys have some hope as it is only trading around $8 range and soon it will free fall. Good luck to you all. It will be a painful as those trickling down might take some time.

FAREWELL TO WELLS FARGOBlack line a Temporary bounce after hitting the black line but most aggressive manipulators can hold for the below line for max profit.
There will be a strong bounce once hits this Red support line but once broke it will go down to $4 or below. Take out profit and go short after few weeks.
===============================
At least this is the start of the another financial crisis which well may come after election or post summer 2017. All the financials banks will start to collapse.

Good news for JP MorganIt is in my list to go short with options in few months. May before or after election. Let see!!!!
Black line 1st degree is a very strong support line. So bounce expecting when it touches and then side wise choppy trade and will be short lived bounce. Eventually it will break the 2009 line and then the territory will be a free fall. Take your money out from the bank before it shuts down. Because the last support zone I can see is in 2009 low.


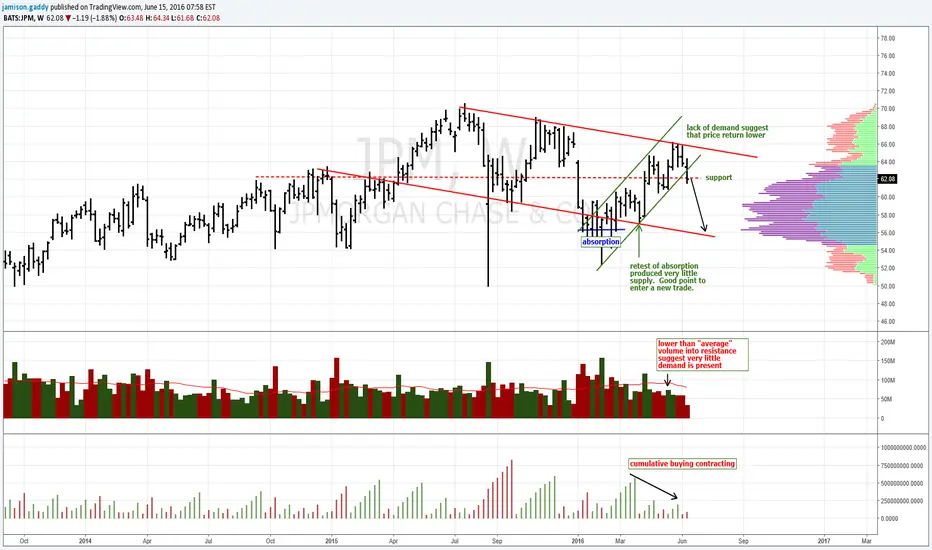
10% downside if $62 is lostGS was clear signs of buying or bullish absorption earlier this year. Early April GS pullback to test and define the number of "weak hands" that were remaining. The test produced very little selling and resulting in price finding bids into resistance.
Now that the "gap" is closed there appear to be very little demand and a weak close for the week would imply that we trade lower to retest the conviction of previously identified bulls. If so longs could be exposed to 10% risk.
Good Luck