EURUSD [10DEC2021]Followup to previous plan, I didnt get to short it because it wasn't at the top end of the range. And today it seems to have lost it's bearish background. I'm staying out of this for today.
Similar signal observed in different places. I will post em here
Bullishness weakened (still bullish) - SPY, DJ30, TSLA, BTC-USD, US10Y, USDSGD
Bearishness weakened (still sorta bearish) - Nikkei (beginning bearish run), BYND, Gold, PLTR
Redd
Nikkei 225 JPN225 CFD

A Perfect Example for "Price Action Trading Strategy" - #JPN225Watch the market carefully in between the two lines and get ready to take action for both scenarios.

Pivot Points StrategyPivot points can be used as entry points for new trades or as a close signal for the existing ones.
There are different types of pivot points with a different mathematical formula or simply using previous highs and lows.
HOW TO TRADE PIVOT POINTS
The following scenarios work with the Traditional Pivot Points
For the Camarilla version normally R and S are closer to the price and we use a different setup.
Trading setup #1 (Not so strong trend): Open price is between R1 and S1
Long when the price moves back above S1 after going below S1. Target will be P, R1, R2, .. levels.
Place Stop loss at the S2 level
Wait for the price to go above R1 and then when it moves back below R1 again, go short.
Profit target will be P, S1, S2 S3 levels and stop-loss above R2
Trading setup #2 (Normally very trendy bullish markets): Open price is between R1 and R2
Buy or go long when the price moves back above R1 again after going below R1. Target will be R2,
Place stop loss at R1
Wait for the price to go above S1 and then when it moves back below S1 again, sell or go short.
Target will be S2 levels, and the stop loss will be above P.
Trading setup #3 ( Very trendy bearish market ): Open price is between S1 and S2
Wait for the price to go above S1 and then when it moves back above S1 again, then go long.
Target will be P, R1, R2 levels, and stop-loss below S2.
Wait for the price to go below S4 and then when it moves below S2, go short.
Place stop loss above S1.
Trading setup #4 (High probability for a trend reversal or correction): Open price is above R2
Buying can be risky at this level. Wait for the price to go below R2.
As soon as the price moves below R1. go short.
Place stop loss above R3. Target S1, S2, or P
Scenario #5 (High probability for a trend reversal or correction): Open price is below S2
Selling could be risky at this level as the price has opened with a big gap down.
Wait for the price to go above S1.
When the price moves above S1, buy
Place a stop loss of S2. Target R1, R2, and P.


JP225USD Due to the breaking of the last High of the uptrend, the price is in a correction and returns to the previous floor Of course, to enter the selling position, you must enter safely

JPN225 Bullish moveNikkei open with a gap on and still about to close the gap and test our vertical support before it rallies to the high

Nikkei225, Trade and trend ranges [2NOV2021]You can see in my previous plan where signal went extreme bullish.
Japan's economy is different from US. Modelling it quantitatively is also different. It is still seen as bullish by the signal at the moment, and the bullishness in the short and long term yields, I believe Nikkei will make a new ATH soon, but has a massive 3% downside potential too, so it's better not to go into margin with this one and shorting isn't a good idea either. Let's hope for a dip and see if we can get our hands dirty.
PS. Each box span a day, and the code gives short term and long term trends as shown. the trend is shown with the color of the box. The range is calculated on a daily basis.
If you want similar ranges and trends on your ticker, feel free to contact me, I will add them to my list and provide them when the signal is interesting (for free of course)
Redd

JPN225 Future Bullish moveJPN225 currently just tested support in our bullish channel and its about to rise for more weeks to come as BOJ is about to make Interest rate decision this morning at 04:30 (GMT +2) ZA time that will serve a trigger for our pattern to continue.

Nikkei Analysis 1D | Outlook• Nikki Japan's long-term outlook on daily timeframes •
.
• Friends, remember the numbers listed on the chart, if the price moves to the upper or lower area indicated on the chart, trading positions can be used.
.
• Area 28700 has the highest volume of transactions in the last 10 months, and is an important area! Failure of the price from this area will push the price up or down to the next targets in its direction.

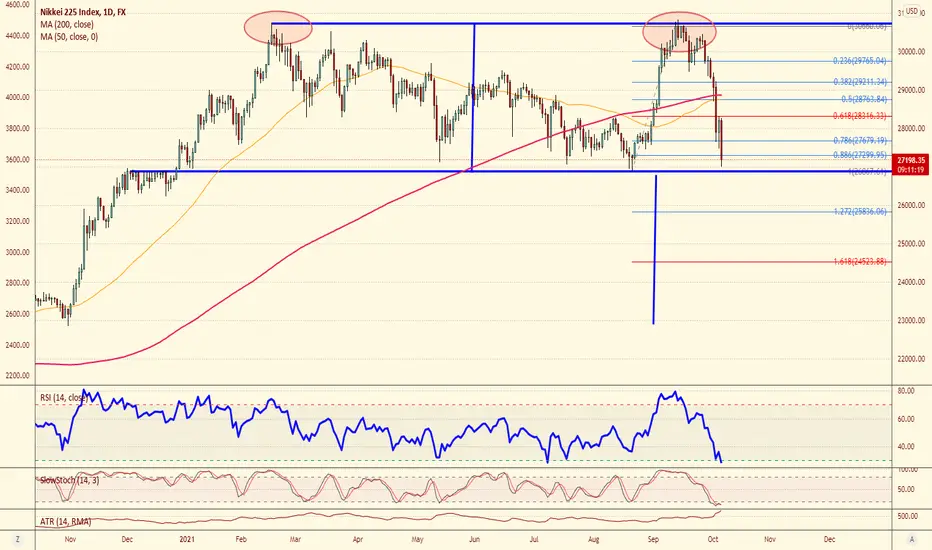
Nikkei double top projecting 15% drop in the coming months This double top in the Nikkei would suggest about a -15% drop from current levels if it plays out. Break of the neckline and being long JPY (short XXXJPY) would be a way to play this like short EURJPY or NZDJPY

BUY JPN225 NIKKEI BUY SETUP Hello Traders another free setup for you all,
Enter JPN225 @ 30100
Take Profit @ 30620 ( 520 Points)
Stop Loss 29900 ( Only 200 Points )
Enjoy and Good Luck ;)

NI225 Nikkie - more upsideI'm loaded into Asian markets so quick sketch of the Nikkie to identify exit point.
Still more upside here in short term but can't compete with the India+ markets
Best, HF

JP225 wiill be a bearish trend.This is a JP225 monthly chart.
It is forming “Black Swan”
So,It’ll be a bearish trend.
I think it's a good idea to set up “Short”,
and make profit at 24,000 JPY.
Good luck.

Stocks - Nikkei on Last LegsIdea for Nikkei:
I'm waiting for Asia markets to drag down US markets, but why not just short Asia itself first?
- The sugar rush of QE is over, and Japan is rolling over. Expecting its bear market since Feb to resolve in a capitulation at least down to a monthly support.
- Nikkei under 100D and 9M and at critical support. (50W)
- Expect to quickly capitulate to 24k~ support levels when this floor breaks.
This is not US markets, which rises based solely on gamma, and the slowing global economy is weighing down on it. IMO, any rips here should be sold.
50W:
20M:
GLHF
- DPT

Nikkei 225 look for 25522 areaShort position below 28219.98 with target at 26203.5 & 25522 in extension.
Daily Pivot : 28219.98
My move : Short position below 28219.98 with target at 26203.5 & 25522 in extension.
Other possibilities : Above 28219.98 look for 28856 & 29465 as target.
+ reason : RSI is bearish and further downside
TAYOR

Bullish flag on 225JPY. Price failed to break previous low creating today a higher high on the daily chart, indicating a possible market structure shift. RSI three touch bullish divergence. Market structure broke previous minor resistance adding another confluence. Overall bigger trend is bullish while minor trend is bearish. Looking for a break of the flag and continuation. Usually this patterns take a while to break so will be taken as a swing trade.

Bearish on NikkeiNI 225 looking to consolidated. Like IXI, we are more or less at the beginning of the downtrend. Some goals are provided in purple as well. RSI show dropping momentum.
None of the above is financial advice, please do your own research - your trades are your trades.

Elliott Wave Analysis: NIKKEI Remains BullishHello traders and investors!
Today we will talk about Japanese Index NIKKEI 225 in which we see very clear bullish pattern.
As you can see, NIKKEI made an A-B-C corrective decline from the highs and the main reason why we think it's a correction within uptrend is because of a triangle within wave B in the middle. We know that triangles cannot occur in wave 2, so it must be wave B as part of an A-B-C correction.
The Next very important evidence that A-B-C correction is completed is recent five waves up from the lows and we know that a five-wave reversal indicates a change in trend, so NIKKEI will probably stay in the uptrend.
However, in EW theory, after every five waves, a three-wave pullback follows, so before we will see a continuation higher, be aware of a corrective slow down with ideal support in the 28800 - 28300 zone. Of course, pullbacks could be even deeper, so count remains valid as long as the price is trading above 27400 May lows.
Be humble and trade smart!
If you like what we do, then please like and share the idea!
Disclosure: Please be informed that information we provide is NOT a trading recommendation or investment advice. All of our work is for educational purposes only.


Rounding top with successive higher lowsI'm waiting to see if 27,500 gets broken for a potential short entry.
The successive higher lows and the falling RSI warns of an impending fall.

Nikkei225 - Great trade Opportunity! Nikkei 225 - Great Trade Opportunity!
What a great set up, right? I've been shorting NI225 for while. If you're subscriber of our weekly newsletter, you probably got in earlier at a better risk/reward! If you are subscriber - Thanks I appreciate it and if you aren't you're missing out! I post my analysis late on Trading View for great trade ideas...Subscribe now - Link will be down in the comment section (It's FREE & always will be) We will be changing the privacy settings soon for ONLY subscribers to see our content!
Now let's dive into the exciting Technical aspects:
Longer Term pattern: Triangle
Shorter Term Pattern: Bear Flag / Wedge
Key Support & Resistance Areas: 28000 - 28400
Key Tip: You could go to towards lower time frames to get a better price.
All the best,
Trade Journal
(Just a trade idea, not a recommendation)
