SE CUMPLIRA LA SEGUNDA COMPRA?HE REALIZADO DOS COMPRAS DESDE EL DIA DE AYER POR LA NOCHE, YA SE CERRO LA PRIMERA (EN POSITIVO), QUE PASARA CON LA SEGUNDA?
Nikkei 225 JPN225 CFD

NIKKEI225 LONG; Best of the G10, long term.Currently the best outlook of the developed markets.
- As opposed to the DAX and US Equities, the former being an absolute dog, the later under a mass delusion price wise.
The DAX
E.g. If one must be long Equities, the proper spread would be LONG NIKKEI, CAC, SHORT Dow, DAX.
This spread has an annual 8%-10% advantage, including FX differentials, over any other G10 Equity Long!

Nikkei over extendedWhat a rip on Nikkei. Very over extended and what looks to be a double top on 4hr. Looking for reversal

NI225 ; Nikkei through resistanceBreak through the resistance from 17th January.
Uptrend will continue.


Vix Pre-NY; Post-US500 (Futures) CL_1! 23:40:58 (UTC) Sun Oct 4Vix Pre-NY; Post-US500 ( Futures ) CL_1!
23:42:26 (UTC)
Sun Oct 4, 2020

ridethepig | Nikkei Market Commentary 2020.09.19📌 The Nikkei would have freed some space to the downside with a technical break last week, but given that we have not pierced the support line and buyers are still well-placed we must be wary of a retest in the highs of the multi year top at 24,000 - the same level we have been tracking since 2018!!
The more interesting notion comes from the Global Equity board with breaks being led by NY and following through with Europe on the quadruple witching flows.
A simple move here would be playing the breakdown for a quick test of the 200 day MA which is +/- 22,000 and on the other perhaps opening up the panic leg towards the lows at 20,300 if the rest of the flows play along. Any moves to the topside lack conviction and the RSI destroys all winning chances for buyers as we approach the highs.
Thanks as usual for keeping the feedback coming 👍 or 👎

TOYOTA MOTOR CORP: Important Breakout & Bullish Continuation
Confirmed breakout of a bullish flag pattern on Toyota.
Taking into consideration that the market is trading in a bullish trend
this breakout will most likely initiate a bullish rally.
I will buy on a retest of 618 retracement of the last minor bullish leg.
goals:
7286
7523

3 decades long resistance finally turning? Japan is the best in many things, but obviously not in stock prices...
BUT!
Nikkei 225 Index is now looking bullish, we're seeing a support resistance role reversal here.
A cup&handle pattern that took 24 years long to form is finally breaking out.
We've got measured target from the formation of 35,000, and from there we may see new all time highs on Nikkei.
Let's see which way the handle breaks to get confirmation.
***NOT FINANCIAL ADVICE***

JP225 : Swing, 100% Price ActionJP225 : Follow the uptrend. Look at my other analyzes, great profit :)
Feel free to like❤, comment📝, share👫 and follow me for other analyzes🌍
I predict with the best probability the future trends, my ideas are reserved for the experienced trader. #UniversTrader


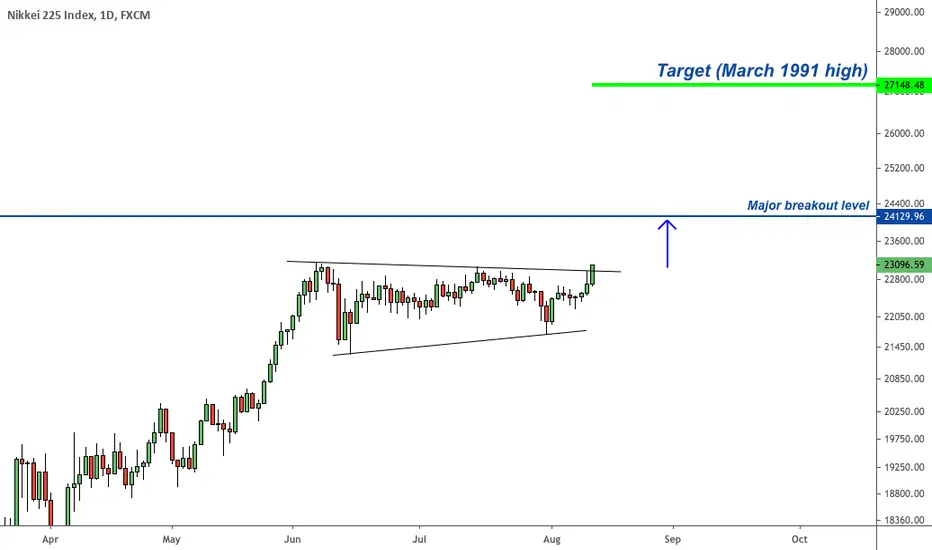
Japan's major index is breaking out. Follow the money flow...While the Nasdaq is turbulent the Japanese Nikkei is breaking out and headed toward a major level. Long into that zone, then we'll see if there's follow through. A break above the major blue level sends the Nikkei much higher.
Bigger picture:
JP225 on the break of the triangle 🦐JP225 on the daily chart has retraced till the 0.382 fib level before moving in a consolidation range.
The market has bounced twice on the daily support creating a double bottom where it took the liqidity to start a new impulse to the upside.
If the market will break the triangle and consequently will break the upper daily structure, at the retest of it, we can set a nice long order according with our strategy.
–––––
Follow the Shrimp 🦐
Here is the Plancton0618 technical analysis, please comment below if you have any question.
The ENTRY in the market will be taken only if the condition of Plancton0618 strategy will trigger.

$NI225 Position Update from Jul 7thAfter experiencing -1.65% of drawdown to the upside, our position gapped into profit by almost 4%, before retracing back towards my entry. I will remain short the NI225, with the entry, stoploss, and target(s) shown going into tomorrow's Asian equity market open. This includes my existing positions in Youzan & Tencent.

LONG JP225: A great move to the upsidelet's get into practical details without any bullshit in the beginning...
We have some really amazing targets starting with 22750, then 23000, and the last station of testing the all-time high at the level of 24000, but that's not our topic for now, let's take it easy... step by step.
We have a bearish trend since FEB2020 on the D1 chart, the price tried to break it many times without a result. but now, we're almost ready to test it one more time with two amazing structures on the H4 & H1.
Generally, we have H&S on the H4 chart and it was ready to test the neckline when it made a double-bottom formation on H1 chart, so now it's a great position to open a trade with some small targets in the beginning.
Firstly, we are gonna long JP225 with a sl below the bottom in order to test the neckline. 22450 will be a good support to put under consideration when we are attacking the neckline.
Secondly, in case of having a successful H&S, we will wait for the confirmation on the H1 to long it again to test the general down-trend. 22750 will be a good support to put under consideration when we are attacking the trendline.
Thirdly, in case of breaking the resistance, we will fly without mercy to test the all-time high at 24000
I'm following it with you daily to keep you up to date.
Chiao!


Possible 4:1 trade on #Nikkei to close out August $USDJPYI am seeing a potential big retracement move up in $USDJPY which is highly correlated to the Nikkei index. We have a head and shoulders pattern forming on the Month CAM R3 backtest. The measured move targets are shown.

NIKKEI On the road to the Quadruple Top Main items we can see on the chart:
a) The price was on an ascending trendline and at the beginning of 2020 we had a huge bearish movement
b) Since then the price has been rising and re-entered the ascending trendline
c) Currently, we can see a corrective structure (purple lines) and we expect a bullish Resolution IF the price breaks the upper line
d) The Target we will be aiming for is the quadruple top in the historical higher highs zone
e) Another detail to add to the chart is that we have a huge ABCDE Pattern. This type of structure is bullish from a technical perspective


Tencent & Youzan Trade Updates for Jul 29th Holding Tencent and Youzan after the publicly given buy signal linked below.

More Bullish potential on NIKKEI by ThinkingAntsOkMain items we can see on the chart:
a) The price has re-entered a broken ascending channel (yellow lines)
b) After that, we observed a corrective formation above it (purple lines)
c) We expect a bullish resolution of this correction based on Technical Analysis Theory
d) Target is the next Resistance zone
