NIKKEI Potential Bearish Gartley PatternAs described on the chart!
NOTE: "POTENTIAL" Gartley Pattern
Nikkei 225 JPN225 CFD

Head/Shoulders at $JPN225 $NIKKEI open tonightIn pre-market we are backtesting the neckline. Get ready for some follow through after today's rebound.

Hit volume support Price hit kumo cloud on 4 hrs and also volume (AD) support. We should see a bounce to the next swing high.

Elliott Wave & Intermarket Analysis For NIKKEI And USDJPYHello traders!
Today we will talk about stocks, specifically Nikkei and why USDJPY can see higher prices.
Well, as you may already know, in EW theory after a three-wave corrective decline, the trend should remain to the upside. This is what we see in the stock market all the time. However, Nikkei got our attention, because we can see a nice five-wave rally after that three-wave a-b-c correction, which means that Nikkei remains in uptrend, but after another three-wave correction in the lower degree, where ideal support would be here around 21450 - 21250 levels, just keep in mind that bullish confirmed can be only if it manages to turn back above 21770 region!
In the right picture you can see tight positive correlation between NIKKEI and USDJPY, which means that if NIKKEI points higher, then even USDJPY can see higher prices, so don't be surprised if USDJPY remains bullish towards 109 area or higher!
So, seems like risk-on sentiment may continue and when we are in risk-on, we usually see bullish stocks, which are followed by recovery on XXX/JPY crosses. That being said, be aware of a bullish continuation on stocks, while XXX/JPY cross pairs may see a bigger recovery!
Be humble, trade smart and wait for the right sentiment to enter the market!
Disclosure: Please be informed that information we provide is NOT a trading recommendation or investment advice. All of our work is for educational purposes only.

Nikkei Potential Head and Shoulders?The Nikkei is showing a potential head and shoulders pattern on the 2 hour chart. If we do break below the support at 21620,
then we would await for a lower high which would be a retest of the break.
However, ideally, would like to see a bounce and then a lower high which would make the head and shoulders pattern.
Price is turning at a resistance zone (21800) zone which adds further confluence.
This is a trade that can possibly play out next week. Keep it on your radar!

Short $NIKKEI For July - August Seasonal TradeNIKKEI is leading lower fast with a suspected $USDJPY tank. $SPY $IWM $QQQ $USDJPY
NIKKEI Seaonality starts today or tomorrow for the short: www.mrci.com


Nikkei 225 22052019Long term view of Nikkei 225. Time for a big correction ? Lets see
Share your thoughts and observation in comments session :)
-------------------------------------
Risk warning!
Trading carries a high level of risk to your capital and may result in losses that exceed your initial deposit.
Supplied information is not advice.
-------------------------------------

Nikkei Wave count and speculative buy zoneThat's all it is at this stage. I am not looking to buy the Nikkei index, but a number of interesting individual stocks mirror this wider theme. Sort of a lower swing high being set and "one more drop" to set a higher low then off we go sort of thing. Let's see.
Short to short-mid bearish, medium term to long term bullish.

Meisei Industrial expectations and buy zoneThis is just so I can track progress easily vs my expectations / buy zone. 0% fundamental and 100% technical analysis.

"Top and Bottom Analysis" NIKKEI 225 by ThinkingAntsOk4H CHART EXPLANATION:
Main Items we Observe on the Chart:
-Price has broken the ascending trendline
-Currently, price is on a support zone
-We will wait for a corrective structure on the support zone before taking any trade
Based on this if the price breaks down with a close candlestick below 20718.0 we expect a continuation of the downward movement towards 19964.0
MULTI TIMEFRAME VISION:
-Weekly :
-Daily:


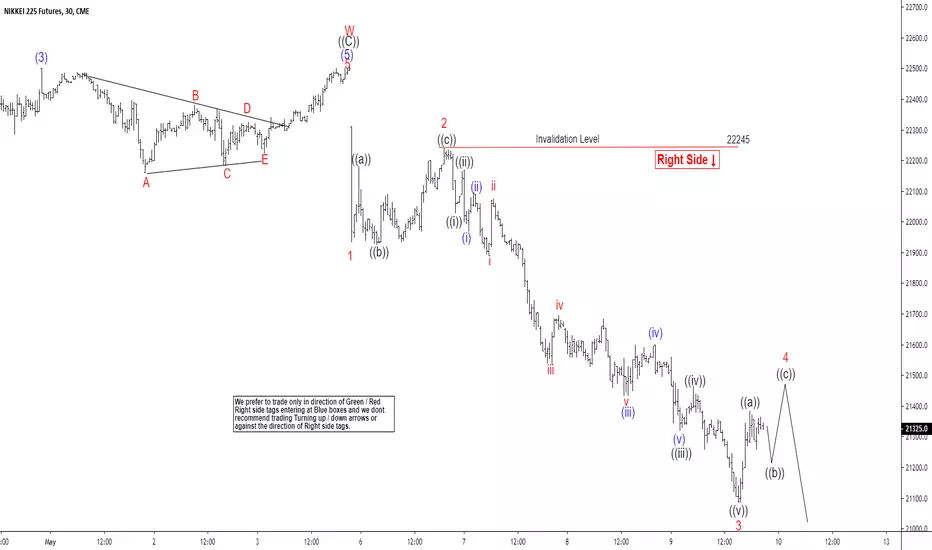
Elliott Wave View: Impulsive Decline in NikkeiOur Elliott Wave view on Nikkei suggests the rally to May 4, 2019 high (22505) ended wave w. This ended cycle from December 26, 2018 low and the Index is in the process of at least doing a larger 3 waves pullback. Short Term, decline in Nikkei from May 4, 2019 high is unfolding as an Elliott Wave impulse structure. Down from 22505, wave 1 ended at 21935 and wave 2 ended at 22245. Wave 3 ended at 21080 low.
Expect wave 4 bounce to fail in 3, 7, or 11 swing as far as wave 2 pivot at 22245 stays intact. Possible target for wave 4 is 23.6 – 38.2 retracement of wave 3 at 21539 – 21672. Alternatively, Index can end the entire 5 waves from May 4, 2019 high already. In this case, it should do a larger 3 waves bounce to correct the cycle from May 4 high before the decline resumes. We don’t like buying the Index and expect further downside in the Index to complete a 5 waves down.
SHORT NIKKEI approaching resistance, potential drop!Apr 30
NIKKEI is approaching our first resistance at 22346.7 (100% Fibonacci extension , 61.8% Fibonacci retracement ) where a strong drop to our major support at 21472.4 (horizontal overlap support, 61.8% Fibonacci retracement , 100% Fibonacci extension ).
Stochastic is also approaching resistance and seeing a bearish divergence where we might see a corresponding drop in price.
Trading CFDs on margin carries high risk.
Losses can exceed the initial investment so please ensure you fully understand the risks.

"Top and Bottom Analysis" NIKKEI (NI225) by ThinkingAnts4H CHART EXPLANATION:
Main items we see on the chart are:
- Price facing a Resistance zone on a possible Double Top Pattern
- Bearish Divergence on MACD
Based on this, if price breaks out the Ascending Trend line below 21300.0, we will be looking for short positions towards the Ascending Wedge Pattern at 20000.0, paying attention to the middle support zones at 20900.0 and 20400.0
MULTI TIMEFRAME VISION:
-Weekly
-Daily

Elliott Wave View: Nikkei Still Missing Wave 5Short Term Elliott Wave view on Nikkei Futures suggests the pullback to 20704 ended wave (2). The Index then resumed higher in wave (3) which ended at 21985. The internal of wave (3) subdivided as an impulse Elliott Wave structure. Up from 20704, wave 1 ended at 21415, wave 2 ended at 20985, wave 3 ended at 21765, wave 4 ended at 21490, and wave 5 of (3) ended at 21985. We can also see the internal of wave 1, 3, and 5 all subdivide as an impulse (5 waves) of lesser degree. This is an illustration of fractal within Elliott Wave where each wave consists of smaller waves and the pattern repeats indefinitely.
Wave (4) dips appears complete after a 3 waves pullback ended at 21588+ blue box area. The internal of wave (4) unfolded as a zigzag Elliott Wave structure where wave A ended at 21735, wave B ended at 21835, and wave C ended at 21565. At this stage, Nikkei still needs to break above wave (3) at 21985 to avoid a double correction in wave (4). While dips continue to stay above wave (2) low at 20704, expect Index to extend higher in wave (5). If bounce from the blue box fails to break above (3) high and it breaks the recent low, then structure of wave (4) should become a double three Elliott Wave structure and would be labelled as WXY. We would be able to define the next blue box area for a bounce if the bounce does fail and breaks the recent low.

Nikkei225 [Daily] Bulls: Failed today, in big trouble below 21kBulls failed when was trying to breakout of the consolidation. More longs covering may bring retest of 21200/20900 and two consecutive daily close below may even expose new LL below 19 000


Elliott Wave View: Nikkei Rally Likely Fails for DownsideElliott Wave view is calling an end to Nikkei’s rally from December 26, 2018 low with wave X at 21884. The Index should resume the move lower and should eventually break below wave December 26, 2018 low. Or at minimum, the Index should do a larger 3 waves pullback to correct the cycle from 19055 low. Down from wave X at 21884, the decline is unfolding as a zigzag Elliott Wave structure where wave ((a)) ended at 20680. Internal of wave ((a)) subdivides as a 5 waves impulse.
Wave ((b)) bounce is currently in progress as a Flat Elliott Wave structure. Up from 20680, wave (a) ended at 21520 and wave (b) ended at 20705. Internal of wave (a) unfolded as a double three Elliott Wave structure. Up from 21520 low, wave w ended at 21410, wave x ended at 21015, and wave y of (a) ended at 21520. Internal of wave (b) ended as a zigzag at 20705. Wave a of (b) ended at 21160, wave b of (b) ended at 21505, and wave c of (b) ended at 20705. Wave (c) of ((b)) is in progress as a 5 waves impulse. The rally should fail below March 4 high at 21884 for further downside. We don’t like buying the Index and expect rally to fail for further downside as far as pivot at 21884 high stays intact.


Not a Fan of that Resistance or PerformanceWhile there is much room to go before we hit resistance, I am really not a huge fan of this overall lackluster performance. Keep in mind, the BoJ owns upwards of 80 percent of the entire Japanese ETF market. 80 percent. Let that sink in. Also, export data is weak in an economy where exports make up 18 percent of GDP. If we gain five percent from today, nobody will be happier than me as my overall macro view will gladly change. I can sleep at night being wrong on five percent. But really though what could possibly lead to that given the last three months where some Asian markets like the Shanghai Composite would gain 5 percent in a single day while Japan is asleep? Just not convinced. More fundy and technical analysis on Asian markets as they move today here: anthonylaurence.wordpress.com
