Nikkei 225 JPN225 CFD


Nikkei 225 - Potential completion of a Bearish Gartley patternThe Nikkei225 showing a potential Gartley Pattern completion at around the 19900.
I would be more patient on this setup:
- The CD Leg move is has been very strong, hence it could take more time to stop and reverse at the PRZ
- I would like to see a reversal pattern at the PRZ
The H4 RSI is already at the overbought zone, hinting to us that the potential of a reversal


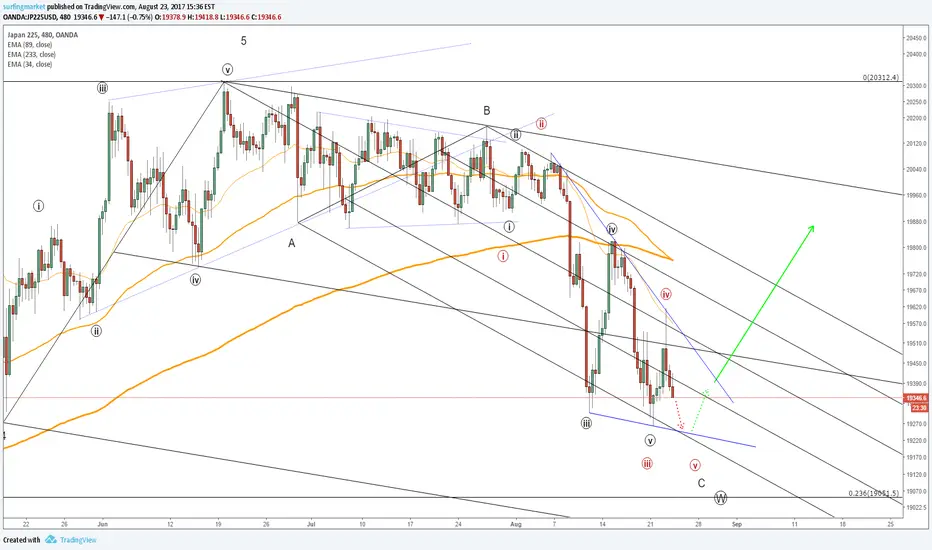
Nikkei weaker than expected. wash out possible.The scope of nikkei is the weakest among the global equity. It is expected as the nikkei is in a X wave rather than 5th wave like other major indexes.
However, the sharp decline today flash warning sign of another washout low. The pitchfork should hold.
If by any chance it breaks, the whole wave count should be expanded. That is very unlikely though.
Equity rally to be continue. Nikkei in wave XGlobal equity has bottomed. Although the Aug 25th Daja Vu is coming. I much prefer to buy dips this week.

Long Nikkei 225 @ 19,300; TP 19,683, SL your choiceLong Nikkei 225 @ 19,300; TP 19,683, SL your choice

JPN225 IN A POTENTIAL TOPPING LEVELJPN225 is in a good uptrend on daily. Harmonic pattern completed, let's see if it could be the starting point for a correction.


Monster Wave!'
Japan is seeing some strength within their markets. I believe confirmation came after Prime Minister Shnizo Abe' and President Trumps meeting in Mar-A-Lago. Coincidence?... maybe.. maybe not. I believe the talks of strengthening Japans dominance in Eastern Asia along with the United States withdrawal from the TPP supplemented this move quite nicely. I love analyzing Japan because they have far less moving parts to their economy than we do here in the US. Nonetheless I do see Japans GDP advancing another 2% for the next two years (1-1.5% annually). The NIKKEI forming some beautiful momentum. It's been on quite the run. My projection is that they will top out around 22081 in the next two years. Slugglish growth is still growth... The Japanese Yen is also slipping against the dollar nearly a 10% since the beginning of the year. Wage growth could see a slight move up but not by much... All is good in the foreseeable future the only thing I worry about is their staggering Debt/GDP ratio (250.4%!) given their size it should be that high, but We'll keep that analysis at bay, and cross that bride when we get there. O Wakare! ( Farewell :)

Nikkei 225 Bearish DivergenceIf price returns below 20000 level, we'll have a fake breakout. At the same time price diverges with MACD and RSI. We have bearish divergence near the major resistance level. It's short opportunity and we can sell below 19880 level with stop above the local swing high. Profit target should be at MA100 and 19000 level.

Dow Jones vs Nikkie U.S equities will outperform Japanese equities in the 3- 5 years to come.
In the chart I indicate "buy purple," however, this is a buy now in my opinion. No need to wait for a better price since the risk reward would still be very favourable. It's possible price does not see purple again. Purple is simply ideal.

JPN225 is one to watch, long term short. Small #No-StoplossFor discussion purposes only ;) what are the odds of having a long-term double top/M-pattern being formed? Current short term C wave shows already some weakening price action. The 15 min starts a corrective move, that will in itself create an hourly bearish move down. There is still a huge run to go on the weekly to have a confirmation of the M patter, but if confirmed then long term bear market is there in my view. #JPN225 #stoploser #no-stoploss #tiny #micro #position


Nikkei vs USDJPYThis chart tells us the Nikkei will outperform the USDJPY pair. I was thinking this week how amazingly resilient the Nikkei has been even with the Yen rising so much this year. But the correlation is mostly applicable on a very long term basis (monthly).
Correaltion shown in chart below. Since 2005 the correlation has been very positive.

USDJPY: Trend is up nowI think we can be more or less sure that the trend has now turned up on this pair. I'm holding longs, although I had closed earlier, I reentered when turning up for the day today, after we made a new daily low. That was a good cue for a potential short term bottom.
I like the VIX key levels on this pair, I have talked about this in the past. For more information, check Tim West's publications.
If you're long, hold and trail stops gradually.
Good luck!
Ivan Labrie.


JPN255 for Yen pairsDescription within chart markup.
Slight bullish movements with overall outlook of bearish.


