NIKKEI 225 Monthly Forecast Movements 1-30 November 2022 NIKKEI 225 Monthly Forecast Movements 1-30 November 2022
We can see that for this month, the implied volatility is around 4.56%, rising 3.68% of last month.
This is currently placing us in the 25th percentile according to ATR and 83th according to JNIV
Based on this percentile calculation, on average the monthly movement for the candle(from open of the candle to the close of the candle) is:
BEARISH Candle : 4.7%
BULLISH Candle : 3.1%
With this in mind we can expect with a close to 23.4% probability that our close of the monthly candle is going to close either above or below the next channel:
BOT: 26600
TOP: 28630
Lastly, based on the calculations that we had for touching the previous candle high and low values, we can estimate that there is a :
80% chance that we are going to touch the previous monthly high of 27600 (already happened yesterday)
25% chance that we are going to touch the previous monthly low of 25600
Nikkei 225 JPN225 CFD

JPN 225 - BULLISH jpn225 going to touch resistance lvl as i shown in chart m30 and h1 resistance above

Selling JP225 into swing highs.NIK225 - 22h expiry - We look to Sell at 27390 (stop at 27610)
Although the bulls are in control, the stalling positive momentum indicates a turnaround is possible.
We are trading at overbought extremes.
Previous resistance located at 27397.
A lower correction is expected.
The hourly chart technicals suggests further upside before the downtrend returns. We look to sell rallies.
Our profit targets will be 26810 and 26385
Resistance: 27370 / 28360 / 29240
Support: 26385 / 25500 / 24485
Risk Disclaimer
The trade ideas beyond this page are for informational purposes only and do not constitute investment advice or a solicitation to trade. This information is provided by Signal Centre, a third-party unaffiliated with OANDA, and is intended for general circulation only. OANDA does not guarantee the accuracy of this information and assumes no responsibilities for the information provided by the third party. The information does not take into account the specific investment objectives, financial situation, or particular needs of any particular person. You should take into account your specific investment objectives, financial situation, and particular needs before making a commitment to trade, including seeking advice from an independent financial adviser regarding the suitability of the investment, under a separate engagement, as you deem fit.
You accept that you assume all risks in independently viewing the contents and selecting a chosen strategy.
Where the research is distributed in Singapore to a person who is not an Accredited Investor, Expert Investor or an Institutional Investor, Oanda Asia Pacific Pte Ltd (“OAP“) accepts legal responsibility for the contents of the report to such persons only to the extent required by law. Singapore customers should contact OAP at 6579 8289 for matters arising from, or in connection with, the information/research distributed.

NIKKEIWednesday, 12 October 2022
16:12 PM (WIB)
Kindly difficult to understand the NIKKEI market direction. It is because there have 2 ways of direction between Bearish on the move with Bullish on the move too. The result of my analysis is that 6.18% is a very strong Bullish Belt Hold and the Golden Ratio of a Bearish Downtrend.
So, preparing Buy Order is A must in this market. Trading is not about how long I can hold. But, trading is all about how precise the analysis of the market is and getting the benefit of paying the time and money already spent.

NIKKEIMonday, 10 October 2022
22:50 PM (WIB)
NIKKEI just broke the S/R Lines with created Head N Shoulder formation and also developed the Tweezer Top pattern.
I'm expecting the price would move more low to the support area or even more low from that.

Japan 225 Short M15, M30, H1 and H4 are overbought
There has been a lot of consolidation and structure
No pattern and its against the trend
250 pip stop loss

MAJOR INDICES in USD / WORLD GDPFormula: (Major Indices/USDxxx)/World GDP (Gross Domestic Product)
Indices: USA, Germany, Japan, UK, China. (all converted to USD)
After the 2008-2009 bottom, USA performed much better than other countries. So, what's next? We can expect other countries to perform better even a bit from now on. But that dosen't mean that the stock markets will rise. It's a bit confusing, because there are high differences between them, as seen. If we focus on USA, we can say that the stock market is expensive. But others don't tell the same. We will see...

Europe&Japan to perform better than USA from now on, 2-JapanComparision of "NIKKEI in USD dollars" to "SPX".
I am publishing the same for all (please see my other analysis): Germany, UK, France, Italy, Japan...
I ignore all the fundamentals and just make technical analysis . Fall of EUR&GBP&JPY and their stock market's negative divergence compared to USA (SPX) is about to end, I believe.
Important: This doesn't mean that the equities&indices are going to rise from now on. My analysis only says: Europe&Japan will perform better than USA. Just because they are very cheap.

NIkkei 225 10 year ProfileBOJ intervened for the first time since 1998, to prop up it's the YEN, with some speculation they likely sold a lot of their massive reserves of long end (10-30 year) US T Bills to buy back the Yen. This hypothesis appears supported by the lack of short end yield movement at 4-5a, EST at time of BOJ intervention announcement late last week. Of note in this chart are:
- Almost a decade long volume profile aligned with vPOC at 382 retrace.
- Structure of current price action seemingly mirroring the covid structure as represented by the fractal in light blue above.

Joe Gun2Head Trade - NIKKEI at resistanceTrade Idea: Selling NIKKEI
Reasoning: Rallied into resistance
Entry Level: 28268
Take Profit Level: 27774
Stop Loss: 28368
Risk/Reward: 4.96:1
Disclaimer – Signal Centre. Please be reminded – you alone are responsible for your trading – both gains and losses. There is a very high degree of risk involved in trading. The technical analysis , like all indicators, strategies, columns, articles and other features accessible on/though this site is for informational purposes only and should not be construed as investment advice by you. Your use of the technical analysis , as would also your use of all mentioned indicators, strategies, columns, articles and all other features, is entirely at your own risk and it is your sole responsibility to evaluate the accuracy, completeness and usefulness (including suitability) of the information. You should assess the risk of any trade with your financial adviser and make your own independent decision(s) regarding any tradable products which may be the subject matter of the technical analysis or any of the said indicators, strategies, columns, articles and all other features.

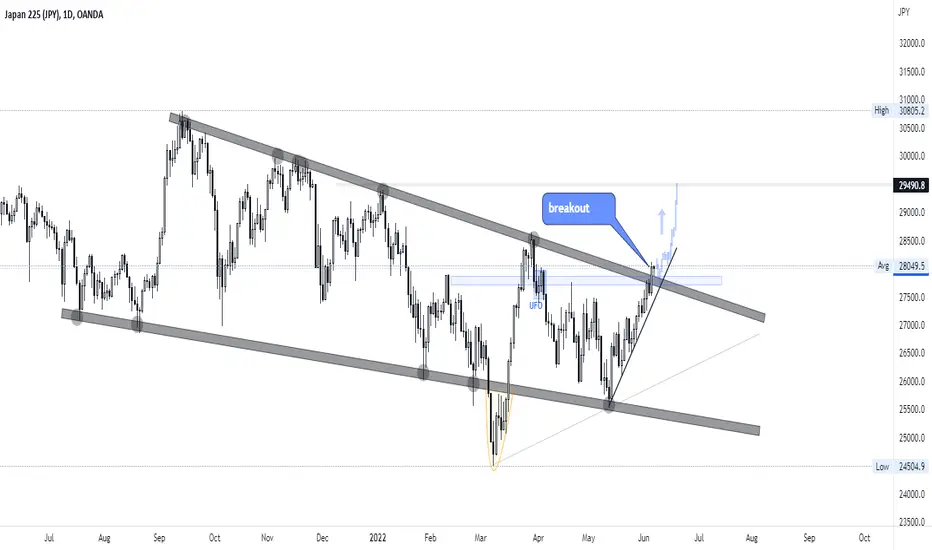
Nikkei 225 Breakout - where to next? Weaker than expected growth in Japan led to markets expecting policy by the BOJ to be kept loose. This recent breakout now puts the index in positive territory YTD and it is now at a 7-month high. The question remains whether this is a breakout to be faded or has legs to move higher? The RSI seems to be rolling over from overbought territory. This could potentially setup a retest of the 28.364k former resistance level. The 50-day SMA also looks to be eyeing a golden cross with the 200-day SMA. The pattern that has emerged a flat sided ascending triangle is typically bullish.

NIKKEI 225 CFD BEARISH PATTERNJapan Economy Watchers Current Index was announced yesterday, below its forecast and also below its neutral line of 50, at 43.8, which can be used as a marker for downturn of the country's economy.
On a technical level Japan 225 CFD broke the support of the rising wedge pattern, also signaling a potential bearish move on the instrument. Both MACD and RSI indicators confirm the pattern, and in both the fast moving average is increasing the gap with the slow moving average, indicated best by the MACD histogram. This might be read as an indicator for big movement.
If the pattern gets confirmed the price might test its previous low at 27840. If the opposite scenario occurs, the instrument might test the previous support of the rising wedge at 28270.
Risk Disclosure: Trading Foreign Exchange (Forex) and Contracts of Difference (CFD's) carries a high level of risk. By registering and signing up, any client affirms their understanding of their own personal accountability for all transactions performed within their account and recognizes the risks associated with trading on such markets and on such sites. Furthermore, one understands that the company carries zero influence over transactions, markets, and trading signals, therefore, cannot be held liable nor guarantee any profits or losses.

Nikkei 225 August 5th, 2022Nikkei has been rallying in the last few days, and broke a trend line. Everyone is wondering is it a reversal move or just a bull trap.
This is remain to see but for now I see pretty strong base to go higher. Saying that RSI is quite high, not oversold yet but compering to US indices JPN225 is less like to be severely oversold. Very likely the pullback is expected.
MACD looked like it was going to cross the signal line but not really, we might have one/two more bullish/consolidation days.
I'm going short but please do your own analysis - trading is risky

" JP225 " Buy Trade With 300 Pips Target Good Morning Trader's ,, How Are You Today ?
Let's Explain Together "JP225" Chart And Reasons To Long From This Area !
1- What Is The Trend For Jp225 ? Now ,, It's In Upper Trend ,, Because We Break Out The Last resistance Area And Going To Next Level
2- Why We Will Buy From This Area ? We Have Break Out SMC Area And Resistance Area ,, So We Will Going To Target
3- When We Close e Target As Stop Lose ? When The Price Close Daily Candle Down The SMC Area On Chart
Any Questions Please Write me On Comments !

Nikkei filling a gapI think the Japanese and Asian markets will anticipate what will happen this week.
After a false breakout of a diagonal resistance marked in blue, there is a high chance of filling the gap that was left open, reaching at least as far as the correction of 0.618.
Then we will have a better definition.


NIKKEI - Gartley completion on the Spike high.OANDA:JP225USD Has completed a Gartley Sell signal this morning on the open of the Asia Session.
The Daily AI had a top at that time as well.
First area to watch will be around 26300-26430 area below there would set up a 25500 Double bottom.
If it gets up above 27k then we will be looking at 27500-27800 bigger Gartley area.
Some levels to watch. Enjoy the day.

Nikkei - 4 Hour - Triangle Breakout We're seeing this setup across a few indices but here on the Nikkei we've recently had a completed ascending triangle pattern which has broken to the upside & is now starting to consolidate.
My initial prediction was that IF we break to the upside from this ascending triangle THEN we're likely to continue higher.
Now the question is IF we're likely to continue higher THEN where are we likely to go & how are we likely to get there.
The answer to the first question is our most recent major level of structure resistance & the answer to the second question is either by a pullback to previous structure resistance (now turned potential support) or by the formation of a high & tight flag pattern followed by another breakout.
Hope this idea was helpful. if you have any questions, comments or want to share your opinion fee free to leave them in the comment section below.
Also, if you're around I host a TRADE OF THE DAY Live Stream here on Tradingview each Tues, Wed & Thurs at 7:30 am NY, 12:30pm UK time. Feel free to join the discussion.
Akil

JPN225 GOING LONG ?
this is my veiws on the japan index
i expect it to reach 29000 by friday
hope you enjoy trade safe guys

Jamie Gun2Head - Selling NikkeiTrade Idea: Selling Nikkei
Reasoning: Targeting 78.6% Fibonacci, price breaking below support
Entry Level: 26708
Take Profit Level: 25893
Stop Loss: 26871
Risk Reward Ratio 5:1
Disclaimer – Signal Centre. Please be reminded – you alone are responsible for your trading – both gains and losses. There is a very high degree of risk involved in trading. The technical analysis , like all indicators, strategies, columns, articles and other features accessible on/though this site is for informational purposes only and should not be construed as investment advice by you. Your use of the technical analysis , as would also your use of all mentioned indicators, strategies, columns, articles and all other features, is entirely at your own risk and it is your sole responsibility to evaluate the accuracy, completeness and usefulness (including suitability) of the information. You should assess the risk of any trade with your financial adviser and make your own independent decision(s) regarding any tradable products which may be the subject matter of the technical analysis or any of the said indicators, strategies, columns, articles and all other features.

Nikkei 225 Potential Bullish ContinuationPreference:
On the H4, with price bouncing off the ichimoku cloud and moving in an ascending trend channel, we have a bullish bias that price will continue to rise from the pivot at 26880 in line with the pullback support and 50% fibonacci retracement to the 1st resistance at 28410 in line with the multiple swing high and 100% fibonacci projection .
Alternative Scenario:
Alternatively, price may reverse off the pivot and drop to the 1st support at 26000 in line with the pullback support .
Any opinions, news, research, analyses, prices, other information, or links to third-party sites contained on this website are provided on an "as-is" basis, as general market commentary, and do not constitute investment advice. The market commentary has not been prepared in accordance with legal requirements designed to promote the independence of investment research, and it is therefore not subject to any prohibition on dealing ahead of dissemination. Although this commentary is not produced by an independent source, FXCM takes all sufficient steps to eliminate or prevent any conflicts of interest arising out of the production and dissemination of this communication. The employees of FXCM commit to acting in the clients' best interests and represent their views without misleading, deceiving, or otherwise impairing the clients' ability to make informed investment decisions. For more information about the FXCM's internal organizational and administrative arrangements for the prevention of conflicts, please refer to the Firms' Managing Conflicts Policy. Please ensure that you read and understand our Full Disclaimer and Liability provision concerning the foregoing Information, which can be accessed on the website.

Why markets will fall this week (JPN225 analysis) Last week we saw a rally in all the stocks.
Looking at the indexes, we are seeing all of them being overbought on H4, h1, m30 and m15.
We are seeing the weakness in H1 and M30 and M15 on Nikkei.
We will sell with 500 pip stop loss and target close to 2000.

NIKKEI 7th JUNE 2022Asia Pacific stock markets were mostly bullish on Monday (June 6th) morning as China eased COVID-19 restrictions, giving hope for the global economic recovery. Also, the upbeat US jobs report opens the door for the US Federal Reserve to remain decisive on inflation.
Nikkei has breakout the resistance area. After several months inside the falling wedge area. So technically the price will be higher in the future.