USDJPY - Now or Never!Hello TradingView Family / Fellow Traders. This is Richard, also known as theSignalyst.
📈USDJPY has been overall bullish trading within the rising channel marked in blue and it is currently retesting the upper bound of the channel acting as an over-bought zone.
Moreover, the green zone is a strong weekly resistance.
📚 As per my trading style:
As #USDJPY is around the red circle zone, I will be looking for bearish reversal setups (like a double top pattern, trendline break , and so on...)
📚 Always follow your trading plan regarding entry, risk management, and trade management.
Good luck!
All Strategies Are Good; If Managed Properly!
~Rich
Disclosure: I am part of Trade Nation's Influencer program and receive a monthly fee for using their TradingView charts in my analysis.
Jpy

USDJPY Potential UpsidesHey Traders, in tomorrow's trading session we are monitoring USDJPY for a buying opportunity around 147.000 zone, USDJPY is trading in an uptrend and currently is in a correction phase in which it is approaching the trend at 147.000 support and resistance area.
Trade safe, Joe.

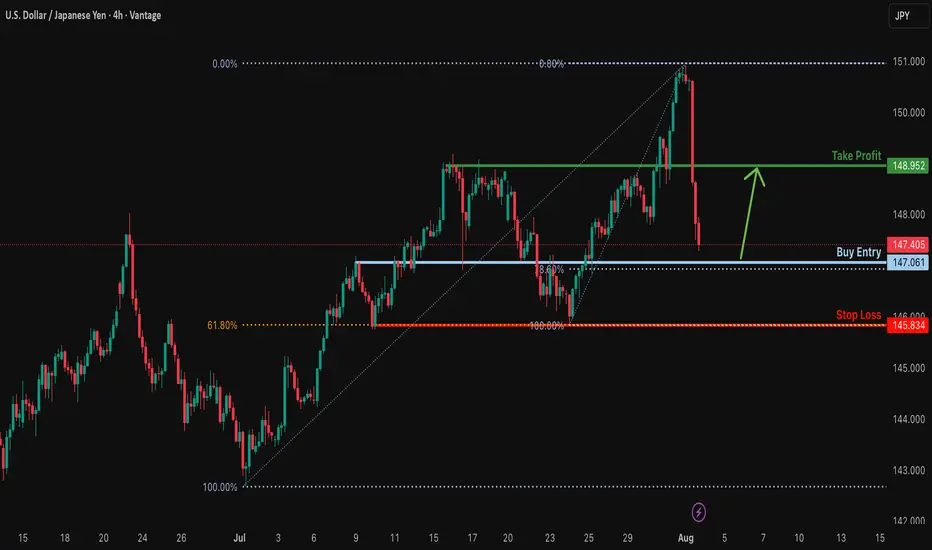
Falling towards 78.6% Fibonacci support?USD/JPY is falling towards the support level, which is an overlap support that aligns with the 78.6% Fibonacci retracement and could bounce from this level to our take profit.
Entry: 147.06
Why we like it:
There is an overlap support that aligns with the 78.6% Fibonacci retracement.
Stop loss: 145.83
Why we like it:
There is a multi-swing low support that aligns with the 61.8% Fibonacci retracement.
Take profit: 148.95
Why we like it:
There is a pullback resistance.
Enjoying your TradingView experience? Review us!
Please be advised that the information presented on TradingView is provided to Vantage (‘Vantage Global Limited’, ‘we’) by a third-party provider (‘Everest Fortune Group’). Please be reminded that you are solely responsible for the trading decisions on your account. There is a very high degree of risk involved in trading. Any information and/or content is intended entirely for research, educational and informational purposes only and does not constitute investment or consultation advice or investment strategy. The information is not tailored to the investment needs of any specific person and therefore does not involve a consideration of any of the investment objectives, financial situation or needs of any viewer that may receive it. Kindly also note that past performance is not a reliable indicator of future results. Actual results may differ materially from those anticipated in forward-looking or past performance statements. We assume no liability as to the accuracy or completeness of any of the information and/or content provided herein and the Company cannot be held responsible for any omission, mistake nor for any loss or damage including without limitation to any loss of profit which may arise from reliance on any information supplied by Everest Fortune Group.
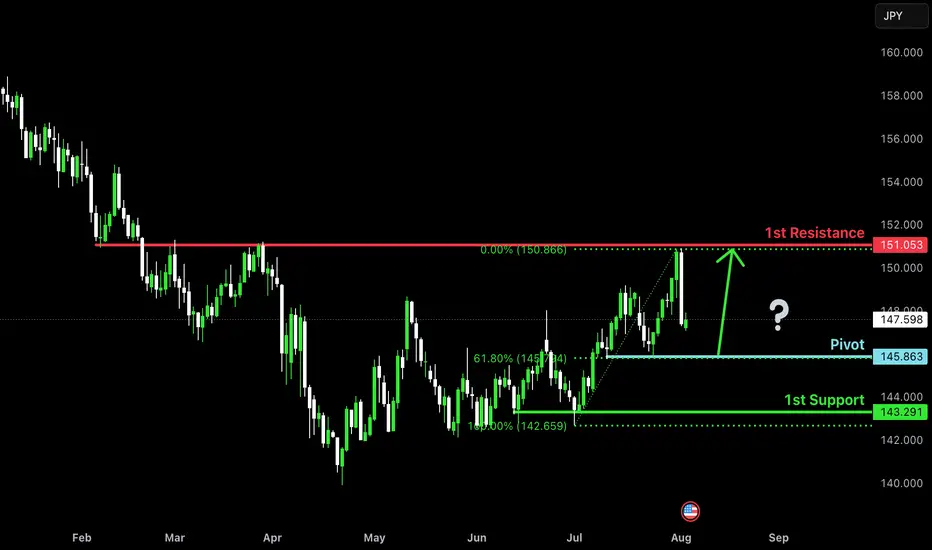
Bullish bounce off pullback support?USD/JPY is falling towards the pivot, which is a pullback support and could bounce to the 1st resistance.
Pivot: 145.86
1st Support: 143.29
1st Resistance: 151.05
Risk Warning:
Trading Forex and CFDs carries a high level of risk to your capital and you should only trade with money you can afford to lose. Trading Forex and CFDs may not be suitable for all investors, so please ensure that you fully understand the risks involved and seek independent advice if necessary.
Disclaimer:
The above opinions given constitute general market commentary, and do not constitute the opinion or advice of IC Markets or any form of personal or investment advice.
Any opinions, news, research, analyses, prices, other information, or links to third-party sites contained on this website are provided on an "as-is" basis, are intended only to be informative, is not an advice nor a recommendation, nor research, or a record of our trading prices, or an offer of, or solicitation for a transaction in any financial instrument and thus should not be treated as such. The information provided does not involve any specific investment objectives, financial situation and needs of any specific person who may receive it. Please be aware, that past performance is not a reliable indicator of future performance and/or results. Past Performance or Forward-looking scenarios based upon the reasonable beliefs of the third-party provider are not a guarantee of future performance. Actual results may differ materially from those anticipated in forward-looking or past performance statements. IC Markets makes no representation or warranty and assumes no liability as to the accuracy or completeness of the information provided, nor any loss arising from any investment based on a recommendation, forecast or any information supplied by any third-party.
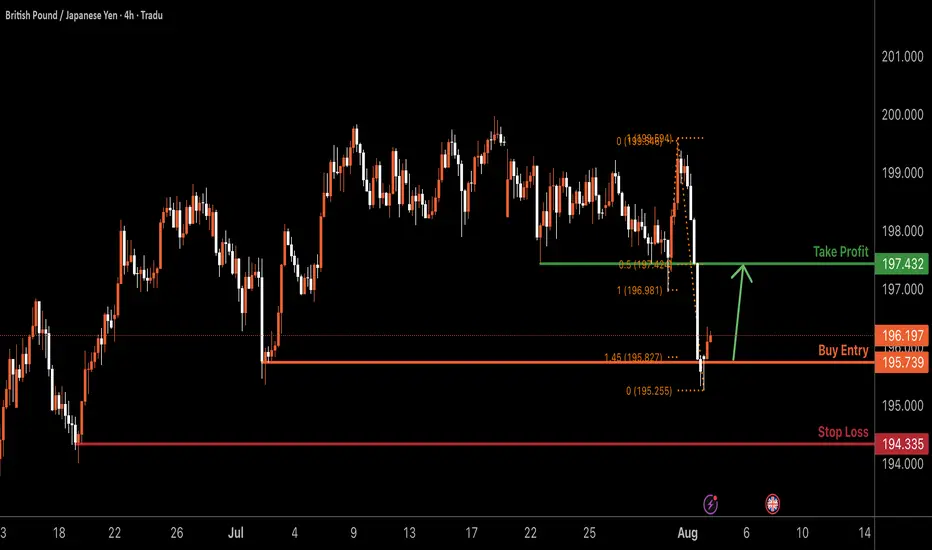
GBPJPY H4 | Bullish bounce offGBP/JPY has bounced off the buy entry, which has been identified as a swing low support and could potentially rise from this level to the take profit.
Buy entry is at 195.73, which is a swing low support that lines up with the 145% Fibonacci extension.
Stop loss is at 194.33, which is a swing low support.
Take profit is at 197.43, which is a pullback resistance that aligns with the 50% Fibonacci retracement.
High Risk Investment Warning
Trading Forex/CFDs on margin carries a high level of risk and may not be suitable for all investors. Leverage can work against you.
Stratos Markets Limited (tradu.com ):
CFDs are complex instruments and come with a high risk of losing money rapidly due to leverage. 65% of retail investor accounts lose money when trading CFDs with this provider. You should consider whether you understand how CFDs work and whether you can afford to take the high risk of losing your money.
Stratos Europe Ltd (tradu.com ):
CFDs are complex instruments and come with a high risk of losing money rapidly due to leverage. 66% of retail investor accounts lose money when trading CFDs with this provider. You should consider whether you understand how CFDs work and whether you can afford to take the high risk of losing your money.
Stratos Global LLC (tradu.com ):
Losses can exceed deposits.
Please be advised that the information presented on TradingView is provided to Tradu (‘Company’, ‘we’) by a third-party provider (‘TFA Global Pte Ltd’). Please be reminded that you are solely responsible for the trading decisions on your account. There is a very high degree of risk involved in trading. Any information and/or content is intended entirely for research, educational and informational purposes only and does not constitute investment or consultation advice or investment strategy. The information is not tailored to the investment needs of any specific person and therefore does not involve a consideration of any of the investment objectives, financial situation or needs of any viewer that may receive it. Kindly also note that past performance is not a reliable indicator of future results. Actual results may differ materially from those anticipated in forward-looking or past performance statements. We assume no liability as to the accuracy or completeness of any of the information and/or content provided herein and the Company cannot be held responsible for any omission, mistake nor for any loss or damage including without limitation to any loss of profit which may arise from reliance on any information supplied by TFA Global Pte Ltd.
The speaker(s) is neither an employee, agent nor representative of Tradu and is therefore acting independently. The opinions given are their own, constitute general market commentary, and do not constitute the opinion or advice of Tradu or any form of personal or investment advice. Tradu neither endorses nor guarantees offerings of third-party speakers, nor is Tradu responsible for the content, veracity or opinions of third-party speakers, presenters or participants.
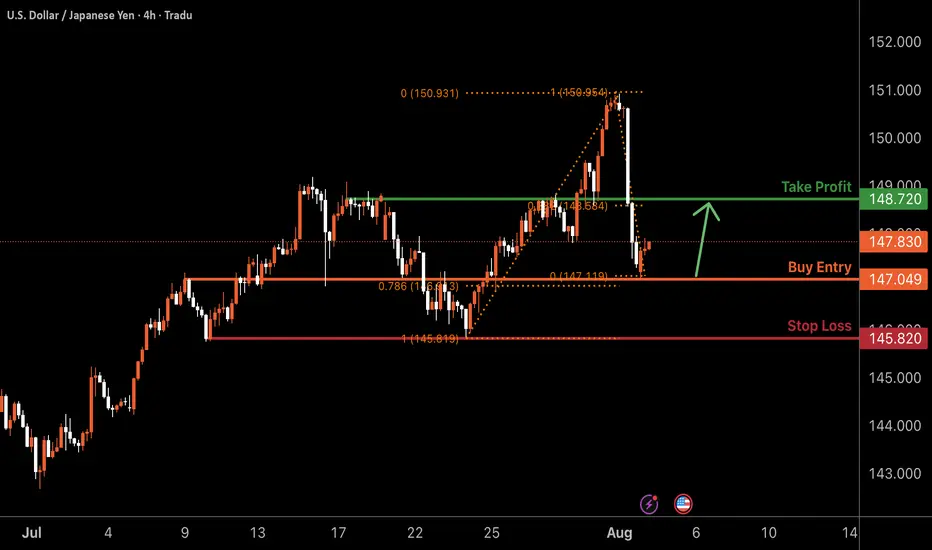
USDJPY H4 | Bullish bounce offBased on the H4 chart analysis, we can see that the price has bounced off the buy entry, which is an overlap support, and could potentially rise further.
Buy entry is at 147.04, which is an overlap support that aligns with the 78.6% Fibonacci retracement.
Stop loss is at 145.82, which is a multi-swing low support.
Take profit is at 148.72, which is a pullback resistance that lines up with the 38.2% Fibonacci retracement.
High Risk Investment Warning
Trading Forex/CFDs on margin carries a high level of risk and may not be suitable for all investors. Leverage can work against you.
Stratos Markets Limited (tradu.com ):
CFDs are complex instruments and come with a high risk of losing money rapidly due to leverage. 65% of retail investor accounts lose money when trading CFDs with this provider. You should consider whether you understand how CFDs work and whether you can afford to take the high risk of losing your money.
Stratos Europe Ltd (tradu.com ):
CFDs are complex instruments and come with a high risk of losing money rapidly due to leverage. 66% of retail investor accounts lose money when trading CFDs with this provider. You should consider whether you understand how CFDs work and whether you can afford to take the high risk of losing your money.
Stratos Global LLC (tradu.com ):
Losses can exceed deposits.
Please be advised that the information presented on TradingView is provided to Tradu (‘Company’, ‘we’) by a third-party provider (‘TFA Global Pte Ltd’). Please be reminded that you are solely responsible for the trading decisions on your account. There is a very high degree of risk involved in trading. Any information and/or content is intended entirely for research, educational and informational purposes only and does not constitute investment or consultation advice or investment strategy. The information is not tailored to the investment needs of any specific person and therefore does not involve a consideration of any of the investment objectives, financial situation or needs of any viewer that may receive it. Kindly also note that past performance is not a reliable indicator of future results. Actual results may differ materially from those anticipated in forward-looking or past performance statements. We assume no liability as to the accuracy or completeness of any of the information and/or content provided herein and the Company cannot be held responsible for any omission, mistake nor for any loss or damage including without limitation to any loss of profit which may arise from reliance on any information supplied by TFA Global Pte Ltd.
The speaker(s) is neither an employee, agent nor representative of Tradu and is therefore acting independently. The opinions given are their own, constitute general market commentary, and do not constitute the opinion or advice of Tradu or any form of personal or investment advice. Tradu neither endorses nor guarantees offerings of third-party speakers, nor is Tradu responsible for the content, veracity or opinions of third-party speakers, presenters or participants.
EURJPY 4hour TF - August 3rd,2025🟦 EURJPY 4H Analysis Bearish Idea
📅 August 3, 2025
🔹 Top-Down Trend Bias:
• Monthly – Bullish
• Weekly – Bullish
• Daily – Bullish
• 4H – Bearish
EURJPY has pulled back through the previous support zone around 171.000 and is currently consolidating after a sharp bearish move. Short term trend remains bearish, but higher timeframes suggest this may be a corrective phase.
🔍 Key Zone: 171.00 – 171.70
This zone represents the 38.2% fib retracement and prior structure. A rejection from this area could trigger further downside, while a break above may confirm a higher low.
✅ Scenario A: Bearish Continuation (Blue Path)
1.If price taps into 171.00–171.70 and rejects
2.Look for bearish confirmation (rejection wick, bearish engulfing, BOS)
Target: 169.60 (key support)
This setup follows short term momentum and offers clean R:R into prior liquidity.
⚠️ Scenario B: Bullish Break & Hold (Orange Path)
1.If price breaks and closes above 172.250
2.Watch for continuation toward 173.750, our extended fib target
3.Structure shift + bullish PA would align with HTF bullish trend
This would confirm strength returning to the pair, ideal for HTF trend continuation traders.
🧠 Final Notes
• 171.00–171.70 is the reaction zone to watch
• HTFs remain bullish, but 4H momentum must flip to validate upside
• Let price confirm direction

USD/JPY(20250804)Today's AnalysisMarket News:
① The US non-farm payrolls rose by 73,000 jobs in July, far below the expected 110,000; the previous two months saw a significant downward revision of 258,000 jobs, prompting traders to fully price in two Fed rate cuts before the end of the year.
② The US ISM Manufacturing PMI for July unexpectedly fell to 48, below the expected 49.5 and the lowest level since October 2024.
③ The University of Michigan Consumer Confidence Index for July reached a five-month high.
Technical Analysis:
Today's Buy/Sell Levels:
148.53
Support and Resistance Levels:
152.12
150.78
149.91
147.15
146.28
144.94
Trading Strategy:
If it breaks above 148.53, consider entering a buy position, with the first target price being 149.91. If it breaks below 147.15, consider entering a sell position, with the first target price being 146.28.

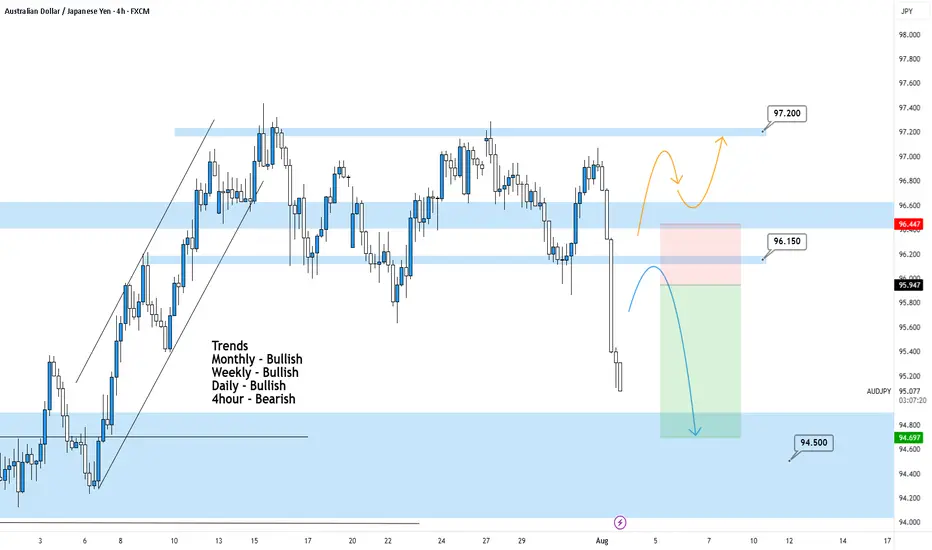
AUDJPY 4Hour TF - August 3rd,2025🟦 AUDJPY 4H Analysis Bearish Idea
📅 August 3rd, 2025
🔹 Top-Down Trend Bias:
• Monthly – Bullish
• Weekly – Bullish
• Daily – Bullish
• 4H – Bearish
AUDJPY has broken cleanly below prior structure around 96.15, signaling short term bearish momentum within a higher timeframe bullish environment. Price is currently approaching key decision zones.
🔍 Key Zone: 96.15 – 96.45
This former support zone may now act as a bearish retest area and new resistance. This offers a potential entry for continuation plays if structure holds below.
✅ Scenario A: Bearish Continuation (Blue Path)
1.If price retests and rejects from 96.15–96.45
2.Look for bearish confirmation (rejection wicks, engulfing, LTF structure shift)
Target: 94.50
This setup is trend aligned with current 4H momentum and offers a clean structure based downside.
⚠️ Scenario B: Bullish Reclaim (Orange Path)
1.If price breaks and holds above 96.45
2.Could signal a shift back toward higher timeframe bullish continuation
Target: 97.20 resistance zone
This is a counter-trend idea on the 4H and requires confirmation
🧠 Final Notes
• Short-term bearish bias while price remains below 96.45
• Let the retest confirm the direction
• Clean structure = clean setups
USDJPY 4Hour TF - August 3rd, 2025🟦 USDJPY 4H Analysis Bullish Idea
📅 August 3, 2025
🔹 Top-Down Trend Bias:
• Monthly – Bullish
• Weekly – Bearish
• Daily – Bullish
• 4H – Bearish
USDJPY has retraced sharply from local highs, breaking down into prior support near 147.50. Short term structure has shifted bearish, but higher timeframes still lean bullish making this a key reaction zone to monitor.
🔍 Key Zone: 147.00 – 147.50
This zone sits at a prior key support zone. How price reacts here will determine whether the pair resumes its bullish leg or continues deeper.
✅ Scenario A: Bullish Rejection (Blue Path)
1.If price holds above 147.00–147.50 and prints bullish confirmation
2.Look for continuation toward 151.50
Target: 151.50 (next clean resistance zone)
This setup aligns with the HTF bullish trend. Clean break of structure and bullish reactions are needed for confirmation.
⚠️ Scenario B: Bearish Breakdown (Orange Path)
1.If price breaks and closes below 147.500 zone
2.Watch for lower high + retest rejection
Target: 145.00 support zone
This is a lower probability counter trend continuation but is possible if price action presents the needed confirmations.
🧠 Final Notes
• Price is at a decision point, wait for Price action confirmation
• HTF bias leans bullish, but 4H structure must shift back up
• Trade with structure, not against it

NZDJPY Long Setup: Institutional Flow Signals Upside to 89.690🗓 Seasonal Outlook
- JPY Seasonal Weakness: Historical trends show July and August tend to be bearish months for the Japanese Yen, reinforcing weakness across JPY pairs.
- NZD Seasonal Strength: July typically supports bullish momentum for NZD, while August may present challenges. However, strength in NZD versus relative JPY softness suggests continued upside potential into early August.
💼 Institutional Positioning (COT Analysis)
- JPY: Commercial traders remain net short, suggesting expectations of further depreciation.
- NZD: Also shows commercial net shorts, yet the price structure aligns more with bullish continuation, hinting at speculative flow favoring NZD upside.
🧠 Technical Analysis
- Liquidity Dynamics:
- Price has cleared multiple buy-side liquidity levels near prior swing highs.
- Sell-side zones continue to hold, indicating strong bullish intent and failed bearish follow-through.
- Market Structure:
- Higher lows and sustained bullish reactions post-liquidity sweeps reinforce an upward trajectory.
- Current structure suggests accumulation and breakout patterns toward the proposed target.
🎯 Target Projection: 89.690

JPY SHORT TERM BULLIn my past video on YouTube, ive mentioned that JPY will be short-term bullish. Price took SSL and the run for the buy side. im hoping for the price to retrace to its weekly 50% Av, making its cross pair go lower like AUDJPY & EURJPY.

GBP/JPY H4 | Bullish bounce offGBP/JPY is falling towards the buy entry, which is an overlap support that lines up with the 61.8% Fibonacci retracement and could bounce to the take profit.
Buy entry is at 197.99, which is an overlap support that aligns with the 61.8% Fibonacci retracement.
Stop loss is at 196.90, which is a swing low support.
Take profit is at 199.73, which is a multi-swing high resistance.
High Risk Investment Warning
Trading Forex/CFDs on margin carries a high level of risk and may not be suitable for all investors. Leverage can work against you.
Stratos Markets Limited (tradu.com ):
CFDs are complex instruments and come with a high risk of losing money rapidly due to leverage. 65% of retail investor accounts lose money when trading CFDs with this provider. You should consider whether you understand how CFDs work and whether you can afford to take the high risk of losing your money.
Stratos Europe Ltd (tradu.com ):
CFDs are complex instruments and come with a high risk of losing money rapidly due to leverage. 66% of retail investor accounts lose money when trading CFDs with this provider. You should consider whether you understand how CFDs work and whether you can afford to take the high risk of losing your money.
Stratos Global LLC (tradu.com ):
Losses can exceed deposits.
Please be advised that the information presented on TradingView is provided to Tradu (‘Company’, ‘we’) by a third-party provider (‘TFA Global Pte Ltd’). Please be reminded that you are solely responsible for the trading decisions on your account. There is a very high degree of risk involved in trading. Any information and/or content is intended entirely for research, educational and informational purposes only and does not constitute investment or consultation advice or investment strategy. The information is not tailored to the investment needs of any specific person and therefore does not involve a consideration of any of the investment objectives, financial situation or needs of any viewer that may receive it. Kindly also note that past performance is not a reliable indicator of future results. Actual results may differ materially from those anticipated in forward-looking or past performance statements. We assume no liability as to the accuracy or completeness of any of the information and/or content provided herein and the Company cannot be held responsible for any omission, mistake nor for any loss or damage including without limitation to any loss of profit which may arise from reliance on any information supplied by TFA Global Pte Ltd.
The speaker(s) is neither an employee, agent nor representative of Tradu and is therefore acting independently. The opinions given are their own, constitute general market commentary, and do not constitute the opinion or advice of Tradu or any form of personal or investment advice. Tradu neither endorses nor guarantees offerings of third-party speakers, nor is Tradu responsible for the content, veracity or opinions of third-party speakers, presenters or participants.

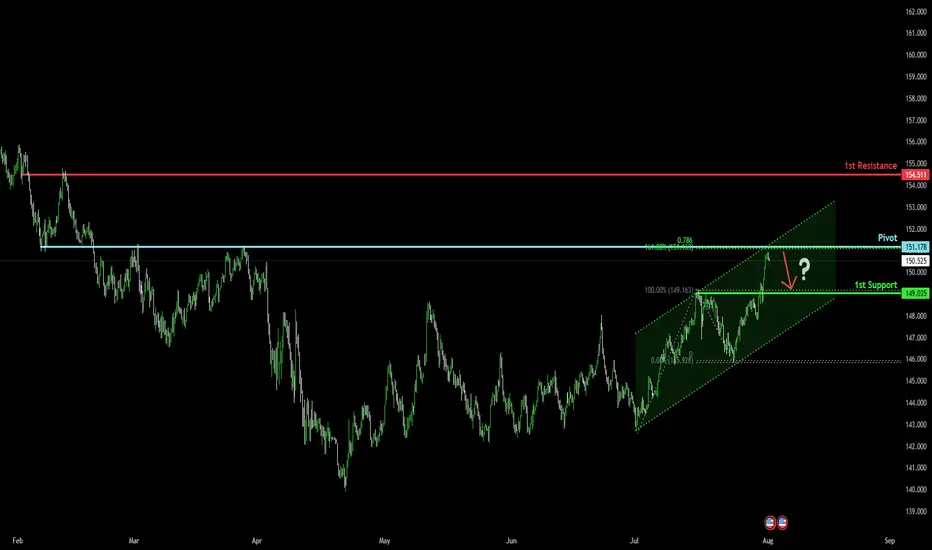
Bearish reversal off overlap resistance?USD/JPY is rising towards the pivot, which has been identified as an overlap resistance and could drop to the 1st support.
Pivot: 151.17
1st Support: 149.03
1st Resistance: 154.51
Risk Warning:
Trading Forex and CFDs carries a high level of risk to your capital and you should only trade with money you can afford to lose. Trading Forex and CFDs may not be suitable for all investors, so please ensure that you fully understand the risks involved and seek independent advice if necessary.
Disclaimer:
The above opinions given constitute general market commentary, and do not constitute the opinion or advice of IC Markets or any form of personal or investment advice.
Any opinions, news, research, analyses, prices, other information, or links to third-party sites contained on this website are provided on an "as-is" basis, are intended only to be informative, is not an advice nor a recommendation, nor research, or a record of our trading prices, or an offer of, or solicitation for a transaction in any financial instrument and thus should not be treated as such. The information provided does not involve any specific investment objectives, financial situation and needs of any specific person who may receive it. Please be aware, that past performance is not a reliable indicator of future performance and/or results. Past Performance or Forward-looking scenarios based upon the reasonable beliefs of the third-party provider are not a guarantee of future performance. Actual results may differ materially from those anticipated in forward-looking or past performance statements. IC Markets makes no representation or warranty and assumes no liability as to the accuracy or completeness of the information provided, nor any loss arising from any investment based on a recommendation, forecast or any information supplied by any third-party.
AUD/JPY bulls eye 99, 100The yen is broadly weaker, which is even allowing a weaker Australian dollar to rise. And with a decent bullish trend on the daily chart, I am now seeking dips within a recent consolidation range in anticipation of a move to 99 or even 100.
Matt Simpson, Market Analyst at City Index and Forex.com

NZDJPY to find sellers at market price?NZDJPY - 24h expiry
Trading has been mixed and volatile.
Price action looks to be forming a top.
We look for a temporary move higher.
Preferred trade is to sell into rallies.
Bespoke resistance is located at 88.90.
We look to Sell at 88.90 (stop at 89.10)
Our profit targets will be 88.10 and 87.90
Resistance: 89.00 / 89.20 / 89.50
Support: 88.40 / 88.10 / 87.90
Risk Disclaimer
The trade ideas beyond this page are for informational purposes only and do not constitute investment advice or a solicitation to trade. This information is provided by Signal Centre, a third-party unaffiliated with OANDA, and is intended for general circulation only. OANDA does not guarantee the accuracy of this information and assumes no responsibilities for the information provided by the third party. The information does not take into account the specific investment objectives, financial situation, or particular needs of any particular person. You should take into account your specific investment objectives, financial situation, and particular needs before making a commitment to trade, including seeking, under a separate engagement, as you deem fit.
You accept that you assume all risks in independently viewing the contents and selecting a chosen strategy.
Where the research is distributed in Singapore to a person who is not an Accredited Investor, Expert Investor or an Institutional Investor, Oanda Asia Pacific Pte Ltd (“OAP“) accepts legal responsibility for the contents of the report to such persons only to the extent required by law. Singapore customers should contact OAP at 6579 8289 for matters arising from, or in connection with, the information/research distributed.

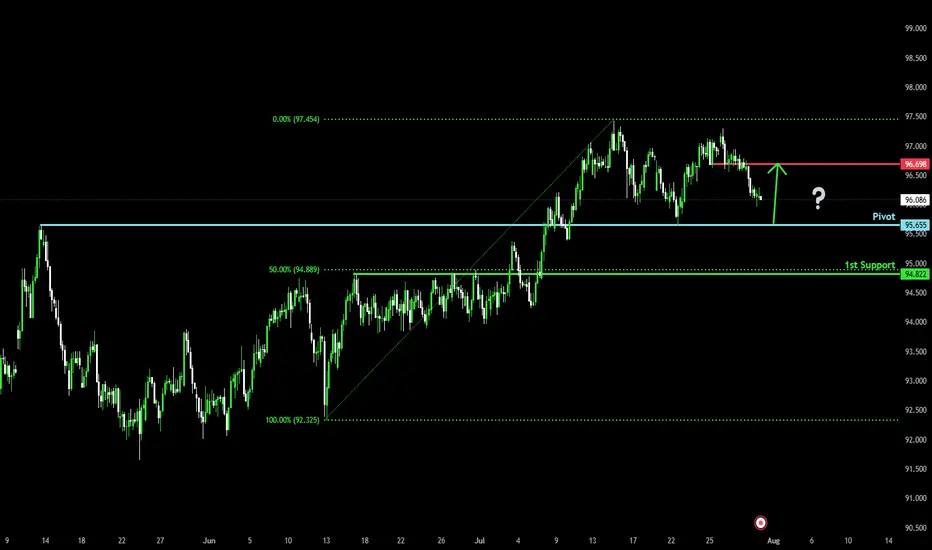
Falling towards overlap support?AUD/JPY is falling towards the pivot, which has been identified as an overlap support and could bounce to the 1st resistance.
Pivot: 95.65
1st Support: 94.82
1st Resistance: 96.69
Risk Warning:
Trading Forex and CFDs carries a high level of risk to your capital and you should only trade with money you can afford to lose. Trading Forex and CFDs may not be suitable for all investors, so please ensure that you fully understand the risks involved and seek independent advice if necessary.
Disclaimer:
The above opinions given constitute general market commentary, and do not constitute the opinion or advice of IC Markets or any form of personal or investment advice.
Any opinions, news, research, analyses, prices, other information, or links to third-party sites contained on this website are provided on an "as-is" basis, are intended only to be informative, is not an advice nor a recommendation, nor research, or a record of our trading prices, or an offer of, or solicitation for a transaction in any financial instrument and thus should not be treated as such. The information provided does not involve any specific investment objectives, financial situation and needs of any specific person who may receive it. Please be aware, that past performance is not a reliable indicator of future performance and/or results. Past Performance or Forward-looking scenarios based upon the reasonable beliefs of the third-party provider are not a guarantee of future performance. Actual results may differ materially from those anticipated in forward-looking or past performance statements. IC Markets makes no representation or warranty and assumes no liability as to the accuracy or completeness of the information provided, nor any loss arising from any investment based on a recommendation, forecast or any information supplied by any third-party.
Potential bearish drop?GBP/JPY is reacting off the resitance level which is anoverlap resistance and could drop from this level to our takeprofit.
Entry: 198.05
Why we like it:
There is anoverlap support.
Stop loss: 199.79
Why we like it:
There is a multi swing high resistance.
Take profit: 195.78
Why we like it:
There is a swing low support.
Enjoying your TradingView experience? Review us!
Please be advised that the information presented on TradingView is provided to Vantage (‘Vantage Global Limited’, ‘we’) by a third-party provider (‘Everest Fortune Group’). Please be reminded that you are solely responsible for the trading decisions on your account. There is a very high degree of risk involved in trading. Any information and/or content is intended entirely for research, educational and informational purposes only and does not constitute investment or consultation advice or investment strategy. The information is not tailored to the investment needs of any specific person and therefore does not involve a consideration of any of the investment objectives, financial situation or needs of any viewer that may receive it. Kindly also note that past performance is not a reliable indicator of future results. Actual results may differ materially from those anticipated in forward-looking or past performance statements. We assume no liability as to the accuracy or completeness of any of the information and/or content provided herein and the Company cannot be held responsible for any omission, mistake nor for any loss or damage including without limitation to any loss of profit which may arise from reliance on any information supplied by Everest Fortune Group.

USDJPY Setup: Prime Buy Zone with a Clear Target!Good morning my friends,
I've prepared a fresh USDJPY analysis just for you.
Currently, the most logical buy zone sits at 147.170. If price reaches this level and performs a retest, it’s likely to target the 149.185 level.
I'll personally be entering at 147.170 and waiting for my target: 149.000.
This setup is based on the 4-hour timeframe, so it may take some time to reach the target.
Every single like you give is a major source of motivation for me to keep sharing these analyses.
Thanks so much to everyone supporting with a like!

USDJPY UPSIDE The dollar index (DXY00) on Tuesday rose by +0.22% and posted a 5-week high. The dollar has carryover support from Monday following the EU-US trade deal that is seen as favoring the US. Also, expectations for the Fed to keep interest rates unchanged at the end of Wednesday's 2-day FOMC meeting are supportive of the dollar. The dollar extended its gains after the US Jun advance goods trade deficit unexpectedly shrank, a supportive factor for Q2 GDP, and after July consumer confidence rose more than expected.

USDJPY – DAILY FORECAST Q3 | W31 | D30 | Y25📊 USDJPY – DAILY FORECAST
Q3 | W31 | D30 | Y25
Daily Forecast 🔍📅
Here’s a short diagnosis of the current chart setup 🧠📈
Higher time frame order blocks have been identified — these are our patient points of interest 🎯🧭.
It’s crucial to wait for a confirmed break of structure 🧱✅ before forming a directional bias.
This keeps us disciplined and aligned with what price action is truly telling us.
📈 Risk Management Protocols
🔑 Core principles:
Max 1% risk per trade
Only execute at pre-identified levels
Use alerts, not emotion
Stick to your RR plan — minimum 1:2
🧠 You’re not paid for how many trades you take, you’re paid for how well you manage risk.
🧠 Weekly FRGNT Insight
"Trade what the market gives, not what your ego wants."
Stay mechanical. Stay focused. Let the probabilities work.
FX:USDJPY

AUDJPY – DAILY FORECAST Q3 | W31 | D30 | Y25
📊 AUDJPY – DAILY FORECAST
Q3 | W31 | D30 | Y25
Daily Forecast 🔍📅
Here’s a short diagnosis of the current chart setup 🧠📈
Higher time frame order blocks have been identified — these are our patient points of interest 🎯🧭.
It’s crucial to wait for a confirmed break of structure 🧱✅ before forming a directional bias.
This keeps us disciplined and aligned with what price action is truly telling us.
📈 Risk Management Protocols
🔑 Core principles:
Max 1% risk per trade
Only execute at pre-identified levels
Use alerts, not emotion
Stick to your RR plan — minimum 1:2
🧠 You’re not paid for how many trades you take, you’re paid for how well you manage risk.
🧠 Weekly FRGNT Insight
"Trade what the market gives, not what your ego wants."
Stay mechanical. Stay focused. Let the probabilities work.
FX:AUDJPY

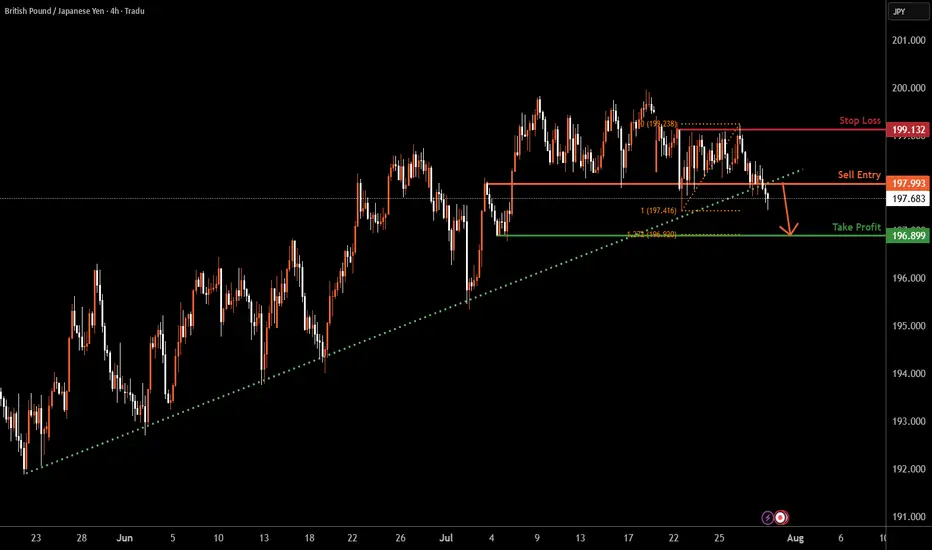
GBPJPY H4 | Bearish dropGBP/JPY has broken below the support level, which is an overlap support. A potential pullback to the sell entry, followed by a reversal, could lead to a further price drop.
Sell entry is at 197.99, which is an overlap resistance.
Stop loss is at 199.13, which is a pullback resistance.
Take profit is at 196.89, which is a swing low support that lines up with the 127.2% Fibonacci extension.
High Risk Investment Warning
Trading Forex/CFDs on margin carries a high level of risk and may not be suitable for all investors. Leverage can work against you.
Stratos Markets Limited (tradu.com ):
CFDs are complex instruments and come with a high risk of losing money rapidly due to leverage. 65% of retail investor accounts lose money when trading CFDs with this provider. You should consider whether you understand how CFDs work and whether you can afford to take the high risk of losing your money.
Stratos Europe Ltd (tradu.com ):
CFDs are complex instruments and come with a high risk of losing money rapidly due to leverage. 66% of retail investor accounts lose money when trading CFDs with this provider. You should consider whether you understand how CFDs work and whether you can afford to take the high risk of losing your money.
Stratos Global LLC (tradu.com ):
Losses can exceed deposits.
Please be advised that the information presented on TradingView is provided to Tradu (‘Company’, ‘we’) by a third-party provider (‘TFA Global Pte Ltd’). Please be reminded that you are solely responsible for the trading decisions on your account. There is a very high degree of risk involved in trading. Any information and/or content is intended entirely for research, educational and informational purposes only and does not constitute investment or consultation advice or investment strategy. The information is not tailored to the investment needs of any specific person and therefore does not involve a consideration of any of the investment objectives, financial situation or needs of any viewer that may receive it. Kindly also note that past performance is not a reliable indicator of future results. Actual results may differ materially from those anticipated in forward-looking or past performance statements. We assume no liability as to the accuracy or completeness of any of the information and/or content provided herein and the Company cannot be held responsible for any omission, mistake nor for any loss or damage including without limitation to any loss of profit which may arise from reliance on any information supplied by TFA Global Pte Ltd.
The speaker(s) is neither an employee, agent nor representative of Tradu and is therefore acting independently. The opinions given are their own, constitute general market commentary, and do not constitute the opinion or advice of Tradu or any form of personal or investment advice. Tradu neither endorses nor guarantees offerings of third-party speakers, nor is Tradu responsible for the content, veracity or opinions of third-party speakers, presenters or participants.