CHFJPY A Fall Expected! SELL!
My dear subscribers,
My technical analysis for CHFJPY is below:
The price is coiling around a solid key level - 175.19
Bias - Bearish
Technical Indicators: Pivot Points Low anticipates a potential price reversal.
Super trend shows a clear sell, giving a perfect indicators' convergence.
Goal - 174.21
My Stop Loss - 175.78
About Used Indicators:
By the very nature of the supertrend indicator, it offers firm support and resistance levels for traders to enter and exit trades. Additionally, it also provides signals for setting stop losses
Disclosure: I am part of Trade Nation's Influencer program and receive a monthly fee for using their TradingView charts in my analysis.
———————————
WISH YOU ALL LUCK
JPY (Japanese Yen)

CHFJPY: Bearish Continuation & Short Signal
CHFJPY
- Classic bearish formation
- Our team expects pullback
SUGGESTED TRADE:
Swing Trade
Short CHFJPY
Entry - 174.92
Sl - 175.54
Tp - 173.81
Our Risk - 1%
Start protection of your profits from lower levels
Disclosure: I am part of Trade Nation's Influencer program and receive a monthly fee for using their TradingView charts in my analysis.
❤️ Please, support our work with like & comment! ❤️

CHF/JPY BEARS ARE GAINING STRENGTH|SHORT
CHF/JPY SIGNAL
Trade Direction: short
Entry Level: 174.668
Target Level: 172.727
Stop Loss: 175.944
RISK PROFILE
Risk level: medium
Suggested risk: 1%
Timeframe: 1D
Disclosure: I am part of Trade Nation's Influencer program and receive a monthly fee for using their TradingView charts in my analysis.
✅LIKE AND COMMENT MY IDEAS✅

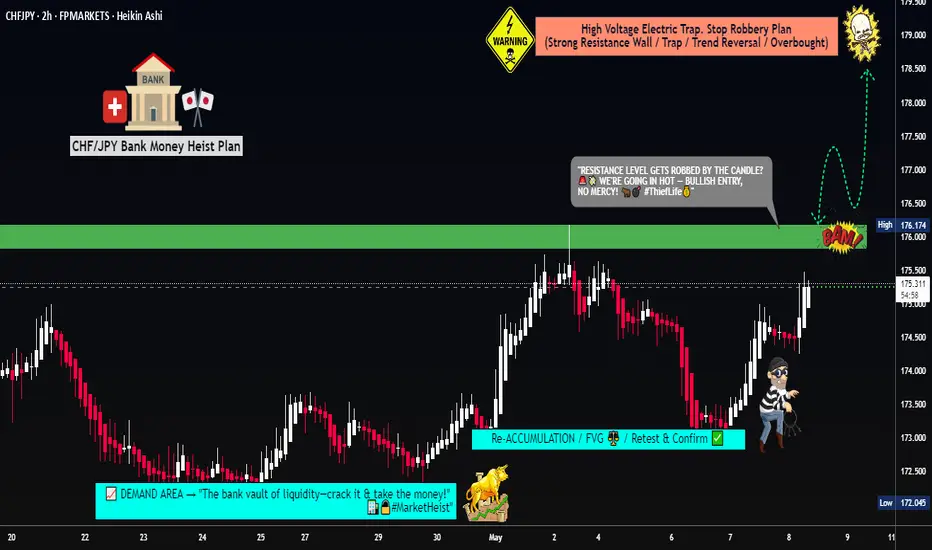
CHF/JPY "Swissy vs Yen" Forex Bullish Heist (Swing Trade Plan)🌟Hi! Hola! Ola! Bonjour! Hallo! Marhaba!🌟
Dear Money Makers & Robbers, 🤑 💰💸✈️
Based on 🔥Thief Trading style technical and fundamental analysis🔥, here is our master plan to heist the CHF/JPY "Swissy vs Yen" Forex Market. Please adhere to the strategy I've outlined in the chart, which emphasizes long entry. Our aim is to escape near the high-risk Red Zone Level. Risky level, overbought market, consolidation, trend reversal, trap at the level where traders and bearish robbers are stronger. 🏆💸"Take profit and treat yourself, traders. You deserve it!💪🏆🎉
Entry 📈 : "The heist is on! Wait for the Resistance breakout (176.300) then make your move - Bullish profits await!"
however I advise to Place Buy stop orders above the Moving average (or) Place buy limit orders within a 15 or 30 minute timeframe most recent or swing, low or high level for Pullback entries.
📌I strongly advise you to set an "alert (Alarm)" on your chart so you can see when the breakout entry occurs.
Stop Loss 🛑: "🔊 Yo, listen up! 🗣️ If you're lookin' to get in on a buy stop order, don't even think about settin' that stop loss till after the breakout 🚀. You feel me? Now, if you're smart, you'll place that stop loss where I told you to 📍, but if you're a rebel, you can put it wherever you like 🤪 - just don't say I didn't warn you ⚠️. You're playin' with fire 🔥, and it's your risk, not mine 👊."
📍 Thief SL placed at the recent/swing low level Using the 2H timeframe (174.300) Day/Swing trade basis.
📍 SL is based on your risk of the trade, lot size and how many multiple orders you have to take.
🏴☠️Target 🎯: 179.000 (or) Escape Before the Target.
🧲Scalpers, take note 👀 : only scalp on the Long side. If you have a lot of money, you can go straight away; if not, you can join swing traders and carry out the robbery plan. Use trailing SL to safeguard your money 💰.
💰💵💸CHF/JPY "Swissy vs Yen" Forex Bank Heist (Swing Trade Plan) is currently experiencing a neutral trend there is high chance for bullishness,., driven by several key factors. .☝☝☝
📰🗞️Get & Read the Fundamental, Macro, COT Report, Inventory and Storage Analysis, Seasonal Factors, Sentimental Outlook, Intermarket Analysis, Future trend targets.. go ahead to check 👉👉👉🔗🔗🌎🌏🗺
⚠️Trading Alert : News Releases and Position Management 📰 🗞️ 🚫🚏
As a reminder, news releases can have a significant impact on market prices and volatility. To minimize potential losses and protect your running positions,
we recommend the following:
Avoid taking new trades during news releases
Use trailing stop-loss orders to protect your running positions and lock in profits
💖Supporting our robbery plan 💥Hit the Boost Button💥 will enable us to effortlessly make and steal money 💰💵. Boost the strength of our robbery team. Every day in this market make money with ease by using the Thief Trading Style.🏆💪🤝❤️🎉🚀
I'll see you soon with another heist plan, so stay tuned 🤑🐱👤🤗🤩
CHF/JPY BEARS ARE GAINING STRENGTH|SHORT
Hello, Friends!
CHF/JPY is making a bullish rebound on the 2H TF and is nearing the resistance line above while we are generally bearish biased on the pair due to our previous 1W candle analysis, thus making a trend-following short a good option for us with the target being the 174.161 level.
Disclosure: I am part of Trade Nation's Influencer program and receive a monthly fee for using their TradingView charts in my analysis.
✅LIKE AND COMMENT MY IDEAS✅

CHF/JPY CHART Previous chart I share it's does not look good so I try to repost again,hope you will understand analysis by reading previous explanation and combine with the chart above, thanks

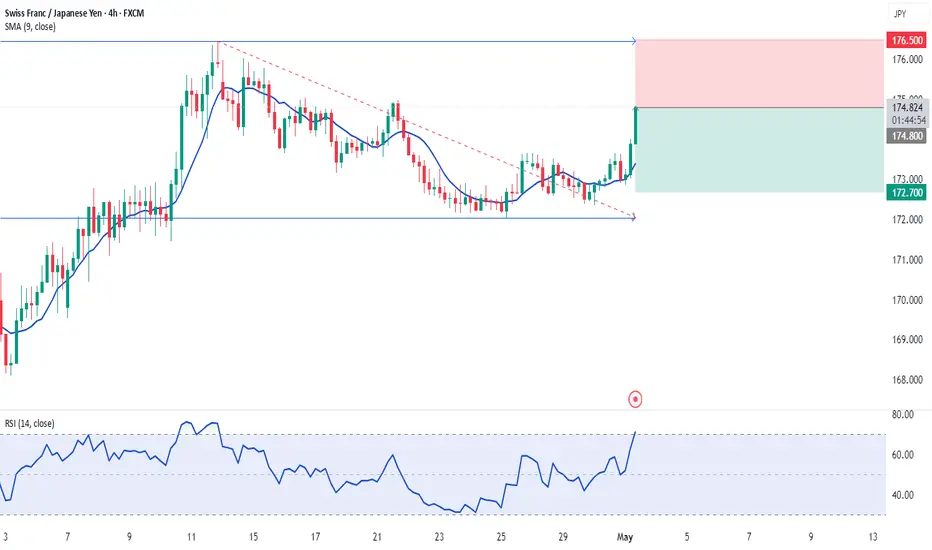
CHFJPY | 01.05.2025SELL 174.800 | STOP 176.500 | TAKE 172.700 | Japan released data on 1 May 2025 and left the key interest rate unchanged at 0.05%. This expectedly boosted the rates of related currencies. The Swiss franc will stand out in this position in our opinion. We expect multidirectional price movement in a range above the 174.000 level. Then we are likely to observe a decline in the indicator to the lower boundary of local support.
CHFJPY Analysis – Bearish Rejection at ResistanceCHFJPY pair is showing signs of exhaustion near a strong resistance zone just under 176.00. With price action printing multiple rejections and forming lower highs, the setup favors a bearish bias heading into mid-Q2 2025. With Japanese yen sentiment strengthening despite market doubts and Swiss inflation data showing stagnation, the technical picture is aligning with macro fundamentals for a potential drop.
📊 Technical Outlook (Daily Chart)
Key Resistance Rejected:
Price failed to sustain above 175.75–176.15 area, a strong historical resistance.
Multiple rejection wicks highlight bearish pressure at this level.
Bearish Structure:
Rising wedge and flag breakdowns have preceded the current move.
The chart shows a projected bearish leg forming, with three potential targets marked by green support zones.
Support Levels to Watch:
172.61 – Minor structure and neckline support.
171.00 – Key horizontal zone; likely the first major test.
168.50–166.50 – Final bearish targets based on previous structure and price consolidation.
Bearish Trade Plan (as indicated):
Entry zone: ~174.80–175.50 (after a confirmed lower high or breakdown).
Stop: Above 176.15 (structure invalidation).
TP1: 172.60
TP2: 171.00
TP3: 168.50
Final TP: 166.50
🌐 Fundamental Drivers
Swiss Inflation (April 2025):
Swiss CPI was flat MoM and YoY (0.0%), reflecting weak price momentum
Core inflation remained modest (+0.1%), reducing pressure on SNB to tighten policy.
JPY Sentiment & Positioning:
COT data shows record net-long JPY positions, suggesting strong speculative interest
Analysts warn of overbought sentiment, but dovish BoJ policy continues to suppress JPY bears for now.
Macro Context:
Risk-off sentiment or yield curve steepening could favor the yen further.
CHF may weaken if Swiss data continues to underwhelm.
✅ Summary
CHFJPY has rejected strong resistance, and both technical and macro indicators suggest a pullback is likely. A break below 172.60 could open the door to deeper declines toward 168.50–166.50 in the coming weeks.

CHFJPY Technical AnalysisThis CHF/JPY 1-hour chart represents a bearish setup with a short position already marked, showing a clear entry point, stop loss, and two take-profit levels (Target 1 and Target 2). The trader appears to be capitalizing on a breakdown from a minor consolidation near the 174.9–175.0 zone, which previously acted as support.
Price has decisively broken below that support, and is now trading around 174.63, with rejection wicks confirming selling pressure just beneath the old support turned resistance. The current candle structure suggests a weak recovery attempt, likely a bearish retest of the breakdown zone, forming what resembles a bear flag or descending channel pullback.
The Bollinger Bands are starting to widen after a squeeze, with the price now below both the 20-period moving average and the lower band, reinforcing bearish momentum. The RSI confirms this bias, currently sitting below the midline (around 38), indicating weakening bullish strength and possible oversold territory—but without divergence, which keeps the short bias intact.
Volume supports this move, as selling volume spiked on the initial breakdown, while the following green candles show diminished buying effort. This divergence between price action and volume is typical of a bearish continuation setup.
The first target sits around the 174.00 level — a round number and previous demand area. The second target is deeper, around 172.88, which likely corresponds to a higher time frame demand or order block. If momentum builds below 174.00, especially with sustained volume, the move toward Target 2 is plausible.
Overall, this trade assumes a continuation of bearish momentum, following a failed bullish attempt, with risk managed just above the broken structure. The setup hinges on the breakdown holding, making the 174.9–175.0 zone critical: any strong reclaim above it invalidates the bearish thesis.

USDCAD BULLISH OR BEARISH DETAILED ANALYSISUSDCAD is currently trading around 1.3820, exhibiting a bullish bias as it approaches the upper boundary of a consolidation range. The pair has been forming a symmetrical triangle pattern, indicating potential for a breakout. A decisive move above the 1.3850 resistance level could pave the way toward the 1.3920 target.
Fundamentally, the U.S. dollar has gained strength due to stronger-than-expected manufacturing data, with the ISM PMI rising to 48.7 in April, surpassing forecasts. This data has bolstered U.S. yields and supported the dollar. Conversely, the Canadian dollar has faced pressure from weaker domestic manufacturing activity, with the S\&P Global Canada Manufacturing PMI falling to 45.3, marking the sharpest contraction since May 2020 .
Additionally, recent U.S. tariff announcements on Canadian goods have introduced further uncertainty, potentially impacting Canada's export-driven economy. The Bank of Canada may consider easing monetary policy to counteract these challenges, which could further weaken the Canadian dollar.
In summary, USDCAD is poised for a potential breakout above 1.3850, driven by a combination of technical patterns and fundamental factors favoring the U.S. dollar. Traders should monitor key resistance levels and economic indicators to confirm the continuation of this upward trend.

CHF/JPY BULLS ARE STRONG HERE|LONG
CHF/JPY SIGNAL
Trade Direction: long
Entry Level: 172.570
Target Level: 175.428
Stop Loss: 170.661
RISK PROFILE
Risk level: medium
Suggested risk: 1%
Timeframe: 8h
Disclosure: I am part of Trade Nation's Influencer program and receive a monthly fee for using their TradingView charts in my analysis.
✅LIKE AND COMMENT MY IDEAS✅

CHFJPY My Opinion! SELL!
My dear friends,
CHFJPY looks like it will make a good move, and here are the details:
The market is trading on 174.67 pivot level.
Bias - Bearish
Technical Indicators: Supper Trend generates a clear short signal while Pivot Point HL is currently determining the overall Bearish trend of the market.
Goal - 173.76
About Used Indicators:
Pivot points are a great way to identify areas of support and resistance, but they work best when combined with other kinds of technical analysis
Disclosure: I am part of Trade Nation's Influencer program and receive a monthly fee for using their TradingView charts in my analysis.
———————————
WISH YOU ALL LUCK

CHFJPY...LONGOANDA:CHFJPY
Price is testing a level that has proven significant in the past. Will it hold or break this time? The market always tells a story — we just have to listen.
A confirmed breakout and retest of this level could shift the bias and offer a new opportunity.

CHF_JPY GROWTH AHEAD|LONG|
✅CHF_JPY made a retest
Of the horizontal support
Around 172.500 and we are
Already seeing a powerful
Rebound so we are bullish
Biased and we will be
Expecting a further move up
LONG🚀
✅Like and subscribe to never miss a new idea!✅
Disclosure: I am part of Trade Nation's Influencer program and receive a monthly fee for using their TradingView charts in my analysis.

CHFJPY: Long Trade with Entry/SL/TP
CHFJPY
- Classic bullish pattern
- Our team expects retracement
SUGGESTED TRADE:
Swing Trade
Buy CHFJPY
Entry - 172.36
Stop - 171.45
Take - 174.05
Our Risk - 1%
Start protection of your profits from lower levels
Disclosure: I am part of Trade Nation's Influencer program and receive a monthly fee for using their TradingView charts in my analysis.
❤️ Please, support our work with like & comment! ❤️
CHFJPY Massive Long! BUY!
My dear subscribers,
My technical analysis for CHFJPY is below:
The price is coiling around a solid key level - 173.75
Bias - Bearish
Technical Indicators: Pivot Points Low anticipates a potential price reversal.
Super trend shows a clear sell, giving a perfect indicators' convergence.
Goal - 174.91
About Used Indicators:
By the very nature of the supertrend indicator, it offers firm support and resistance levels for traders to enter and exit trades. Additionally, it also provides signals for setting stop losses
Disclosure: I am part of Trade Nation's Influencer program and receive a monthly fee for using their TradingView charts in my analysis.
———————————
WISH YOU ALL LUCK

CHFJPY Rejection from Multi-Year ResistanceCHFJPY recently rejected strongly from the 176.15 resistance zone, a level that has historically acted as a ceiling since mid-2023. After a parabolic rise into this resistance, we’re now seeing early signs of a bearish reversal pattern, indicating sellers may be regaining control.
Key Technical Levels:
Current Price: 173.19
Resistance Zone: 176.15 – 177.07 (multi-year highs)
Bearish Targets:
🎯 TP1: 171.00 – psychological and structural support
🎯 TP2: 168.50 – previous demand zone
🎯 TP3: 166.50 – strong horizontal support area
Invalidation: Daily close above 176.15 would nullify the bearish setup.
📉 Bearish Confluence Factors:
✅ Price rejection from historical resistance
✅ Formation of lower highs on the lower timeframe
✅ Overbought conditions following a strong rally
✅ Potential double-top or head & shoulders formation developing
📌 Strategy Outlook:
Bias: Bearish below 176.15
Entry Trigger: Break below recent minor swing low (~172.80)
SL: Above 176.15
Targets: 171.00, 168.50, and 166.50
🧠 Fundamental Angle (Contextual Support):
CHF strength may be peaking amid fading safe-haven flows
JPY might strengthen if global risk sentiment worsens or yields decline
Possible SNB caution on an overly strong franc could weigh on CHF
BoJ policy stance still favors volatility in yen pairs, but CHFJPY is heavily extended and due for correction
📌 Conclusion:
CHFJPY appears to be in the early stages of a technical pullback after reaching key resistance. If momentum builds below 172.80, expect bearish continuation toward 168.50 and possibly 166.50 in the coming weeks.

Daily Price Action CHFJPY Tuesday 4/22/2025In this video, we will be looking into the potential price action of CHFJPY.

CHFJPY Sellers In Panic! BUY!
My dear followers,
I analysed this chart on CHFJPY and concluded the following:
The market is trading on 172.72 pivot level.
Bias - Bullish
Technical Indicators: Both Super Trend & Pivot HL indicate a highly probable Bullish continuation.
Target - 174.03
About Used Indicators:
A super-trend indicator is plotted on either above or below the closing price to signal a buy or sell. The indicator changes color, based on whether or not you should be buying. If the super-trend indicator moves below the closing price, the indicator turns green, and it signals an entry point or points to buy.
Disclosure: I am part of Trade Nation's Influencer program and receive a monthly fee for using their TradingView charts in my analysis.
———————————
WISH YOU ALL LUCK

CHFJPY LIVE TRADE AND EDUCATIONAL BREAKDOWN 120 PIPS CAUGHTThe current rate of CHFJPY is 174.095 JPY — it has increased by 0.14% in the past 24 hours. See more of CHFJPY rate dynamics on the detailed chart. How is CHFJPY exchange rate calculated? The value of the CHFJPY pair is quoted as 1 CHF per x JPY.

CHF/JPY "Swiss vs Yen" Forex Bank Heist Plan (Swing/Day)🌟Hi! Hola! Ola! Bonjour! Hallo! Marhaba!🌟
Dear Money Makers & Robbers, 🤑 💰💸✈️
Based on 🔥Thief Trading style technical and fundamental analysis🔥, here is our master plan to heist the CHF/JPY "Swiss vs Yen" Forex Market. Please adhere to the strategy I've outlined in the chart, which emphasizes long entry. Our aim is the high-risk ATR Zone. Risky level, overbought market, consolidation, trend reversal, trap at the level where traders and bearish robbers are stronger. 🏆💸"Take profit and treat yourself, traders. You deserve it!💪🏆🎉
Entry 📈 : "The heist is on! Wait for the MA breakout (172.500) then make your move - Bullish profits await!"
however I advise to Place Buy stop orders above the Moving average (or) Place buy limit orders within a 15 or 30 minute timeframe most recent or swing, low or high level.
📌I strongly advise you to set an "alert (Alarm)" on your chart so you can see when the breakout entry occurs.
Stop Loss 🛑: "🔊 Yo, listen up! 🗣️ If you're lookin' to get in on a buy stop order, don't even think about settin' that stop loss till after the breakout 🚀. You feel me? Now, if you're smart, you'll place that stop loss where I told you to 📍, but if you're a rebel, you can put it wherever you like 🤪 - just don't say I didn't warn you ⚠️. You're playin' with fire 🔥, and it's your risk, not mine 👊."
📍 Thief SL placed at the recent/swing low level Using the 4H timeframe (169.700) Day / swing trade basis.
📍 SL is based on your risk of the trade, lot size and how many multiple orders you have to take.
🏴☠️Target 🎯: 175.500 (or) Escape Before the Target
🧲Scalpers, take note 👀 : only scalp on the Long side. If you have a lot of money, you can go straight away; if not, you can join swing traders and carry out the robbery plan. Use trailing SL to safeguard your money 💰.
CHF/JPY "Swiss vs Yen" Forex Market Heist Plan (Swing / Day Trade) is currently experiencing a bullishness,., driven by several key factors.👇👇👇
📰🗞️Get & Read the Fundamental, Macro, COT Report, Quantitative Analysis, Sentimental Outlook, Intermarket Analysis, Future trend targets..., go ahead to check 👉👉👉🔗
Detailed Explanation 🗣️
Point 1: Fundamentals balance CHF stability 🛡️ with JPY’s inflation-driven gains 🔥, but CHF edges out due to resilience 💪.
Point 2: Macro favors CHF’s safe-haven status 🛡️ over JPY’s debt-laden economy 📉.
Point 3: Global risk-off tilts toward CHF 🌍, though JPY holds as a secondary safe haven ⚖️.
Point 4: COT data supports CHF bullishness 📈, with institutional backing 🏦.
Point 5: Intermarket gold 🏅 and equity trends 📉 reinforce CHF strength 💪.
Point 6: Quantitative neutrality ⚖️ suggests a breakout is imminent, likely upward 📈.
Point 7: Sentiment leans bullish 📈, driven by institutions 🏦, with retail caution 🤔.
Point 8: Trends project short-term gains 🚀, medium-term consolidation ⚖️, and long-term uncertainty 🔮.
Point 9: Bullish outlook reflects CHF’s dominance in current conditions 📈.
⚠️Trading Alert : News Releases and Position Management 📰 🗞️ 🚫🚏
As a reminder, news releases can have a significant impact on market prices and volatility. To minimize potential losses and protect your running positions,
we recommend the following:
Avoid taking new trades during news releases
Use trailing stop-loss orders to protect your running positions and lock in profits
💖Supporting our robbery plan 💥Hit the Boost Button💥 will enable us to effortlessly make and steal money 💰💵. Boost the strength of our robbery team. Every day in this market make money with ease by using the Thief Trading Style.🏆💪🤝❤️🎉🚀
I'll see you soon with another heist plan, so stay tuned 🤑🐱👤🤗🤩

CHF-JPY Will Go UP! Buy!
Hello,Traders!
CHF-JPY is trading in an
Uptrend and the pair is
Hovering just above the
Horizontal support level
Around 172.900 so we
Are bullish biased and
We will be expecting a
Swing move up on Monday
Buy!
Comment and subscribe to help us grow!
Check out other forecasts below too!
Disclosure: I am part of Trade Nation's Influencer program and receive a monthly fee for using their TradingView charts in my analysis.

CHFJPY SHORTI see on daily divergence, we have trend line brake two times on 1h that is indication for short.
