Bullish bounce?USD/JPY is falling towards the pivot and could bounce to the 61.9% Fibonacci retracement.
Pivot: 144.13
1st Support: 142.17
1st Resistance: 148.59
Risk Warning:
Trading Forex and CFDs carries a high level of risk to your capital and you should only trade with money you can afford to lose. Trading Forex and CFDs may not be suitable for all investors, so please ensure that you fully understand the risks involved and seek independent advice if necessary.
Disclaimer:
The above opinions given constitute general market commentary, and do not constitute the opinion or advice of IC Markets or any form of personal or investment advice.
Any opinions, news, research, analyses, prices, other information, or links to third-party sites contained on this website are provided on an "as-is" basis, are intended only to be informative, is not an advice nor a recommendation, nor research, or a record of our trading prices, or an offer of, or solicitation for a transaction in any financial instrument and thus should not be treated as such. The information provided does not involve any specific investment objectives, financial situation and needs of any specific person who may receive it. Please be aware, that past performance is not a reliable indicator of future performance and/or results. Past Performance or Forward-looking scenarios based upon the reasonable beliefs of the third-party provider are not a guarantee of future performance. Actual results may differ materially from those anticipated in forward-looking or past performance statements. IC Markets makes no representation or warranty and assumes no liability as to the accuracy or completeness of the information provided, nor any loss arising from any investment based on a recommendation, forecast or any information supplied by any third-party.
Jpy

USDJPY - 4H more fall expectedFX:USDJPY - 4H Update 🔻
If you've traded USDJPY in recent years, you're no stranger to the significance of the 150.00 zone. This level has historically acted as a critical resistance and psychological barrier.
Now, the pair is trading below this key level and has also broken the ascending channel support on the daily timeframe, signaling that bulls are likely out of the game. The recent drop to 147.00 and bounce toward 151.00 could be setting up the next short opportunity.
📌 What to watch for:
A liquidity grab above the 151.50–152.00 zone could occur before the next fall.
This aligns with institutional behavior, hunting stops before continuing the trend.
We're now in a sell-the-rally phase, watching for confirmations around the red zone.
Remember, I previously signaled a short from the 157 zone, which played out beautifully. We’re now gearing up for the next big short, and this setup might just be it.
📉 Stay cautious, wait for price action signals, and trust the structure.
💸 If you’ve missed previous entries, don’t miss what’s coming next!
🔔 Follow for real-time updates and live trade ideas!

USD/JPY(20250404)Today's AnalysisToday's long and short boundaries:
146.84
Support and resistance levels
150.91
149.39
148.40
145.27
144.28
142.76
Trading strategy:
If the price breaks through 146.84, consider buying, the first target price is 148.40
If the price breaks through 145.27, consider selling, the first target price is 144.28

Falling towards Fibo confluence?USD/JPY is falling towards the pivot which is a pullback support and could bounce tot he 1st resistance.
Pivot: 143.94
1st Support: 142.19
1st Resistance: 147.13
Risk Warning:
Trading Forex and CFDs carries a high level of risk to your capital and you should only trade with money you can afford to lose. Trading Forex and CFDs may not be suitable for all investors, so please ensure that you fully understand the risks involved and seek independent advice if necessary.
Disclaimer:
The above opinions given constitute general market commentary, and do not constitute the opinion or advice of IC Markets or any form of personal or investment advice.
Any opinions, news, research, analyses, prices, other information, or links to third-party sites contained on this website are provided on an "as-is" basis, are intended only to be informative, is not an advice nor a recommendation, nor research, or a record of our trading prices, or an offer of, or solicitation for a transaction in any financial instrument and thus should not be treated as such. The information provided does not involve any specific investment objectives, financial situation and needs of any specific person who may receive it. Please be aware, that past performance is not a reliable indicator of future performance and/or results. Past Performance or Forward-looking scenarios based upon the reasonable beliefs of the third-party provider are not a guarantee of future performance. Actual results may differ materially from those anticipated in forward-looking or past performance statements. IC Markets makes no representation or warranty and assumes no liability as to the accuracy or completeness of the information provided, nor any loss arising from any investment based on a recommendation, forecast or any information supplied by any third-party.

GBPJPY: Channel Down started its new bearish wave.GBJPY is neutral on its 1D technical outlook (RSI = 45.648, MACD = 0.440, ADX = 26.099) as the price is testing the 1D MA50 again, being already on a 4 red day streak. The recent March 28th high almost touched the top of the 6 month Channel Down, so it can be technically considered a LH. Since the 1D RSI already crossed under its MA, we have a validated sell signal. Both prior bearish waves reached the 1.1 Fibonacci extension. Aim just over it (TP = 186.500).
## If you like our free content follow our profile to get more daily ideas. ##
## Comments and likes are greatly appreciated. ##

Gbpcad SellPrice has been making LL pointing to strength in downtrend and now price closed below the oh so very important 1.85172. the stop i wouldve like to put it above the last high but its ok im still is comfortable with it due to the volume nice scalp based on how fast the trade should hit tp or sl.

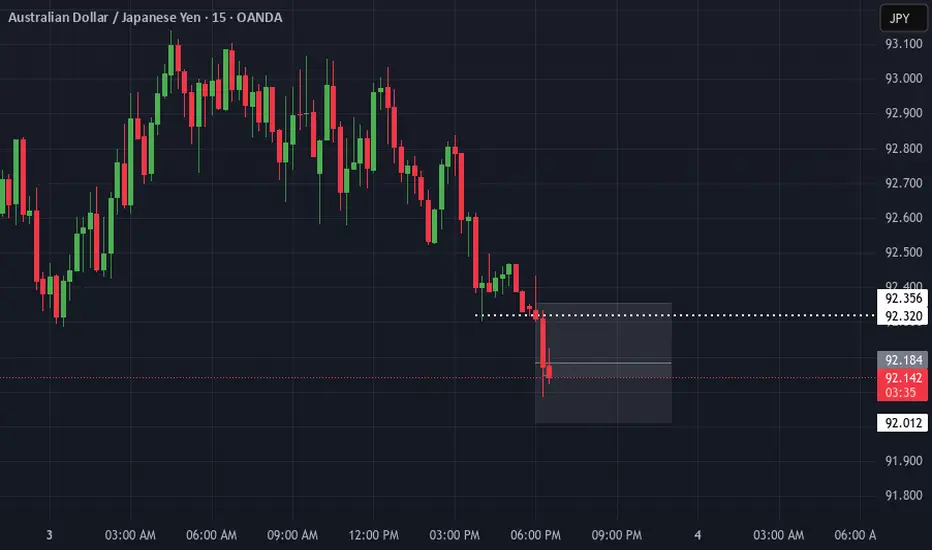
AUDJPY to find sellers at market price?AUDJPY - 24h expiry
There is no indication that the selloff is coming to an end.
Further downside is expected.
Risk/Reward would be poor to call a sell from current levels.
A move through 92.50 will confirm the bearish momentum.
The measured move target is 91.75.
We look to Sell at 93.00 (stop at 93.50)
Our profit targets will be 92.00 and 91.75
Resistance: 92.75 / 93.00 / 93.25
Support: 92.25 / 92.00 / 91.75
Risk Disclaimer
The trade ideas beyond this page are for informational purposes only and do not constitute investment advice or a solicitation to trade. This information is provided by Signal Centre, a third-party unaffiliated with OANDA, and is intended for general circulation only. OANDA does not guarantee the accuracy of this information and assumes no responsibilities for the information provided by the third party. The information does not take into account the specific investment objectives, financial situation, or particular needs of any particular person. You should take into account your specific investment objectives, financial situation, and particular needs before making a commitment to trade, including seeking advice from an independent financial adviser regarding the suitability of the investment, under a separate engagement, as you deem fit.
You accept that you assume all risks in independently viewing the contents and selecting a chosen strategy.
Where the research is distributed in Singapore to a person who is not an Accredited Investor, Expert Investor or an Institutional Investor, Oanda Asia Pacific Pte Ltd (“OAP“) accepts legal responsibility for the contents of the report to such persons only to the extent required by law. Singapore customers should contact OAP at 6579 8289 for matters arising from, or in connection with, the information/research distributed.

USD/JPY(20250403)Today's AnalysisMarket news:
US trade policy-① Trump signed an executive order to establish a 10% "minimum base tariff" for all countries, and will impose reciprocal tariffs, including 20% for the EU, 24% for Japan, 46% for Vietnam, and 25% for South Korea. The tariff exemption for goods that meet the USMCA will continue, and the tariff for those that do not meet the requirements will remain at 25%; ② The US Treasury Secretary called on countries not to retaliate; ③ The base tariff will take effect on April 5, and the reciprocal tariff will take effect on the 9th. In addition, the 25% automobile tariff will take effect on the 3rd, and the automobile parts tariff will take effect on May 3rd; ④ Gold bars, copper, pharmaceuticals, semiconductors and wood products are also not subject to "reciprocal tariffs".
Today's buying and selling boundaries:
149.61
Support and resistance levels
150.97
150.46
150.13
149.08
148.75
148.24
Trading strategy:
If the price breaks through 148.75, consider buying, the first target price is 149.08
If the price breaks through 148.24, consider selling, the first target price is 148.00

Audchf SellPrice has been in a obvious downtrend. once price closes below 55015 on the 15min tf im looking for a nice scalp opportunity.

Bearish breakout?CAD/JPY is reacting off the pivot which acts as an overlap support and could drop to the 1st support which has been identified as a pullback support.
Pivot: 103.58
1st Support: 102.28
1st Resistance: 104.70
Risk Warning:
Trading Forex and CFDs carries a high level of risk to your capital and you should only trade with money you can afford to lose. Trading Forex and CFDs may not be suitable for all investors, so please ensure that you fully understand the risks involved and seek independent advice if necessary.
Disclaimer:
The above opinions given constitute general market commentary, and do not constitute the opinion or advice of IC Markets or any form of personal or investment advice.
Any opinions, news, research, analyses, prices, other information, or links to third-party sites contained on this website are provided on an "as-is" basis, are intended only to be informative, is not an advice nor a recommendation, nor research, or a record of our trading prices, or an offer of, or solicitation for a transaction in any financial instrument and thus should not be treated as such. The information provided does not involve any specific investment objectives, financial situation and needs of any specific person who may receive it. Please be aware, that past performance is not a reliable indicator of future performance and/or results. Past Performance or Forward-looking scenarios based upon the reasonable beliefs of the third-party provider are not a guarantee of future performance. Actual results may differ materially from those anticipated in forward-looking or past performance statements. IC Markets makes no representation or warranty and assumes no liability as to the accuracy or completeness of the information provided, nor any loss arising from any investment based on a recommendation, forecast or any information supplied by any third-party.

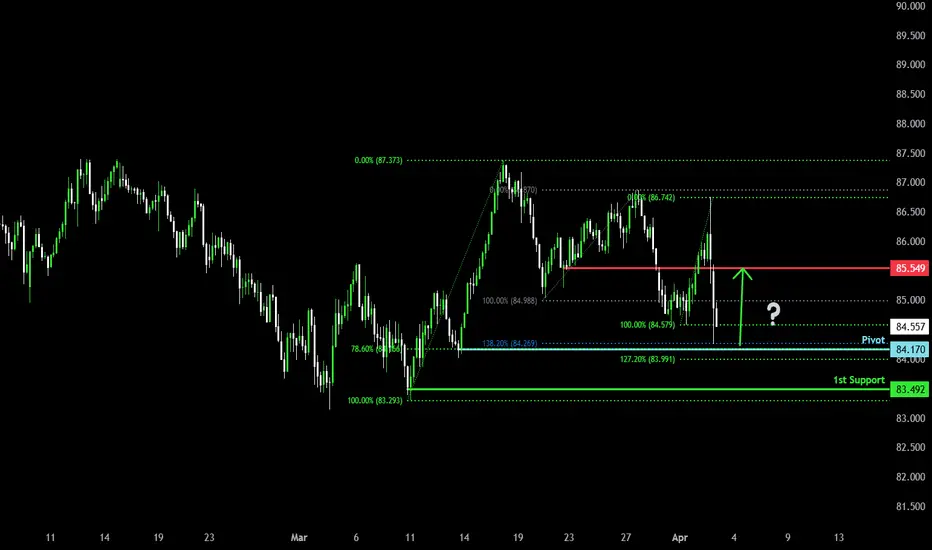
Could the price bounce from here?NZD/JPY is falling towards the pivot and could bounce to the 1st resistance.
Pivot: 84.49
1st Support: 83.49
1st Resistance: 85.54
Risk Warning:
Trading Forex and CFDs carries a high level of risk to your capital and you should only trade with money you can afford to lose. Trading Forex and CFDs may not be suitable for all investors, so please ensure that you fully understand the risks involved and seek independent advice if necessary.
Disclaimer:
The above opinions given constitute general market commentary, and do not constitute the opinion or advice of IC Markets or any form of personal or investment advice.
Any opinions, news, research, analyses, prices, other information, or links to third-party sites contained on this website are provided on an "as-is" basis, are intended only to be informative, is not an advice nor a recommendation, nor research, or a record of our trading prices, or an offer of, or solicitation for a transaction in any financial instrument and thus should not be treated as such. The information provided does not involve any specific investment objectives, financial situation and needs of any specific person who may receive it. Please be aware, that past performance is not a reliable indicator of future performance and/or results. Past Performance or Forward-looking scenarios based upon the reasonable beliefs of the third-party provider are not a guarantee of future performance. Actual results may differ materially from those anticipated in forward-looking or past performance statements. IC Markets makes no representation or warranty and assumes no liability as to the accuracy or completeness of the information provided, nor any loss arising from any investment based on a recommendation, forecast or any information supplied by any third-party.
GBP/JPY SELL SETUP 250 PIPS1️⃣ Macro Fundamental Analysis (GBP vs. JPY)
🔹 Interest Rate Differentials (Carry Trade Impact)
Bank of England (GBP)
The BoE has kept rates high to fight inflation.
Higher GBP rates → capital inflows into GBP assets.
Bullish for GBP/JPY.
Bank of Japan (JPY)
BoJ is still ultra-dovish, keeping negative/low interest rates.
Japan’s government wants a weak yen to support exports.
Bearish for JPY, Bullish for GBP/JPY (carry trade flows into GBP).
📊 Institutional View:
Hedge funds & large investors prefer long GBP/JPY due to high interest rate spreads.
GBP/JPY remains fundamentally bullish due to carry trade inflows.
🔹 Global Risk Sentiment (Risk-On vs. Risk-Off)
GBP/JPY is a "risk-on" pair → it rises when markets are bullish and falls when investors seek safety.
If stock markets are bullish, GBP/JPY tends to rise.
If there’s a global crisis, investors move into JPY (safe-haven), causing GBP/JPY to fall.
Current Market Sentiment:
Stock markets are uncertain, but no full risk-off move yet.
Watch equity markets & US bond yields for risk sentiment confirmation.
📊 Institutional View:
Mild risk-on bias → GBP/JPY has support, but volatility remains high.
🔹 Institutional Positioning (COT Data & Hedge Fund Flows)
Hedge funds have been buying GBP against JPY due to the rate differential.
Commitment of Traders (COT) Report:
Shows institutional investors are still net long GBP/JPY but reducing positions.
Some profit-taking could lead to short-term downside.
📊 Institutional View:
Long-term institutional bias is bullish, but hedge funds may reduce positions if risk-off sentiment increases.
2️⃣ Technical Analysis (ITPM Style) – Multi-Timeframe Breakdown
🔹 GBP/JPY (Daily Timeframe)
📈 Trend: Still in an uptrend, but approaching resistance.
📌 Key Resistance: 195.00 - 196.00
📌 Key Support: 191.00 - 190.00
🔹 Price is struggling at resistance near 194.00.
🔹 Possible pullback to 191.50 - 192.00 before resuming higher.
🔹 GBP/JPY (H4 Timeframe)
📉 Short-Term Weakness, but Still in an Uptrend Channel
📌 Key Level to Watch: 192.50 - 193.00
🔹 Bearish Rejection at 194.00, but still inside an uptrend structure.
🔹 If price breaks below 192.50, a deeper correction to 191.00 is likely.
🔹 GBP/JPY (H1 Timeframe)
📉 Intraday Weakness, Watch 192.50 for Breakdown
📌 Key Levels:
Resistance: 193.50 - 194.00
Support: 192.50 (short-term support), 191.50 (stronger support)
📊 Institutional View:
Intraday traders may take short positions below 192.50, targeting 191.50 - 191.00.
3️⃣ Institutional Trade Setup (ITPM Style)
🔴 Bearish Scenario (Short-Term Correction)
Entry: Sell below 192.50 (Break of key support).
Target: 191.50 → 190.00 (support zone).
Stop-Loss: Above 193.50.
Rationale: Short-term hedge funds taking profits → minor pullback in bullish trend.

CHFJPY rebound on the 1D MA50 expected.The CHFJPY pair is trading within a long-term Descending Triangle and right now is pulling back to test the 1D MA50. This is almost halfway through the rebound that started on the February 28 2025 Support Zone test.
All previous rallies hit at least the 0.786 Fibonacci retracement level before reversing but since this time we are limited below the Lower Highs trend-line of the Descending Triangle, our Target is 172.500.
-------------------------------------------------------------------------------
** Please LIKE 👍, FOLLOW ✅, SHARE 🙌 and COMMENT ✍ if you enjoy this idea! Also share your ideas and charts in the comments section below! This is best way to keep it relevant, support us, keep the content here free and allow the idea to reach as many people as possible. **
-------------------------------------------------------------------------------
💸💸💸💸💸💸
👇 👇 👇 👇 👇 👇

Falling towards pullback support?CAD/JPY is falling towards the pivot and could bounce to the 1st resistance which is a pullback resistance.
Pivot: 104.27
1st Support: 103.54
1st Resistance: 105.58
Risk Warning:
Trading Forex and CFDs carries a high level of risk to your capital and you should only trade with money you can afford to lose. Trading Forex and CFDs may not be suitable for all investors, so please ensure that you fully understand the risks involved and seek independent advice if necessary.
Disclaimer:
The above opinions given constitute general market commentary, and do not constitute the opinion or advice of IC Markets or any form of personal or investment advice.
Any opinions, news, research, analyses, prices, other information, or links to third-party sites contained on this website are provided on an "as-is" basis, are intended only to be informative, is not an advice nor a recommendation, nor research, or a record of our trading prices, or an offer of, or solicitation for a transaction in any financial instrument and thus should not be treated as such. The information provided does not involve any specific investment objectives, financial situation and needs of any specific person who may receive it. Please be aware, that past performance is not a reliable indicator of future performance and/or results. Past Performance or Forward-looking scenarios based upon the reasonable beliefs of the third-party provider are not a guarantee of future performance. Actual results may differ materially from those anticipated in forward-looking or past performance statements. IC Markets makes no representation or warranty and assumes no liability as to the accuracy or completeness of the information provided, nor any loss arising from any investment based on a recommendation, forecast or any information supplied by any third-party.

USD/JPY(20250402)Today's AnalysisToday's buying and selling boundaries:
149.55
Support and resistance levels
150.70
150.27
149.99
149.11
148.83
148.40
Trading strategy:
If the price breaks through 149.99, consider buying, the first target price is 150.27
If the price breaks through 149.55, consider selling, the first target price is 149.11

Bearish drop?USD/JPY is reacting off the resistance level which is a pullback resistance that aligns with the 38.2% Fibonacci retracement and could drop from this level to our take profit.
Entry: 149.50
Why we like it:
There is a pullback resistance level that lies up with the 38.2% Fibonacci retracement.
Stop loss: 149.95
Why we like it:
There is a pullback resistance level that lines up with the 71% Fibonacci retracement.
Take profit: 148.66
Why we like it:
There is a pullback support level.
Enjoying your TradingView experience? Review us!
Please be advised that the information presented on TradingView is provided to Vantage (‘Vantage Global Limited’, ‘we’) by a third-party provider (‘Everest Fortune Group’). Please be reminded that you are solely responsible for the trading decisions on your account. There is a very high degree of risk involved in trading. Any information and/or content is intended entirely for research, educational and informational purposes only and does not constitute investment or consultation advice or investment strategy. The information is not tailored to the investment needs of any specific person and therefore does not involve a consideration of any of the investment objectives, financial situation or needs of any viewer that may receive it. Kindly also note that past performance is not a reliable indicator of future results. Actual results may differ materially from those anticipated in forward-looking or past performance statements. We assume no liability as to the accuracy or completeness of any of the information and/or content provided herein and the Company cannot be held responsible for any omission, mistake nor for any loss or damage including without limitation to any loss of profit which may arise from reliance on any information supplied by Everest Fortune Group.

CHFJPY - Bearish Rising WedgeHello Traders !
The CHFJPY failed to create a new higher high!
The price formed a rising wedge pattern.
Currently, The support line is broken !
So, I expect a bearish move📉
________________
TARGET: 168.750🎯

Bearish drop?USD/JPY is rising towards the resistanec elvel which is a pullback resistance and could drop from this level to the downside.

Pullback resistanceahead?CAD/JPY is rising towards the pivot which acts as a pullback resistance and could reverse to the 1st support which is a pullback support.
Pivot: 104.77
1st Support: 103.15
1st Resistance: 105.39
Risk Warning:
Trading Forex and CFDs carries a high level of risk to your capital and you should only trade with money you can afford to lose. Trading Forex and CFDs may not be suitable for all investors, so please ensure that you fully understand the risks involved and seek independent advice if necessary.
Disclaimer:
The above opinions given constitute general market commentary, and do not constitute the opinion or advice of IC Markets or any form of personal or investment advice.
Any opinions, news, research, analyses, prices, other information, or links to third-party sites contained on this website are provided on an "as-is" basis, are intended only to be informative, is not an advice nor a recommendation, nor research, or a record of our trading prices, or an offer of, or solicitation for a transaction in any financial instrument and thus should not be treated as such. The information provided does not involve any specific investment objectives, financial situation and needs of any specific person who may receive it. Please be aware, that past performance is not a reliable indicator of future performance and/or results. Past Performance or Forward-looking scenarios based upon the reasonable beliefs of the third-party provider are not a guarantee of future performance. Actual results may differ materially from those anticipated in forward-looking or past performance statements. IC Markets makes no representation or warranty and assumes no liability as to the accuracy or completeness of the information provided, nor any loss arising from any investment based on a recommendation, forecast or any information supplied by any third-party.

Bullish bounce?AUD/JPY has bounced of the pivot and could potentialy rise to the 1st resistance.
Pivot: 92.28
1st Support: 92.68
1st Resistance: 94.19
Risk Warning:
Trading Forex and CFDs carries a high level of risk to your capital and you should only trade with money you can afford to lose. Trading Forex and CFDs may not be suitable for all investors, so please ensure that you fully understand the risks involved and seek independent advice if necessary.
Disclaimer:
The above opinions given constitute general market commentary, and do not constitute the opinion or advice of IC Markets or any form of personal or investment advice.
Any opinions, news, research, analyses, prices, other information, or links to third-party sites contained on this website are provided on an "as-is" basis, are intended only to be informative, is not an advice nor a recommendation, nor research, or a record of our trading prices, or an offer of, or solicitation for a transaction in any financial instrument and thus should not be treated as such. The information provided does not involve any specific investment objectives, financial situation and needs of any specific person who may receive it. Please be aware, that past performance is not a reliable indicator of future performance and/or results. Past Performance or Forward-looking scenarios based upon the reasonable beliefs of the third-party provider are not a guarantee of future performance. Actual results may differ materially from those anticipated in forward-looking or past performance statements. IC Markets makes no representation or warranty and assumes no liability as to the accuracy or completeness of the information provided, nor any loss arising from any investment based on a recommendation, forecast or any information supplied by any third-party.

Potential Bearish Drop?USD/JPY is reacting off the pivot whichis a pullback resistance and could drop from this level to he downside.

Could the price reverse from here?USD/JPY is rising towards the resistance level which is a pullback resistance that lines up with the 71% Fibonacci retracement and could drop from this level to our take profit.
Entry: 150.40
Why we like it:
There is a pullback resistance level that lines up with the 71% Fibonacci retracement.
Stop loss: 150.89
Why we like it:
There is a pullback resistance that lines up with the 88.6% Fibonacci retracement.
Take profit: 149.62
Why we like it:
There is a pullback support level.
Enjoying your TradingView experience? Review us!
Please be advised that the information presented on TradingView is provided to Vantage (‘Vantage Global Limited’, ‘we’) by a third-party provider (‘Everest Fortune Group’). Please be reminded that you are solely responsible for the trading decisions on your account. There is a very high degree of risk involved in trading. Any information and/or content is intended entirely for research, educational and informational purposes only and does not constitute investment or consultation advice or investment strategy. The information is not tailored to the investment needs of any specific person and therefore does not involve a consideration of any of the investment objectives, financial situation or needs of any viewer that may receive it. Kindly also note that past performance is not a reliable indicator of future results. Actual results may differ materially from those anticipated in forward-looking or past performance statements. We assume no liability as to the accuracy or completeness of any of the information and/or content provided herein and the Company cannot be held responsible for any omission, mistake nor for any loss or damage including without limitation to any loss of profit which may arise from reliance on any information supplied by Everest Fortune Group.
