SELL EURJPYIn todays session we are monitoring EURJPY for selling opportunity. As seen eurjpy has been on a strong uptrend however 173 level has shown strong resistance and a willingness for market to go lower. Our entry is at 172.390 and stops are above 172.835 our target is 170.180 and lower. Use proper risk management cheers
Jpy
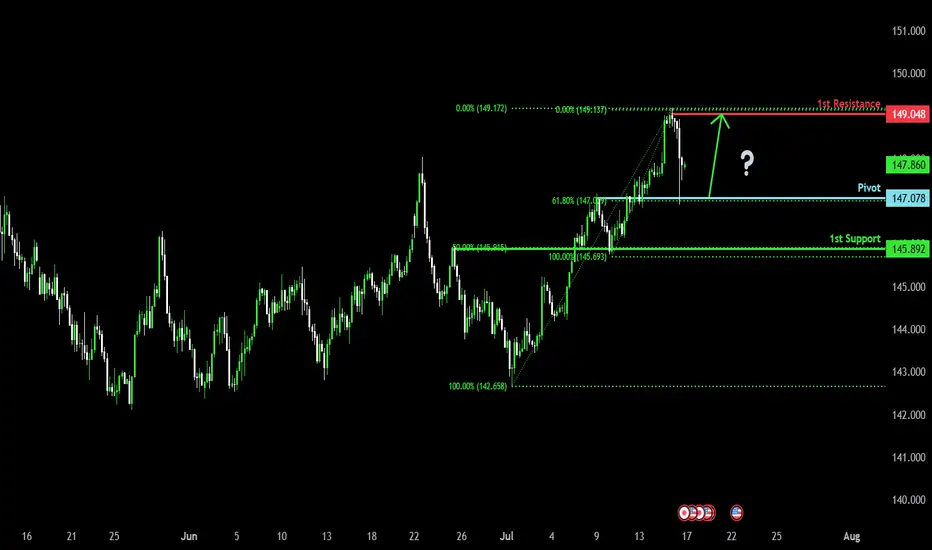
Bullish bounce off pullback support?USD/JPY is falling towards the pivot which aligns with the 61.8% Fibonacci retracement and could bounce to the 1st resistance.
Pivot: 147.07
1st Support: 145.89
1st Resistance: 149.04
Risk Warning:
Trading Forex and CFDs carries a high level of risk to your capital and you should only trade with money you can afford to lose. Trading Forex and CFDs may not be suitable for all investors, so please ensure that you fully understand the risks involved and seek independent advice if necessary.
Disclaimer:
The above opinions given constitute general market commentary, and do not constitute the opinion or advice of IC Markets or any form of personal or investment advice.
Any opinions, news, research, analyses, prices, other information, or links to third-party sites contained on this website are provided on an "as-is" basis, are intended only to be informative, is not an advice nor a recommendation, nor research, or a record of our trading prices, or an offer of, or solicitation for a transaction in any financial instrument and thus should not be treated as such. The information provided does not involve any specific investment objectives, financial situation and needs of any specific person who may receive it. Please be aware, that past performance is not a reliable indicator of future performance and/or results. Past Performance or Forward-looking scenarios based upon the reasonable beliefs of the third-party provider are not a guarantee of future performance. Actual results may differ materially from those anticipated in forward-looking or past performance statements. IC Markets makes no representation or warranty and assumes no liability as to the accuracy or completeness of the information provided, nor any loss arising from any investment based on a recommendation, forecast or any information supplied by any third-party.
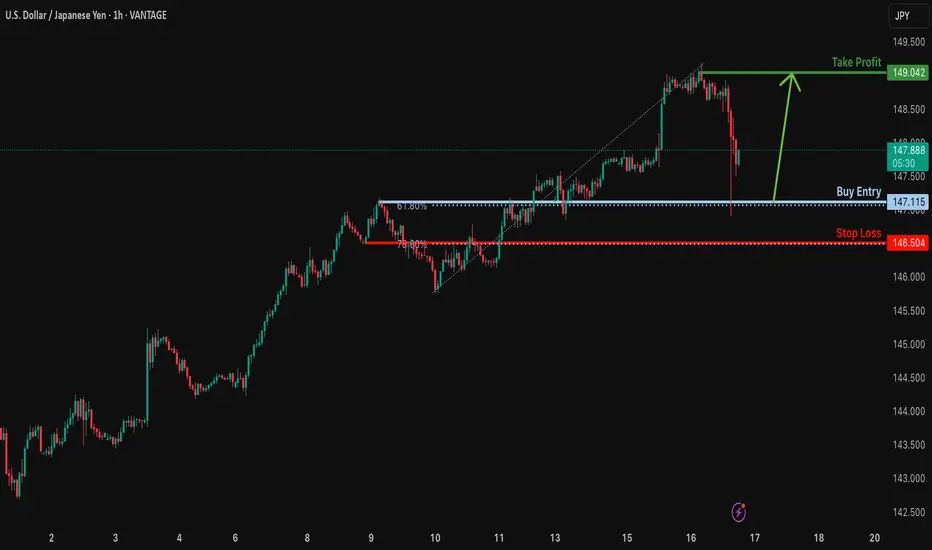
Bullish bounce off 61.8% Fibonacci support?USD/JPY is falling towards the support level which is an overlap support that aligns with the 61.8% Fibonacci retracement and could bounce from this level to our take profit.
Entry: 147.11
Why we like it:
There is an overlap support that lines up with the 61.8% Fibonacci retracement.
Stop loss: 146.50
Why we like it:
There is a pullback support that lines up with the 78.6% Fibonacci retracement.
Take profit: 149.04
Why we like it:
There is a pullback resistance.
Enjoying your TradingView experience? Review us!
Please be advised that the information presented on TradingView is provided to Vantage (‘Vantage Global Limited’, ‘we’) by a third-party provider (‘Everest Fortune Group’). Please be reminded that you are solely responsible for the trading decisions on your account. There is a very high degree of risk involved in trading. Any information and/or content is intended entirely for research, educational and informational purposes only and does not constitute investment or consultation advice or investment strategy. The information is not tailored to the investment needs of any specific person and therefore does not involve a consideration of any of the investment objectives, financial situation or needs of any viewer that may receive it. Kindly also note that past performance is not a reliable indicator of future results. Actual results may differ materially from those anticipated in forward-looking or past performance statements. We assume no liability as to the accuracy or completeness of any of the information and/or content provided herein and the Company cannot be held responsible for any omission, mistake nor for any loss or damage including without limitation to any loss of profit which may arise from reliance on any information supplied by Everest Fortune Group.
Australian job numbers and AUDWe are keeping a close eye on the Australian job numbers tonight. If you are trading AUD, then that's the data to watch. Let's dig in.
FX_IDC:AUDUSD
FX_IDC:AUDJPY
FX_IDC:AUDNZD
Let us know what you think in the comments below.
Thank you.
75.2% of retail investor accounts lose money when trading CFDs with this provider. You should consider whether you understand how CFDs work and whether you can afford to take the high risk of losing your money. Past performance is not necessarily indicative of future results. The value of investments may fall as well as rise and the investor may not get back the amount initially invested. This content is not intended for nor applicable to residents of the UK. Cryptocurrency CFDs and spread bets are restricted in the UK for all retail clients.

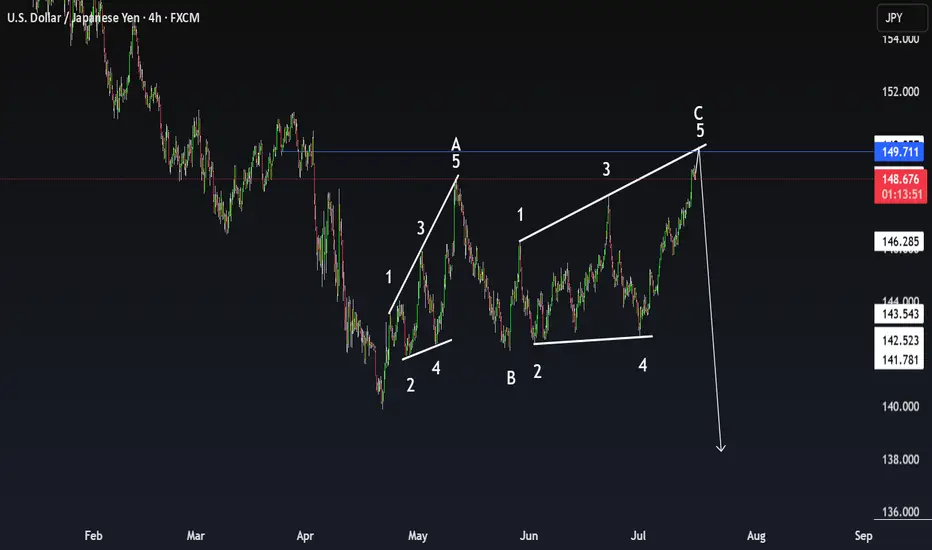
USDJPY Expanding Diagonal – Final Wave 5 at 149.71?FX:USDJPY FX_IDC:USDJPY
USD/JPY – 4H Chart – Elliott Wave Analysis
📅 July 16, 2025 | By: Trwin
🧠 Pattern Highlighted: Expanding Ending Diagonal (Wave C)
The current move from wave B to C appears to form a classic expanding ending diagonal, suggesting trend exhaustion near the key resistance zone of 149.71.
🔎 Key Features:
🔹 All 5 waves are structured as zigzags – a textbook ending diagonal.
🔹 Wave 3 > Wave 1, and Wave 5 > Wave 3 → confirms expanding structure
🔹 Wave 2 & 4 retraced deeper than typical impulses (common in diagonals)
🔹 Wedges are diverging, forming an expanding wedge.
🔹 Price is nearing a throw-over, hinting at final exhaustion.
💬 What do you think? Will USDJPY reverse hard from this expanding wedge or break higher into a blow-off top?
⚠️ Disclaimer:
This analysis is for educational purposes only and does not constitute financial advice. Trading carries risk, and past performance is not indicative of future results. Always do your own research and consult with a licensed financial advisor before making any trading decisions.
SHORT ON CHF/JPYCHF/JPY has given us a nice CHOC change of character to the downside after creating a new high.
I expect price to tap into supply before falling to the next demand zone. this is a SELL LIMIT order.
Looking to catch over 200 pips to the next demand zone.

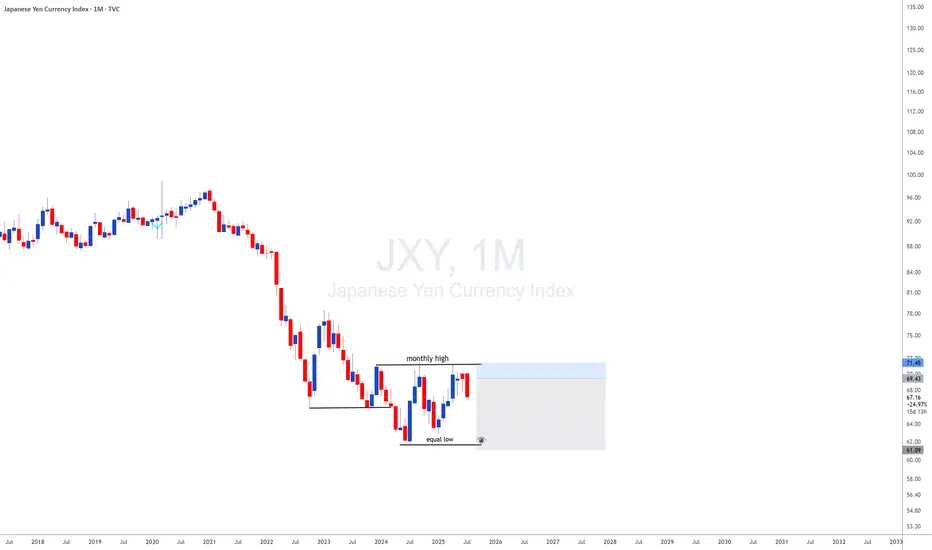
JXY with JXY looking monthly downside and DXY looing upside i will be looking for 35 years breakout of usdjpy meanning uj is a long therm upside
How to View the Assets in Japan
It should be noted that many of the assets the government owns are not marketable, or, if so, their
price can sharply drop in the case of fiscal crisis. Therefore, the financial situation should be assessed
first by gross debt.
In addition, the assets earmarked with the liabilities (such as pension reserves and FILP loans) are
not directly related to fiscal consolidation because they are not included in “Bonds outstanding of
central and local governments”, which is the benchmark of fiscal consolidation target
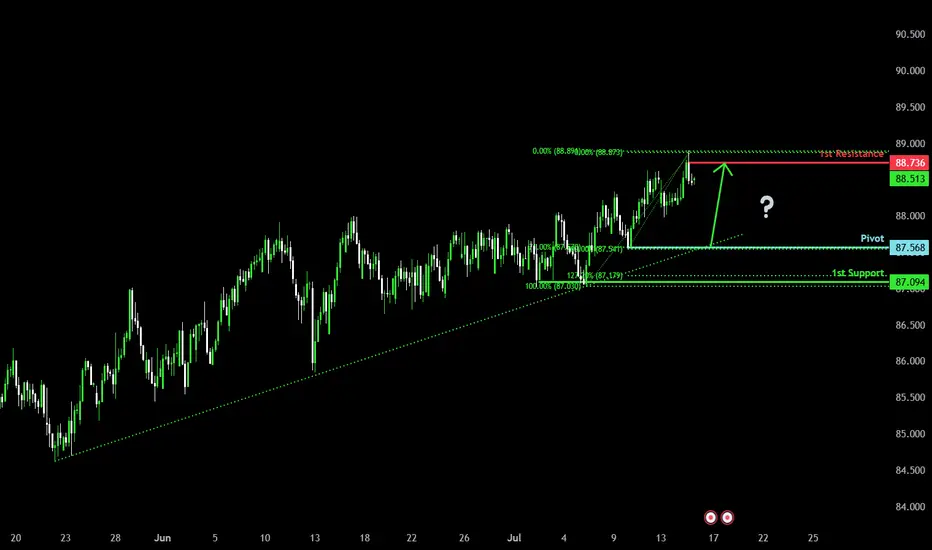
Bullish momentum to extend?NZD/JPY is falling towards the pivot and could bounce to the 1st resistance.
Pivot: 87.56
1st Support: 87.09
1st Resistance: 88.73
Risk Warning:
Trading Forex and CFDs carries a high level of risk to your capital and you should only trade with money you can afford to lose. Trading Forex and CFDs may not be suitable for all investors, so please ensure that you fully understand the risks involved and seek independent advice if necessary.
Disclaimer:
The above opinions given constitute general market commentary, and do not constitute the opinion or advice of IC Markets or any form of personal or investment advice.
Any opinions, news, research, analyses, prices, other information, or links to third-party sites contained on this website are provided on an "as-is" basis, are intended only to be informative, is not an advice nor a recommendation, nor research, or a record of our trading prices, or an offer of, or solicitation for a transaction in any financial instrument and thus should not be treated as such. The information provided does not involve any specific investment objectives, financial situation and needs of any specific person who may receive it. Please be aware, that past performance is not a reliable indicator of future performance and/or results. Past Performance or Forward-looking scenarios based upon the reasonable beliefs of the third-party provider are not a guarantee of future performance. Actual results may differ materially from those anticipated in forward-looking or past performance statements. IC Markets makes no representation or warranty and assumes no liability as to the accuracy or completeness of the information provided, nor any loss arising from any investment based on a recommendation, forecast or any information supplied by any third-party.
USDJPY - Trade The Range!Hello TradingView Family / Fellow Traders. This is Richard, also known as theSignalyst.
📈USDJPY has been trading within a range between $140 and $150 round numbers and it is currently retesting the upper bound of the range.
📚 As per my trading style:
As #USDJPY is around the red circle zone, I will be looking for bearish reversal setups (like a double top pattern, trendline break , and so on...)
📚 Always follow your trading plan regarding entry, risk management, and trade management.
Good luck!
All Strategies Are Good; If Managed Properly!
~Rich
Disclosure: I am part of Trade Nation's Influencer program and receive a monthly fee for using their TradingView charts in my analysis.

$GJ (GBPJPY) 1HPrice is currently forming a descending triangle pattern, with clear lower highs and a horizontal support zone.
Trendline resistance is actively being respected.
Liquidity is likely building below the horizontal support zone.
A false breakout or sweep above the trendline followed by rejection could trigger institutional distribution.
As long as the descending trendline holds, and no bullish BOS occurs, the structure remains bearish. Look for price to accumulate short positions before expansion.

$EJ (EURJPY) 1HPrice has been in an overall bullish structure, forming higher highs and higher lows.
Price tapped into a premium zone, showing signs of exhaustion.
After the liquidity run, we saw a rejection from the top, followed by a shift in structure.
A bearish FVG has formed, and price has now retraced back into it, offering a potential sell opportunity.
As long as price holds below the high and inside the premium FVG zone, bearish bias is valid. Any break above the recent high would invalidate this setup.

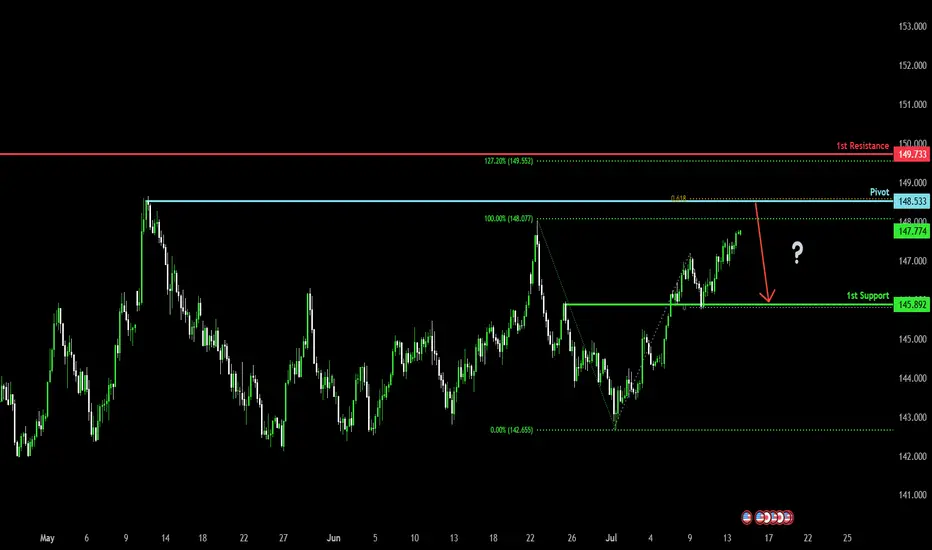
Could the price reverse from here?USD/JPY is rising towards the pivot which is a swing high resistance and could reverse to the 1st support which acts as an overlap support.
Pivot: 148.53
1st Support: 145.89
1st Resistance: 149.73
Risk Warning:
Trading Forex and CFDs carries a high level of risk to your capital and you should only trade with money you can afford to lose. Trading Forex and CFDs may not be suitable for all investors, so please ensure that you fully understand the risks involved and seek independent advice if necessary.
Disclaimer:
The above opinions given constitute general market commentary, and do not constitute the opinion or advice of IC Markets or any form of personal or investment advice.
Any opinions, news, research, analyses, prices, other information, or links to third-party sites contained on this website are provided on an "as-is" basis, are intended only to be informative, is not an advice nor a recommendation, nor research, or a record of our trading prices, or an offer of, or solicitation for a transaction in any financial instrument and thus should not be treated as such. The information provided does not involve any specific investment objectives, financial situation and needs of any specific person who may receive it. Please be aware, that past performance is not a reliable indicator of future performance and/or results. Past Performance or Forward-looking scenarios based upon the reasonable beliefs of the third-party provider are not a guarantee of future performance. Actual results may differ materially from those anticipated in forward-looking or past performance statements. IC Markets makes no representation or warranty and assumes no liability as to the accuracy or completeness of the information provided, nor any loss arising from any investment based on a recommendation, forecast or any information supplied by any third-party.
NZDJPY price action forming a top?NZDJPY - 24h expiry
Trading has been mixed and volatile.
Price action looks to be forming a top.
We look for a temporary move higher.
Preferred trade is to sell into rallies.
Bespoke resistance is located at 88.45.
We look to Sell at 88.45 (stop at 88.65)
Our profit targets will be 87.65 and 87.50
Resistance: 88.50 / 88.65 / 88.90
Support: 87.90 / 87.60 / 87.20
Risk Disclaimer
The trade ideas beyond this page are for informational purposes only and do not constitute investment advice or a solicitation to trade. This information is provided by Signal Centre, a third-party unaffiliated with OANDA, and is intended for general circulation only. OANDA does not guarantee the accuracy of this information and assumes no responsibilities for the information provided by the third party. The information does not take into account the specific investment objectives, financial situation, or particular needs of any particular person. You should take into account your specific investment objectives, financial situation, and particular needs before making a commitment to trade, including seeking advice from an independent financial adviser regarding the suitability of the investment, under a separate engagement, as you deem fit.
You accept that you assume all risks in independently viewing the contents and selecting a chosen strategy.
Where the research is distributed in Singapore to a person who is not an Accredited Investor, Expert Investor or an Institutional Investor, Oanda Asia Pacific Pte Ltd (“OAP“) accepts legal responsibility for the contents of the report to such persons only to the extent required by law. Singapore customers should contact OAP at 6579 8289 for matters arising from, or in connection with, the information/research distributed.

USD/JPY(20250714)Today's AnalysisMarket news:
① Fed's Goolsbee: The latest tariff threat may delay rate cuts. ② The Fed responded to the White House's "accusations": The increase in building renovation costs partly reflects unforeseen construction conditions. ③ "Fed's megaphone": The dispute over building renovations has challenged the Fed's independence again, and it is expected that no rate cuts will be made this month. ④ Hassett: Whether Trump fires Powell or not, the Fed's answer to the headquarters renovation is the key.
Technical analysis:
Today's buying and selling boundaries:
147.02
Support and resistance levels:
148.39
147.88
147.55
146.49
146.15
145.64
Trading strategy:
If the price breaks through 147.55, consider buying, and the first target price is 147.88
If the price breaks through 147.02, consider selling, and the first target price is 146.49

Volatile Times for GBPJPY: What’s Going On Behind the Moves?Good morning, Guys,
I’m anticipating a new short opportunity on GBPJPY once the pair reaches my sell zone level. From there, my target is set at 197.934.
Every like from you is what truly motivates me to keep sharing these insights.
Massive thanks to everyone who shows love and support!

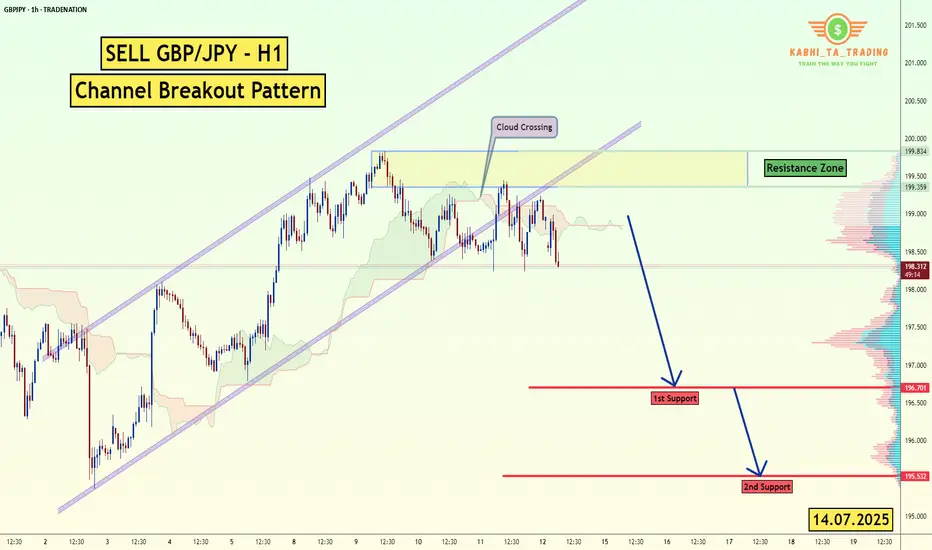
GBP/JPY -H1- Channel Breakout (14.07.2025)The GBP/JPY Pair on the H1 timeframe presents a Potential Selling Opportunity due to a recent Formation of a Channel Breakout Pattern. This suggests a shift in momentum towards the downside in the coming hours.
Possible Short Trade:
Entry: Consider Entering A Short Position around Trendline Of The Pattern.
Target Levels:
1st Support – 196.70
2nd Support – 195.53
🎁 Please hit the like button and
🎁 Leave a comment to support for My Post !
Your likes and comments are incredibly motivating and will encourage me to share more analysis with you.
Best Regards, KABHI_TA_TRADING
Thank you.
Disclosure: I am part of Trade Nation's Influencer program and receive a monthly fee for using their TradingView charts in my analysis.
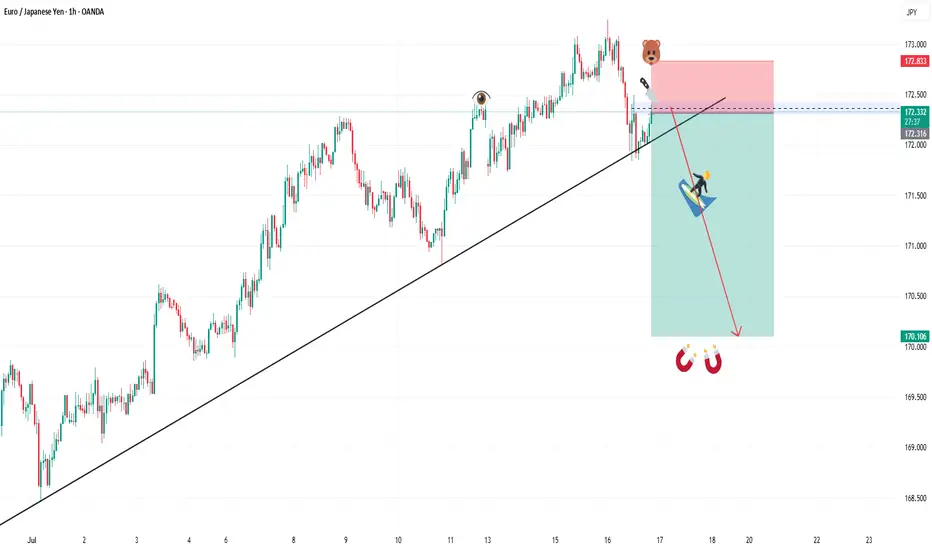
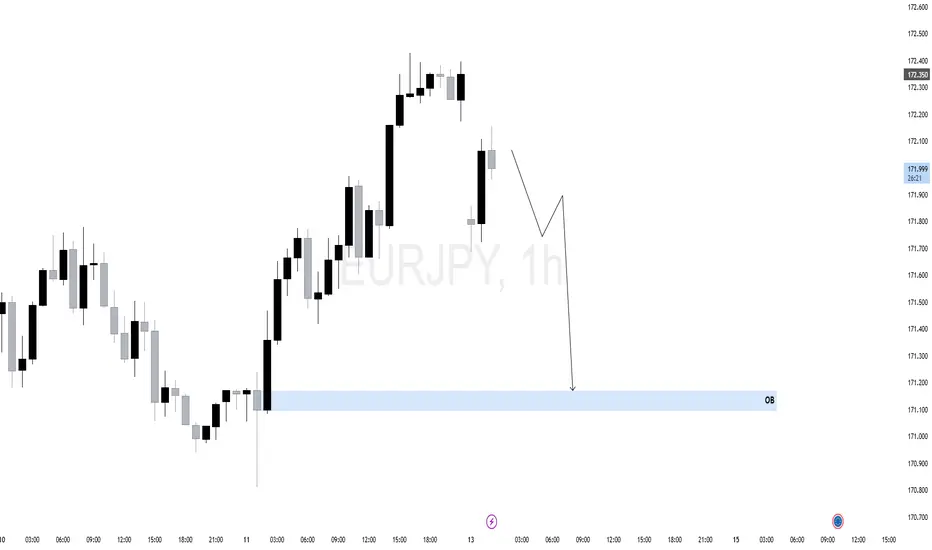
$EJ (EURJPY) 1HEURJPY recently showed a strong bullish rally off a key 1H Order Block (OB) near 171.200. This rally swept sell-side liquidity before shifting short-term structure.
However, current price action shows signs of weakness — multiple rejection wicks near 172.350 and a potential shift in momentum.
The corrective structure forming suggests the bullish move may have been a liquidity run. A clean lower high may confirm bearish intent.
As long as price remains below the recent swing high, we anticipate a short-term retracement toward the OB zone (171.200), which aligns with an area of unfilled orders and possible rebalancing.
Heading into pullback resistance?The USD/JPY is rising towards the pivot, which is a pullback resistance and could reverse to the 1st support.
Pivot: 148.44
1st Support: 143.24
1st Resistance: 151.23
Risk Warning:
Trading Forex and CFDs carries a high level of risk to your capital and you should only trade with money you can afford to lose. Trading Forex and CFDs may not be suitable for all investors, so please ensure that you fully understand the risks involved and seek independent advice if necessary.
Disclaimer:
The above opinions given constitute general market commentary, and do not constitute the opinion or advice of IC Markets or any form of personal or investment advice.
Any opinions, news, research, analyses, prices, other information, or links to third-party sites contained on this website are provided on an "as-is" basis, are intended only to be informative, is not an advice nor a recommendation, nor research, or a record of our trading prices, or an offer of, or solicitation for a transaction in any financial instrument and thus should not be treated as such. The information provided does not involve any specific investment objectives, financial situation and needs of any specific person who may receive it. Please be aware, that past performance is not a reliable indicator of future performance and/or results. Past Performance or Forward-looking scenarios based upon the reasonable beliefs of the third-party provider are not a guarantee of future performance. Actual results may differ materially from those anticipated in forward-looking or past performance statements. IC Markets makes no representation or warranty and assumes no liability as to the accuracy or completeness of the information provided, nor any loss arising from any investment based on a recommendation, forecast or any information supplied by any third-party.

AUDJPY LONG & SHORT – WEEKLY FORECAST Q3 | W29 | Y25💼 AUDJPY LONG & SHORT – WEEKLY FORECAST
Q3 | W29 | Y25
📊 MARKET STRUCTURE SNAPSHOT
AUD JPY is currently reaching for a key higher time frame supply zone, looking for price action to show weakness at premium levels. Structure and momentum are now aligning for a short opportunity backed by multi-timeframe confluence.
🔍 Confluences to Watch 📝
✅ Daily Order Block (OB)
Looking for Strong reaction and early signs of distribution.
✅ 4H Order Block
Break of internal structure (iBoS) confirms a short-term bearish transition.
✅ 1H Order Block
📈 Risk Management Protocols
🔑 Core principles:
Max 1% risk per trade
Only execute at pre-identified levels
Use alerts, not emotion
Stick to your RR plan — minimum 1:2
🧠 You’re not paid for how many trades you take, you’re paid for how well you manage risk.
🧠 Weekly FRGNT Insight
"Trade what the market gives, not what your ego wants."
Stay mechanical. Stay focused. Let the probabilities work.
🏁 Final Thoughts from FRGNT
📌 The structure is clear.
The confluences are stacked.
Let execution follow discipline, not emotion.
Why election risk means yen volatility could rise this weekThe Japanese yen remains vulnerable ahead of Japan’s Upper House election on July 20.
Polls suggest the ruling LDP-Komeito coalition may lose its Upper House majority. Such an outcome would further weaken Prime Minister Shigeru Ishiba’s position, with his government already operating as a minority in the Lower House.
Adding to the pressure, the U.S. is set to impose 25% tariffs on Japanese goods from August 1—part of a broader protectionist push.
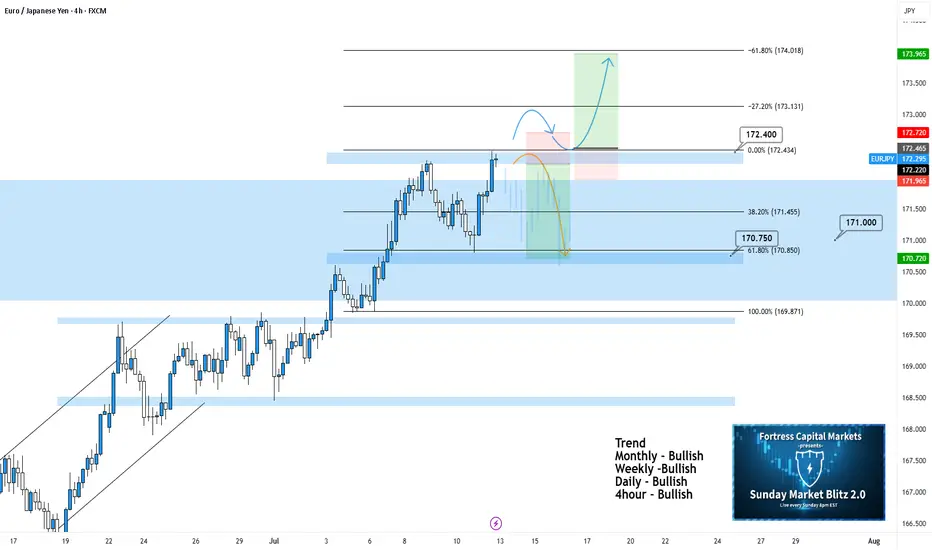
EURJPY 4hour TF - July 13th, 2025EURJPY 7/13/2025
EURJPY 4hour Bullish Idea
Monthly - Bullish
Weekly - Bullish
Daily - Bullish
4hour - Bullish
EJ has been paying out for the last couple weeks and the analysis has been spot on for these setups. Going into this week though we’re starting to get a bit uncertain. The fact that we’ve been in a rally since late June leaves me wondering how much more EJ has in it before a correction. So I think this week warrants some caution on EJ especially as we remain around this monthly 171.000 zone.
Let’s keep a look out for two potential scenarios going into this week:
Bullish Continuation - This is the most likely scenario and this idea lines up with all the major trends as well. For us to comfortably consider long setups I’d like to see a clear break above 172.400 zone / our 0% fib level followed by a retest for confirmation. This is what we would like to see but keep in mind price action has been moving aggressively and may not provide a retest.
Bearish Reversal into Range - This is a possibility but could also be a sign of consolidation around 171.000. There may be a decent short opportunity if we see the right kind of rejection/reversal from 172.400. In this scenario, it looks like this would be a potential range trade and I wouldn’t try to repeat this setup more than once.
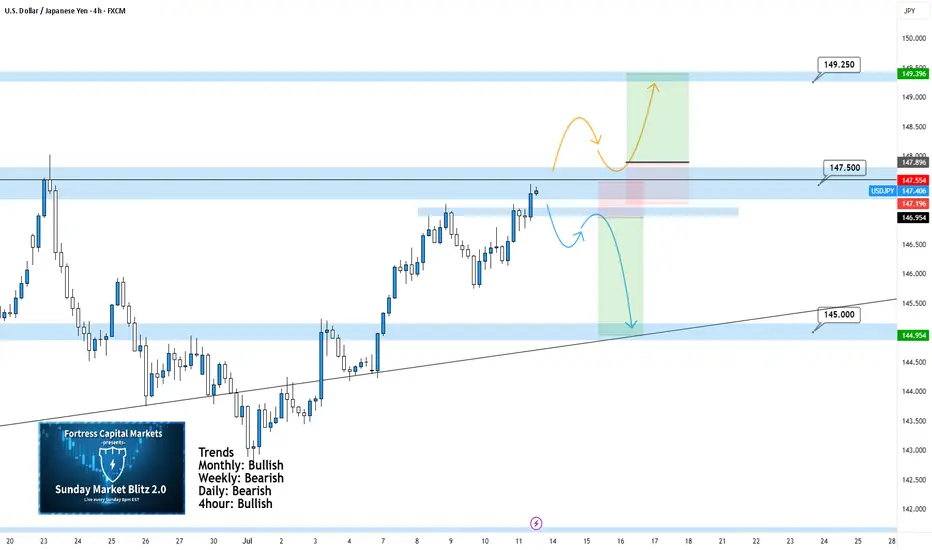
USDJPY 4Hour TF - July 13th, 2025USDJPY 7/13/2025
USDJPY 4Hour Neutral Idea
Monthly - Bullish
Weekly - Bearish
Daily - Bearish
4Hour - Bullish
Finally UJ is looking more clear. We’re now able to drop to the 4Hour instead of the Daily TF due to price action reaching a major zone of anticipated reactions.
As always we’re looking at two trade scenarios going into the week ahead:
Bullish Continuation - UJ is currently sitting at 147.500 resistance and closed there last week. Going into this week we could see the bullish trend continue but we would need to see a clear break of 147.500 resistance to gain confidence. Look for a higher low confirmed above 147.500 followed by strong bullish setups to enter long on. Look to target higher toward major resistance levels like 149.250 area.
Bearish Reversal: Despite the strong bullish momentum we saw from last week, a reversal is still possible as price action is near our 147.250 zone. In order to consider bearish setups we would need to see strong rejection from the current level of resistance. Look to target lower toward 145.000 support.
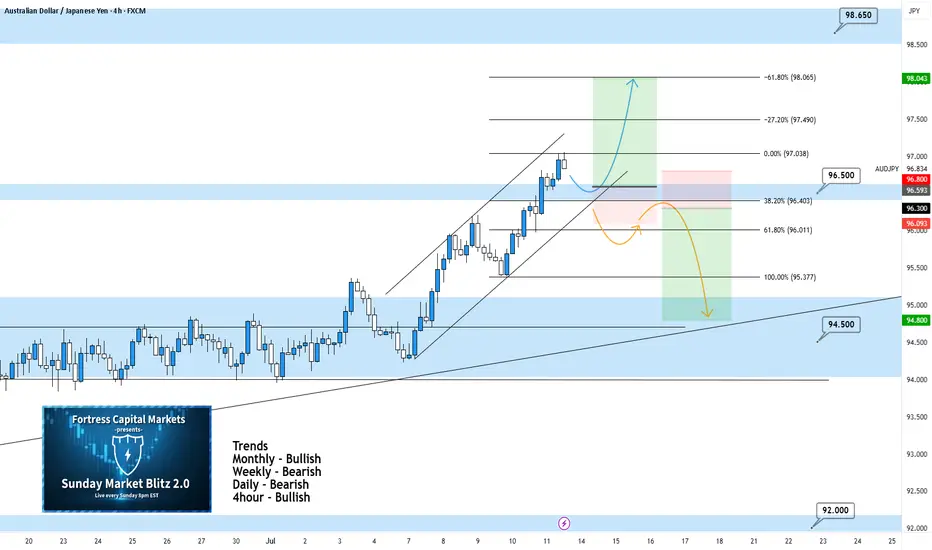
AUDJPY 4Hour TF - July 13th, 2025AUDJPY 7/13/2025
AUDJPY 4hour Bullish Idea
Monthly - Bullish
Weekly - Bearish
Dailly - Bearish
4hour - Bullish
Looking good on AJ! Last week’s analysis played out perfectly and we can see going into this week we have a similar scenario.
Here are the two potential trade paths for the week ahead:
Bullish Continuation - This is the most likely scenario going into this week as we just broke our 96.500 resistance and are now testing it as support. If we can confirm a higher low with strong bullish conviction we can look to enter long and target higher toward major resistance levels.
Bearish Reversal - For us to consider AJ bearish we would first need to see a break back below 96.500. If we can spot a clear trend change and some lower highs below 96.500 we can begin looking short. Target lower toward major support levels if this happens.