EURJPY SHORT – WEEKLY FORECAST Q3 | W29 | Y25💼 EURJPY SHORT – WEEKLY FORECAST
Q3 | W29 | Y25
📊 MARKET STRUCTURE SNAPSHOT
EURJPY is currently reacting from a key higher time frame supply zone, with price action showing weakness at premium levels. Structure and momentum are now aligning for a short opportunity backed by multi-timeframe confluence.
🔍 Confluences to Watch 📝
✅ Daily Order Block (OB)
Strong reaction and early signs of distribution.
Previous bullish momentum is losing steam; structure is flattening with rejection wicks forming.
✅ 4H Order Block
Break of internal structure (iBoS) confirms a short-term bearish transition.
✅ 1H Order Block
1H structure shift bearish
📈 Risk Management Protocols
🔑 Core principles:
Max 1% risk per trade
Only execute at pre-identified levels
Use alerts, not emotion
Stick to your RR plan — minimum 1:2
🧠 You’re not paid for how many trades you take, you’re paid for how well you manage risk.
🧠 Weekly FRGNT Insight
"Trade what the market gives, not what your ego wants."
Stay mechanical. Stay focused. Let the probabilities work.
🏁 Final Thoughts from FRGNT
📌 The structure is clear.
The confluences are stacked.
Let execution follow discipline, not emotion.
Jpy

EURJPY Hits Supply | Pullback Is ComingPrice has entered the daily supply zone (red area) between 170.80 and 171.80, showing immediate rejection with a long upper wick — a signal of potential short-term bearish reaction.
The RSI is turning lower, indicating loss of momentum, although it hasn’t reached extreme levels yet.
The current map suggests a technical pullback toward the 169.40–168.50 zone (FVG + dynamic support) before any potential bullish continuation toward 174+.
The overall structure remains bullish, but a correction looks likely due to technical exhaustion and retail positioning.
📊 2. COT Report (JPY Futures – as of 2025-07-01)
Non-Commercials (speculators) reduced long positions on the JPY by -7,779 contracts, and also slightly trimmed shorts → clear sign of position reduction.
Net positioning remains strongly negative (JPY weakness), but it's starting to recover slightly.
Commercials added both longs (+2,830) and shorts (+5,977), indicating indecision but growing interest.
Open interest slightly decreased (–516), though it remains elevated.
👉 The market has not yet reversed, but the JPY downtrend may be approaching exhaustion.
🧠 3. Retail Sentiment
86% of retail traders are short EUR/JPY — a strong contrarian bullish signal.
Average retail short entry: 166.27, while current price is 171.55 → retail traders are trapped and under pressure.
A short squeeze is likely underway or already completed, increasing the risk of a technical correction after distribution.
📅 4. Seasonality
July is historically weak for EUR/JPY:
20Y: -0.35
15Y: -0.49
10Y: -0.18
August tends to be even worse from a seasonal perspective.
This supports the idea of a potential pullback in the coming days or weeks.
Trading Conclusion
Current Bias: Short-term Neutral–Bearish, Medium-term Bullish.
✳️ Potential pullback from 172.30 toward 169.40–168.50
🎯 If price holds and builds clean bullish structure, expect continuation toward 174.00–175.00
❌ Invalidation on daily close below 167.80

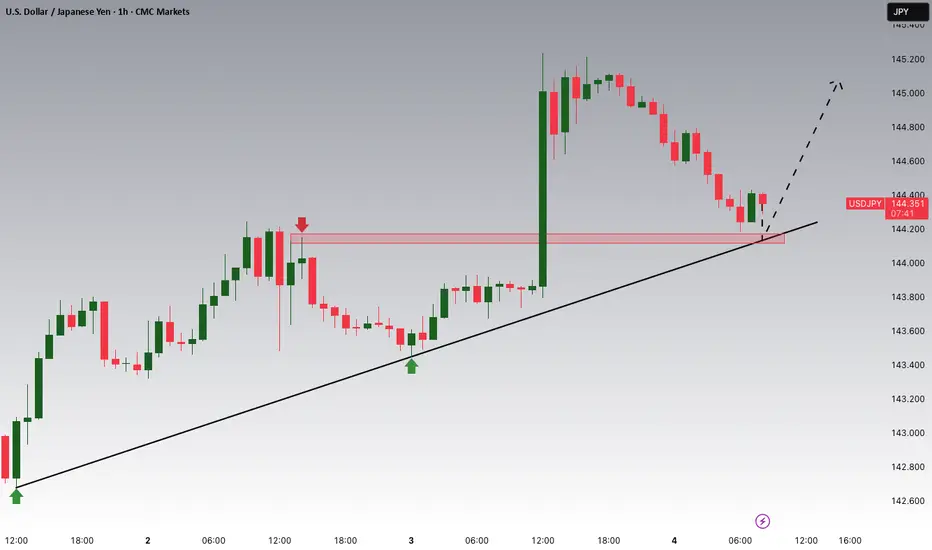
USD/JPY - H1- Wedge Breakout (07.07.2025)The USD/JPY pair on the H1 timeframe presents a Potential Buying Opportunity due to a recent Formation of a Wedge Breakout Pattern. This suggests a shift in momentum towards the upside and a higher likelihood of further advances in the coming hours.
Possible Long Trade:
Entry: Consider Entering A Long Position around Trendline Of The Pattern.
Target Levels:
1st Resistance – 148.00
🎁 Please hit the like button and
🎁 Leave a comment to support for My Post !
Your likes and comments are incredibly motivating and will encourage me to share more analysis with you.
Best Regards, KABHI_TA_TRADING
Thank you.
Disclosure: I am part of Trade Nation's Influencer program and receive a monthly fee for using their TradingView charts in my analysis.

EURJPY SHORT DAILY FORECAST Q3 D11 W28 Y25EURJPY SHORT DAILY FORECAST Q3 D11 W28 Y25
It’s Fun Coupon Friday! 💸🔥
Professional Risk Managers👋
Welcome back to another FRGNT chart update📈
Diving into some Forex setups using predominantly higher time frame order blocks alongside confirmation breaks of structure.
Let’s see what price action is telling us today! 👀
💡Here are some trade confluences📝
✅Daily Order block identified
✅4H Order Block identified
✅1H Order Block identified
🔑 Remember, to participate in trading comes always with a degree of risk, therefore as professional risk managers it remains vital that we stick to our risk management plan as well as our trading strategies.
📈The rest, we leave to the balance of probabilities.
💡Fail to plan. Plan to fail.
🏆It has always been that simple.
❤️Good luck with your trading journey, I shall see you at the very top.
🎯Trade consistent, FRGNT X

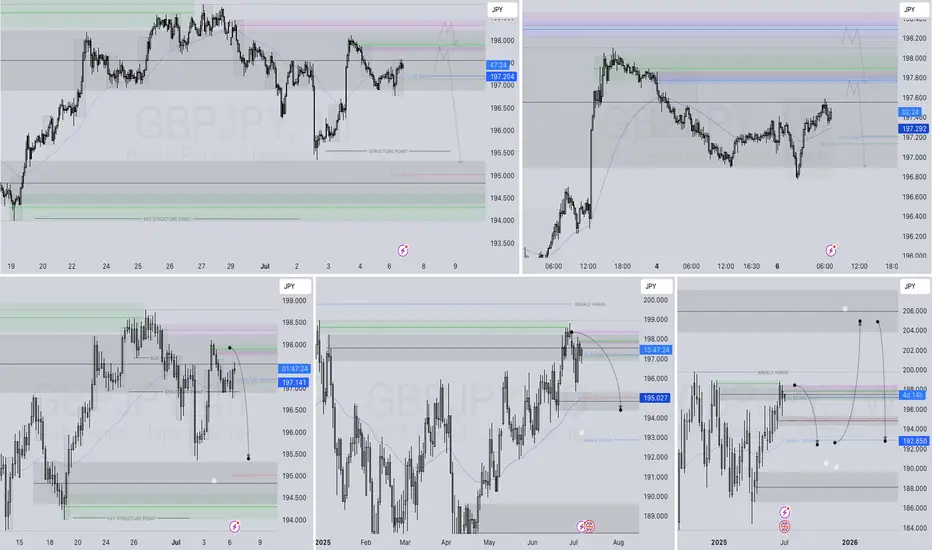
GBPJPY - Multi-Year Short Update! In our last setup for GBPJPY, we identified a massive diagonal pattern, with price completing wave 4 and preparing for a multi-year drop into wave 5.
Since then, price has played out exactly as forecasted — we've seen a clean impulse lower for wave 1, followed by an ABC correction for wave 2, which looks to have now completed.
This sets the stage for the next major leg — wave 3 of 5 — which historically carries the most power and momentum.
📉 See monthly chart here:
📊 GBP/JPY Wave‑3 Trade Idea
Background:
We’ve completed wave 1 down and wave 2 up (ABC correction).
GBPJPY is now positioned to start a powerful wave 3 down — the most impulsive leg in an Elliott sequence.
🔍 Current Price Action:
Price is rejecting major resistance (previous wave A high + shaded zone)
Structure shows a completed 5-wave move up within C, suggesting exhaustion.
A clean ascending trendline (red) has formed under wave v — a break here signals the first confirmation.
Option 1 – Aggressive Entry:
- Trigger: Break and close below the red trendline (~198.00–197.80 zone) on the daily.
- Entry: On candle close below trendline
- Stop Loss: Above recent high ~199.80 and then breakeven once we move lower
Option 2 – Conservative Entry (preferred):
- Trigger: Trendline break + correction
- Entry: On bearish confirmation and then a correction to indicate further downside
- Stop Loss: Above recent high ~199.80 and then breakeven once we move lower
Take Profit Levels:
- TP1: 192
- TP2: 180
- TP3: 175
- Final Target: Trail for extended move toward wave (3) lows (could be 10,000+ pips over long term)
🔐 Invalidation:
Daily close back above 200.00 or impulsive rally beyond the pink resistance zone invalidates the short bias in the short term.
✅ Summary:
This is a high-conviction, structure-backed setup with:
- Wave count + Fib confluence
- Bearish structure at key resistance
- Confirmation-based trigger (trendline break + retest)
- Excellent long-term risk-to-reward profile
📂 Previous GBPJPY Setups (Track Record):
📌 Free Setup (Big Picture Outlook) – Multi-Year Shorts Incoming (Wave 4 Completion)
✅ Swing 1 – 1,200 Pips (VIP GBPJPY Long)
✅ Swing 2 – 1,000 Pips (VIP GBPJPY Short)
✅ Swing 3 – 1,100 Pips (VIP GBPJPY Short)
✅ Swing 4 – 700 Pips (VIP GBPJPY Short)

Bearish drop off pullback resistance?USD/JPY has rejected off the resistance level which is a pullback resistance that aligns with the 50% Fibonacci retracement and could drop from this level to our take profit.
Entry: 146.50
Why we like it:
There is a pullback resistance that lines up with the 50% Fibonacci retracement.
Stop loss: 147.17
Why we like it:
There is a pullback resistance.
Take profit: 145.21
Why we like it:
There is a pullback support that aligns with the 50% Fibonacci retracement.
Enjoying your TradingView experience? Review us!
Please be advised that the information presented on TradingView is provided to Vantage (‘Vantage Global Limited’, ‘we’) by a third-party provider (‘Everest Fortune Group’). Please be reminded that you are solely responsible for the trading decisions on your account. There is a very high degree of risk involved in trading. Any information and/or content is intended entirely for research, educational and informational purposes only and does not constitute investment or consultation advice or investment strategy. The information is not tailored to the investment needs of any specific person and therefore does not involve a consideration of any of the investment objectives, financial situation or needs of any viewer that may receive it. Kindly also note that past performance is not a reliable indicator of future results. Actual results may differ materially from those anticipated in forward-looking or past performance statements. We assume no liability as to the accuracy or completeness of any of the information and/or content provided herein and the Company cannot be held responsible for any omission, mistake nor for any loss or damage including without limitation to any loss of profit which may arise from reliance on any information supplied by Everest Fortune Group.

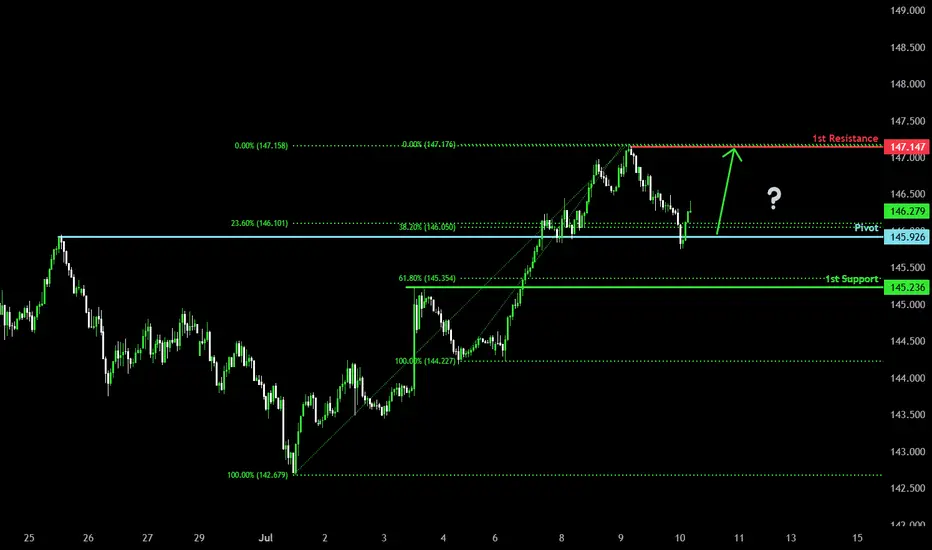
Bullish bounce off major support?USD/JPY has bounced off the pivot and could rise to the pullback resistance.
Pivot: 145.92
1st Support: 145.23
1st Resistance: 147.14
Risk Warning:
Trading Forex and CFDs carries a high level of risk to your capital and you should only trade with money you can afford to lose. Trading Forex and CFDs may not be suitable for all investors, so please ensure that you fully understand the risks involved and seek independent advice if necessary.
Disclaimer:
The above opinions given constitute general market commentary, and do not constitute the opinion or advice of IC Markets or any form of personal or investment advice.
Any opinions, news, research, analyses, prices, other information, or links to third-party sites contained on this website are provided on an "as-is" basis, are intended only to be informative, is not an advice nor a recommendation, nor research, or a record of our trading prices, or an offer of, or solicitation for a transaction in any financial instrument and thus should not be treated as such. The information provided does not involve any specific investment objectives, financial situation and needs of any specific person who may receive it. Please be aware, that past performance is not a reliable indicator of future performance and/or results. Past Performance or Forward-looking scenarios based upon the reasonable beliefs of the third-party provider are not a guarantee of future performance. Actual results may differ materially from those anticipated in forward-looking or past performance statements. IC Markets makes no representation or warranty and assumes no liability as to the accuracy or completeness of the information provided, nor any loss arising from any investment based on a recommendation, forecast or any information supplied by any third-party.
$UJ (USDJPY) 1HPrice tapped into a 4H FVG (gray zone 146.800–146.300), a high-probability reversal zone when paired with liquidity sweep and break of structure.
The bullish internal trendline was cleanly broken, signaling a short-term shift in momentum.
Prior to the drop, price ran buy-side liquidity resting above previous highs (marked $$$), fulfilling liquidity objectives before reversing.
The move into the 4H-FVG occurred in premium territory, ideal for institutional distribution.
As long as price holds below 146.300 (top of the FVG), the bearish leg remains valid.
Next liquidity target is around 145.240, where previous sell-side liquidity (lows marked $$$) is resting.

NZDJPY to find buyers at previous support?NZDJPY - 24h expiry
The primary trend remains bullish.
Short term RSI is moving lower.
Preferred trade is to buy on dips.
Risk/Reward would be poor to call a buy from current levels.
Bespoke support is located at 87.50.
We look to Buy at 87.50 (stop at 87.30)
Our profit targets will be 88.30 and 88.50
Resistance: 88.00 / 88.30 / 88.50
Support: 87.50 / 87.20 / 87.00
Risk Disclaimer
The trade ideas beyond this page are for informational purposes only and do not constitute investment advice or a solicitation to trade. This information is provided by Signal Centre, a third-party unaffiliated with OANDA, and is intended for general circulation only. OANDA does not guarantee the accuracy of this information and assumes no responsibilities for the information provided by the third party. The information does not take into account the specific investment objectives, financial situation, or particular needs of any particular person. You should take into account your specific investment objectives, financial situation, and particular needs before making a commitment to trade, including seeking advice from an independent financial adviser regarding the suitability of the investment, under a separate engagement, as you deem fit.
You accept that you assume all risks in independently viewing the contents and selecting a chosen strategy.
Where the research is distributed in Singapore to a person who is not an Accredited Investor, Expert Investor or an Institutional Investor, Oanda Asia Pacific Pte Ltd (“OAP“) accepts legal responsibility for the contents of the report to such persons only to the extent required by law. Singapore customers should contact OAP at 6579 8289 for matters arising from, or in connection with, the information/research distributed.

Bearish reversal off 78.6% Fibonacci resistance?USD/JPY has rejected off the resistance level that is slightly below the 78.6% Fibonacci retracement and could drop from this level to our take profit.
Entry: 146.60
Why we like it:
There is a resistance level that is slightly below the 78.6% Fibonacci retracement.
Stop loss: 147.95
Why we like it:
There is a pullback resistance level.
Take profit: 145.21
Why we like it:
There is a pullback support that is slightly below the 38.2% Fibonacci retracement.
Enjoying your TradingView experience? Review us!
Please be advised that the information presented on TradingView is provided to Vantage (‘Vantage Global Limited’, ‘we’) by a third-party provider (‘Everest Fortune Group’). Please be reminded that you are solely responsible for the trading decisions on your account. There is a very high degree of risk involved in trading. Any information and/or content is intended entirely for research, educational and informational purposes only and does not constitute investment or consultation advice or investment strategy. The information is not tailored to the investment needs of any specific person and therefore does not involve a consideration of any of the investment objectives, financial situation or needs of any viewer that may receive it. Kindly also note that past performance is not a reliable indicator of future results. Actual results may differ materially from those anticipated in forward-looking or past performance statements. We assume no liability as to the accuracy or completeness of any of the information and/or content provided herein and the Company cannot be held responsible for any omission, mistake nor for any loss or damage including without limitation to any loss of profit which may arise from reliance on any information supplied by Everest Fortune Group.

Bears On The Prowl, Key Supports In FocusAnalysis
USDJPY has faced downward pressure recently and is currently trading below a key resistance level around 152.250. This level acts as a significant barrier to upward movements, and the inability to decisively break above it reinforces our bearish outlook.
Key Observations
🔹 Dominant Bearish Pressure: Despite fluctuations, bulls (buyers) seem to be struggling to maintain higher levels, while bears (sellers) are asserting pressure.
🔹 Key Resistance: The 152.250 level serves as a strong resistance. As long as the price remains below this level, the bearish view will prevail.
🔹 Crucial Supports: The levels of 141.710 and 137.410 are acting as critical support zones for this pair. A break below either of these levels could pave the way for further declines.
🔹 Momentum Indicators: (Here, you can add details about specific indicators that confirm your bearish view. For example: "The RSI is moving towards oversold territory, suggesting continued downside momentum," or "The MACD is showing a bearish crossover, indicating potential for further weakness.")
Potential Scenarios
🔴 Primary Scenario (Bearish): As long as USDJPY remains below the 152.250 resistance, we anticipate continued downward pressure. The bears' initial target will be to test and break the 141.710 support.
🔻 Break of First Support: If the 141.710 support is broken decisively (with strong candles and significant volume), this would be a strong bearish signal. In this scenario, the next target for the price would be to test the lower support at 137.410. A break below this level could lead to even deeper declines.
🟢 Alternative Scenario (Bullish): Should USDJPY manage to decisively break above the 152.250 resistance and sustain itself above it, our bearish view would be temporarily invalidated, and we might see a corrective upward movement. However, until this occurs, the focus remains on the bearish scenario.
Fundamental Considerations
🔘 US-Japan Interest Rate Differential: The significant interest rate differential between the US Federal Reserve and the Bank of Japan continues to be a major factor. Any shift in market expectations regarding the monetary policies of these two central banks could impact USDJPY.
🔘 Bank of Japan (BoJ) Policy: Any signs of a change in the BoJ's ultra-loose monetary policy (e.g., an interest rate hike or a reduction in asset purchases) could strengthen the JPY and put downward pressure on USDJPY.
🔘 US Economic Data: Upcoming US economic data, particularly inflation figures and statements from Federal Reserve officials, could influence the dollar's value and, consequently, USDJPY.
🍀HAVE PROFITABLE TRADES🍻

Smart 15-Min Entry on USDJPY – Clear Plan with 2.33 R/R📢 Hey Guys;
I've placed a buy limit order on USDJPY at a key support level.
🔵 Entry: 145.956
🔴 Stop Loss: 145.743
🟢 Targets:
• TP1: 146.069
• TP2: 146.232
• TP3: 146.468
📐 Risk/Reward Ratio: 2.33
-------
Your likes and support are what keep me motivated to share these analyses consistently.
Huge thanks to everyone who shows love and appreciation! 🙏

GBP/JPY: Total Confluence Targeting 202.05 BreakoutThis is a high-conviction trade setup based on a powerful confluence of fundamental drivers and multi-timeframe technical alignment. We are anticipating a bullish breakout in GBP/JPY, catalyzed by the upcoming UK GDP data release. The price action has formed a classic "coiled spring" pattern, indicating a significant buildup of energy before a potential move higher.
The analysis is based on pure price action, structure, and macroeconomics. The chart is kept intentionally clean to highlight the strength of the setup itself.
The Fundamental Why 📰
Two core data-driven factors underpin this trade:
1️⃣ Macro Policy Divergence: The primary long-term driver is the stark monetary policy difference between a relatively hawkish Bank of England (BoE), which is still fighting inflation, and an ultra-dovish Bank of Japan (BoJ). This fundamental imbalance creates a natural tailwind for GBP/JPY.
2️⃣ Positive Leading Indicators: Recent economic data from the UK has shown surprising strength. Both the Services and Manufacturing PMIs for June beat expectations, suggesting underlying resilience in the economy. This points to a higher probability of an upside surprise in Friday's GDP figures, which would be the direct catalyst for a breakout.
The Technical Picture 📊
Our confidence comes from a rare "Total Confluence," where every timeframe tells the same bullish story.
The Monthly Chart (Strategic View): Shows a powerful, multi-year uptrend that has decisively broken the critical 8-year resistance from the 2015 highs. The macro trend is undeniably bullish.
The Weekly Chart (The Confirmation): Confirms the uptrend is resuming now after breaking out of a year-long bullish continuation pattern. The "resting" phase appears to be over.
The 4-Hour Chart (The Setup): This is the "coiled spring." Price is consolidating in a very tight range right underneath the key breakout level of 199.45. This shows a lack of sellers and a buildup of buying pressure.
Fibonacci Confluence: Our take profit target is not random. It aligns perfectly with the 1.272 Trend-Based Fibonacci Extension, giving us objective, mathematical confirmation for the target at 202.05.
The Trade Plan ✅
This is a "set and forget" breakout strategy. The order should be placed as a Buy Stop to capture the momentum as it breaks higher.
📉 Asset: GBP/JPY
👉 Entry (Buy Stop): 199.85
⛔️ Stop Loss: 198.75
🎯 Take Profit: 202.05
🧠 Risk/Reward: 1:2
This analysis is for educational purposes. Always conduct your own research and manage your risk appropriately. Good luck.

NZDJPY - bulls are exhausted! Hello TradingView Family / Fellow Traders. This is Richard, also known as theSignalyst.
📈NZDJPY has been overall bullish trading within the rising flat channel marked in blue and it is currently retesting the upper bound of it.
Moreover, the green zone is a strong structure.
🏹 Thus, the highlighted red circle is a strong area to look for sell setups as it is the intersection of the upper blue trendline and green structure.
📚 As per my trading style:
As #NZDJPY is hovering around the red circle zone, I will be looking for bearish reversal setups (like a double top pattern, trendline break , and so on...)
📚 Always follow your trading plan regarding entry, risk management, and trade management.
Good luck!
All Strategies Are Good; If Managed Properly!
~Rich
Disclosure: I am part of Trade Nation's Influencer program and receive a monthly fee for using their TradingView charts in my analysis.

AUDJPY SHORT FORECAST Q3 D8 W28 Y25AUDJPY SHORT FORECAST Q3 D8 W28 Y25
Professional Risk Managers👋
Welcome back to another FRGNT chart update📈
Diving into some Forex setups using predominantly higher time frame order blocks alongside confirmation breaks of structure.
Let’s see what price action is telling us today! 👀
🔑 Remember, to participate in trading comes always with a degree of risk, therefore as professional risk managers it remains vital that we stick to our risk management plan as well as our trading strategies.
📈The rest, we leave to the balance of probabilities.
💡Fail to plan. Plan to fail.
🏆It has always been that simple.
❤️Good luck with your trading journey, I shall see you at the very top.
🎯Trade consistent, FRGNT X

Bearish reversal?USD/JPY is reacting off the pivot and could drop to the 1st support which has been identified as a pullback support.
Pivot: 146.18
1st Support: 145.01
1st Resistance: 147.62
Risk Warning:
Trading Forex and CFDs carries a high level of risk to your capital and you should only trade with money you can afford to lose. Trading Forex and CFDs may not be suitable for all investors, so please ensure that you fully understand the risks involved and seek independent advice if necessary.
Disclaimer:
The above opinions given constitute general market commentary, and do not constitute the opinion or advice of IC Markets or any form of personal or investment advice.
Any opinions, news, research, analyses, prices, other information, or links to third-party sites contained on this website are provided on an "as-is" basis, are intended only to be informative, is not an advice nor a recommendation, nor research, or a record of our trading prices, or an offer of, or solicitation for a transaction in any financial instrument and thus should not be treated as such. The information provided does not involve any specific investment objectives, financial situation and needs of any specific person who may receive it. Please be aware, that past performance is not a reliable indicator of future performance and/or results. Past Performance or Forward-looking scenarios based upon the reasonable beliefs of the third-party provider are not a guarantee of future performance. Actual results may differ materially from those anticipated in forward-looking or past performance statements. IC Markets makes no representation or warranty and assumes no liability as to the accuracy or completeness of the information provided, nor any loss arising from any investment based on a recommendation, forecast or any information supplied by any third-party.

Bearish reversal?USD/JPY is rising towards the resistance level which lines up with 100% Fibonacci projection and also slightly below the 78.6% Fibonacci retracement and could reverse from this level too ur take profit.
Entry: 146.68
Why we like it:
There is a resistance level that lines up with the 100% Fibonacci projection and also slightly below the 78.6% Fibonacci retracement.
Stop loss: 147.95
Why we like it:
There is a swing high resistance.
Take profit: 145.21
Why we like it:
There is a pullback support level.
Enjoying your TradingView experience? Review us!
Please be advised that the information presented on TradingView is provided to Vantage (‘Vantage Global Limited’, ‘we’) by a third-party provider (‘Everest Fortune Group’). Please be reminded that you are solely responsible for the trading decisions on your account. There is a very high degree of risk involved in trading. Any information and/or content is intended entirely for research, educational and informational purposes only and does not constitute investment or consultation advice or investment strategy. The information is not tailored to the investment needs of any specific person and therefore does not involve a consideration of any of the investment objectives, financial situation or needs of any viewer that may receive it. Kindly also note that past performance is not a reliable indicator of future results. Actual results may differ materially from those anticipated in forward-looking or past performance statements. We assume no liability as to the accuracy or completeness of any of the information and/or content provided herein and the Company cannot be held responsible for any omission, mistake nor for any loss or damage including without limitation to any loss of profit which may arise from reliance on any information supplied by Everest Fortune Group.

USDJPY Potential UpsidesHey Traders, in today's trading session we are monitoring USDJPY for a buying opportunity around 144.100 zone, USDJPY is trading in an uptrend and currently is in a correction phase in which it is approaching the trend at 144.100 support and resistance area.
Trade safe, Joe.
GBPJPY SHORT DAILY FORECAST Q3 D7 W28 Y25GBPJPY SHORT DAILY FORECAST Q3 D7 W28 Y25
Professional Risk Managers👋
Welcome back to another FRGNT chart update📈
Diving into some Forex setups using predominantly higher time frame order blocks alongside confirmation breaks of structure.
Let’s see what price action is telling us today! 👀
💡Here are some trade confluences📝
✅Daily Order block identified
✅4H Order Block identified
✅1H Order Block identified
🔑 Remember, to participate in trading comes always with a degree of risk, therefore as professional risk managers it remains vital that we stick to our risk management plan as well as our trading strategies.
📈The rest, we leave to the balance of probabilities.
💡Fail to plan. Plan to fail.
🏆It has always been that simple.
❤️Good luck with your trading journey, I shall see you at the very top.
🎯Trade consistent, FRGNT X
July 7 - 11th: Sell The RIPs, Buy The DIPs! (PART 2)Welcome back to the Weekly Forex Forecast!
This is Part 2 of the FOREX futures outlook for the week of July 7 - 11th.
In this video, we will analyze the following FX markets:
CHF and JPY
Last Friday was a bank holiday, so the price action is discounted. This Monday has no red folders on the calendar, so the environment is set for a day of misdirection. Be careful to take only trades that confirm your directional bias!
USD is still weak, and analyst have determined the FED will put off cutting rates until September. Tariffs wars may start up again July 9th. And Trumps Bill can add 3+ trillion to the debt.
None of this supports the USD!
Look to buy the dips xxx USD, and look to sell the rips vs USD xxx.
Enjoy!
May profits be upon you.
Leave any questions or comments in the comment section.
I appreciate any feedback from my viewers!
Like and/or subscribe if you want more accurate analysis.
Thank you so much!
Disclaimer:
I do not provide personal investment advice and I am not a qualified licensed investment advisor.
All information found here, including any ideas, opinions, views, predictions, forecasts, commentaries, suggestions, expressed or implied herein, are for informational, entertainment or educational purposes only and should not be construed as personal investment advice. While the information provided is believed to be accurate, it may include errors or inaccuracies.
I will not and cannot be held liable for any actions you take as a result of anything you read here.
Conduct your own due diligence, or consult a licensed financial advisor or broker before making any and all investment decisions. Any investments, trades, speculations, or decisions made on the basis of any information found on this channel, expressed or implied herein, are committed at your own risk, financial or otherwise.

GBPJPY Breakout and Potential RetraceHey Traders, in the coming week we are monitoring GBPJPY for a buying opportunity around 196.600 zone, GBPJPY was trading in a downtrend and successfully managed to break it out. Currently is in a correction phase in which it is approaching the retrace area at 196.600 support and resistance zone.
Trade safe, Joe.

NZDJPY is in an ascending triangle?Looking at the technical picture, FX_IDC:NZDJPY is in an ascending triangle formation. According to the TA rules, such patterns tend to break to the upside, but a confirmation break is still needed. Let's dig in.
MARKETSCOM:NZDJPY
Let us know what you think in the comments below.
Thank you.
77.3% of retail investor accounts lose money when trading CFDs with this provider. You should consider whether you understand how CFDs work and whether you can afford to take the high risk of losing your money. Past performance is not necessarily indicative of future results. The value of investments may fall as well as rise and the investor may not get back the amount initially invested. This content is not intended for nor applicable to residents of the UK. Cryptocurrency CFDs and spread bets are restricted in the UK for all retail clients.

EURJPY SHORT DAILY FORECAST Q3 D4 W27 Y25EURJPY SHORT DAILY FORECAST Q3 D4 W27 Y25
Professional Risk Managers👋
Welcome back to another FRGNT chart update📈
Diving into some Forex setups using predominantly higher time frame order blocks alongside confirmation breaks of structure.
Let’s see what price action is telling us today! 👀
💡Here are some trade confluences📝
✅Daily Order block identified
✅4H Order Block identified
✅1H Order Block identified
🔑 Remember, to participate in trading comes always with a degree of risk, therefore as professional risk managers it remains vital that we stick to our risk management plan as well as our trading strategies.
📈The rest, we leave to the balance of probabilities.
💡Fail to plan. Plan to fail.
🏆It has always been that simple.
❤️Good luck with your trading journey, I shall see you at the very top.
🎯Trade consistent, FRGNT X
