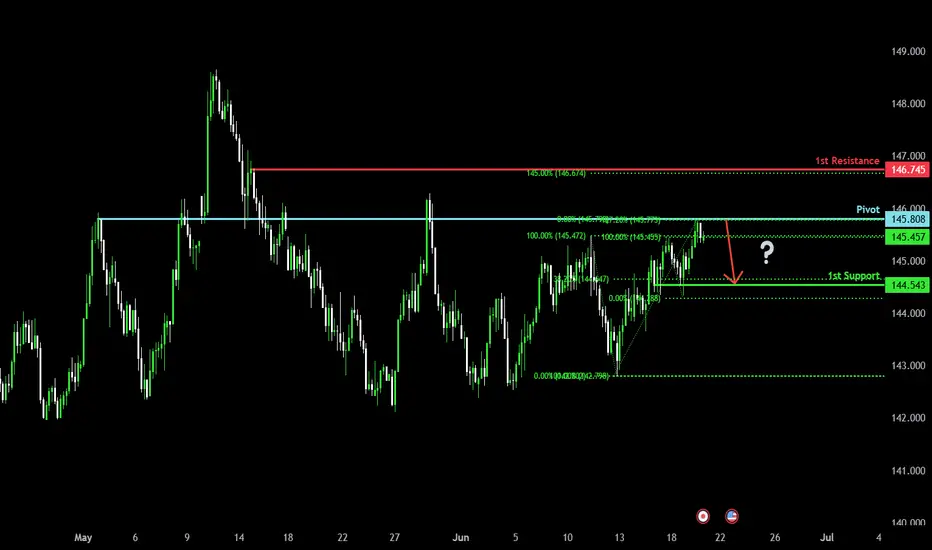
Bearish reversal?USD/JPY has reacted off the pivot and could drop to the 1st support which is a pullback support.
Pivot: 145.80
1st Support: 144.54
1st Resistance: 146.74
Risk Warning:
Trading Forex and CFDs carries a high level of risk to your capital and you should only trade with money you can afford to lose. Trading Forex and CFDs may not be suitable for all investors, so please ensure that you fully understand the risks involved and seek independent advice if necessary.
Disclaimer:
The above opinions given constitute general market commentary, and do not constitute the opinion or advice of IC Markets or any form of personal or investment advice.
Any opinions, news, research, analyses, prices, other information, or links to third-party sites contained on this website are provided on an "as-is" basis, are intended only to be informative, is not an advice nor a recommendation, nor research, or a record of our trading prices, or an offer of, or solicitation for a transaction in any financial instrument and thus should not be treated as such. The information provided does not involve any specific investment objectives, financial situation and needs of any specific person who may receive it. Please be aware, that past performance is not a reliable indicator of future performance and/or results. Past Performance or Forward-looking scenarios based upon the reasonable beliefs of the third-party provider are not a guarantee of future performance. Actual results may differ materially from those anticipated in forward-looking or past performance statements. IC Markets makes no representation or warranty and assumes no liability as to the accuracy or completeness of the information provided, nor any loss arising from any investment based on a recommendation, forecast or any information supplied by any third-party.
Jpy
Major resistance ahead?USD/JPY is rising towards the resistance level, which is a pullback resistance that aligns with the 145% Fibonacci extension and the 61.8% Fibonacci projection. The price could reverse from this level towards our take profit.
Entry: 145.90
Why we like it:
There is a pullback resistance that lines up with the 145% Fibonacci extension and the 61.8% Fibonacci projection.
Stop loss: 146.78
Why we like it:
There is a pullback resistance level that aligns with the 145% Fibonacci extension.
Take profit: 144.62
Why we like it:
There is a pullback. support level.
Enjoying your TradingView experience? Review us!
Please be advised that the information presented on TradingView is provided to Vantage (‘Vantage Global Limited’, ‘we’) by a third-party provider (‘Everest Fortune Group’). Please be reminded that you are solely responsible for the trading decisions on your account. There is a very high degree of risk involved in trading. Any information and/or content is intended entirely for research, educational and informational purposes only and does not constitute investment or consultation advice or investment strategy. The information is not tailored to the investment needs of any specific person and therefore does not involve a consideration of any of the investment objectives, financial situation or needs of any viewer that may receive it. Kindly also note that past performance is not a reliable indicator of future results. Actual results may differ materially from those anticipated in forward-looking or past performance statements. We assume no liability as to the accuracy or completeness of any of the information and/or content provided herein and the Company cannot be held responsible for any omission, mistake nor for any loss or damage including without limitation to any loss of profit which may arise from reliance on any information supplied by Everest Fortune Group.

GBPJPY Potential DownsidesHey Traders, in tomorrow's trading session we are monitoring GBPJPY for a selling opportunity around 195.600 zone, GBPJPY is trading in a downtrend and currently is in a correction phase in which in which it is approaching the trend at 195.600 support and resistance area.
Trade safe, Joe.

USDJPY Potential DownsidesHey Traders, in today's trading session we are monitoringUSDJPY for a selling opportunity around 145.700 zone, USDJPY is trading in a downtrend and currently is in a correction phase in which it is approaching the trend at 145.700 support and resistance area.
Trade safe, Joe.
CHFJPY - Bullish... but not for long!Hello TradingView Family / Fellow Traders. This is Richard, also known as theSignalyst.
📈CHFJPY has been overall bullish trading within the rising channel marked in blue. However, it is currently retesting the upper bound of the channel.
Moreover, the red zone is a strong structure and resistance.
🏹 Thus, the highlighted red circle is a strong area to look for sell setups as it is the intersection of the upper blue trendline and resistance.
📚 As per my trading style:
As #CHFJPY is around the red circle zone, I will be looking for bearish reversal setups (like a double top pattern, trendline break , and so on...)
📚 Always follow your trading plan regarding entry, risk management, and trade management.
Good luck!
All Strategies Are Good; If Managed Properly!
~Rich
Disclosure: I am part of Trade Nation's Influencer program and receive a monthly fee for using their TradingView charts in my analysis.

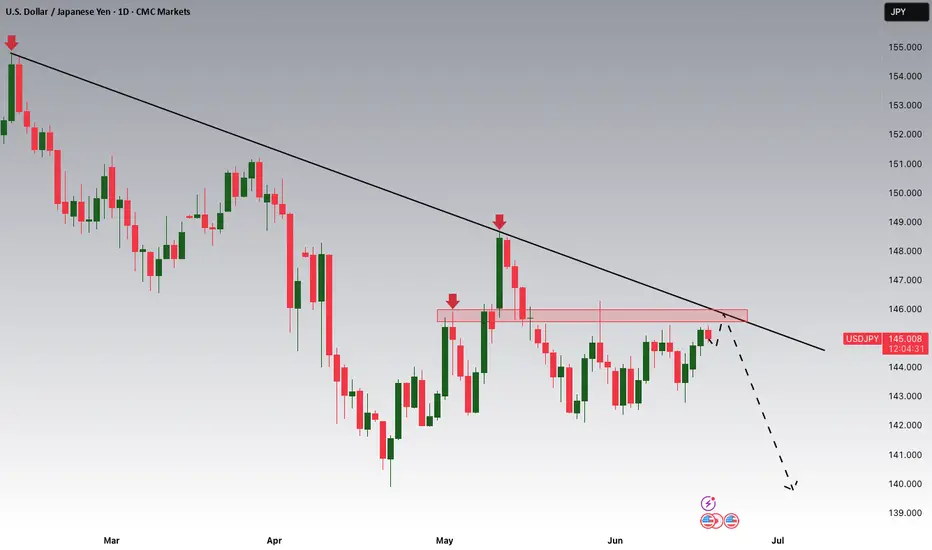
Bearish drop off 61.8% Fibonacci resistance?USD/JPY is rising towards the resistance level that lines up with the 61.8% Fibonacci retracement nds could reverse from this level to our take profit.
Entry: 145.06
Why we like it:
There is an overlap resistance level that lines up with the 61.8% Fibonacci retracement.
Stop loss: 145.45
Why we like it:
There is a pullback resistance level.
Take profit: 144.40
Why we like it:
There is an overlap support level.
Enjoying your TradingView experience? Review us!
Please be advised that the information presented on TradingView is provided to Vantage (‘Vantage Global Limited’, ‘we’) by a third-party provider (‘Everest Fortune Group’). Please be reminded that you are solely responsible for the trading decisions on your account. There is a very high degree of risk involved in trading. Any information and/or content is intended entirely for research, educational and informational purposes only and does not constitute investment or consultation advice or investment strategy. The information is not tailored to the investment needs of any specific person and therefore does not involve a consideration of any of the investment objectives, financial situation or needs of any viewer that may receive it. Kindly also note that past performance is not a reliable indicator of future results. Actual results may differ materially from those anticipated in forward-looking or past performance statements. We assume no liability as to the accuracy or completeness of any of the information and/or content provided herein and the Company cannot be held responsible for any omission, mistake nor for any loss or damage including without limitation to any loss of profit which may arise from reliance on any information supplied by Everest Fortune Group.

EUR/JPY, GBP/JPY, CAD/JPY, CHF/JPY Price Action SetupsWith the conclusion of the FOMC meeting just hours away, I wanted to move away from the US dollar and look at some crosses. Here are some interesting setups on yen pairs to keep in mind.
Matt Simpson, Market Analyst at City Index and Forex.com

Could the price bounce from here?USD/JPY is falling towards the pivot which is an overlap support and could bounce to the 1st resistance which which acts as a pullback resistance.
Pivot: 144.34
1st Support: 142.98
1st Resistance: 146.15
Risk Warning:
Trading Forex and CFDs carries a high level of risk to your capital and you should only trade with money you can afford to lose. Trading Forex and CFDs may not be suitable for all investors, so please ensure that you fully understand the risks involved and seek independent advice if necessary.
Disclaimer:
The above opinions given constitute general market commentary, and do not constitute the opinion or advice of IC Markets or any form of personal or investment advice.
Any opinions, news, research, analyses, prices, other information, or links to third-party sites contained on this website are provided on an "as-is" basis, are intended only to be informative, is not an advice nor a recommendation, nor research, or a record of our trading prices, or an offer of, or solicitation for a transaction in any financial instrument and thus should not be treated as such. The information provided does not involve any specific investment objectives, financial situation and needs of any specific person who may receive it. Please be aware, that past performance is not a reliable indicator of future performance and/or results. Past Performance or Forward-looking scenarios based upon the reasonable beliefs of the third-party provider are not a guarantee of future performance. Actual results may differ materially from those anticipated in forward-looking or past performance statements. IC Markets makes no representation or warranty and assumes no liability as to the accuracy or completeness of the information provided, nor any loss arising from any investment based on a recommendation, forecast or any information supplied by any third-party.

Squeeze in Progress: Will BOJ Trigger the Next Breakout?USDJPY 17/06 – Squeeze in Progress: Will BOJ Trigger the Next Breakout?
The USDJPY pair is currently consolidating just below the key 144.650 resistance, stuck within a tightening triangle structure. As markets await more clarity from both the Bank of Japan (BOJ) and the Fed, price action is showing signs of indecision — but pressure is building.
🌐 Macro & Sentiment Overview
BOJ maintains a neutral stance: Despite growing speculation of a hawkish shift, the BOJ held rates steady, providing no strong forward guidance. Markets remain cautious.
US Dollar remains resilient amid stable bond yields and expectations that the Fed may delay rate cuts, adding short-term support to USDJPY.
Geopolitical risk is on the rise: Ongoing Middle East tensions are fueling safe-haven demand for JPY, capping bullish momentum.
🔍 Technical Setup (M30 Chart)
Price is trapped inside a symmetrical triangle, tightening between 144.652 resistance and 143.126 support.
EMA 13/34/89 are aligned bullishly, but EMA 200 (red) is acting as a dynamic ceiling near 144.300.
Key support zones:
144.071: Minor structural level and trendline test.
143.126: Major liquidity zone and untested demand.
🎯 Trade Scenarios
📉 Scenario 1 – Sell on Rejection at 144.652
Entry: 144.650–144.700
Stop Loss: 145.250
Take Profit: 144.071 → 143.600 → 143.126
Ideal if BOJ shifts tone or USD weakens post-Fed comments.
📈 Scenario 2 – Buy on Bullish Reaction at 143.126
Entry: 143.100–143.150
Stop Loss: 142.700
Take Profit: 143.600 → 144.071 → 144.650 → 145.200
Valid only with clear bullish confirmation on M15–M30 structure.
🧠 Final Thoughts
USDJPY is coiling tightly ahead of a potential breakout. Macro uncertainty from central banks, geopolitical instability, and upcoming CPI data make this week highly volatile. Instead of chasing, let price come to your zones and react accordingly.
🔔 Focus on structure, confirm with price action, and avoid emotional trades. Patience and discipline are key in this compression phase.

Bearish breakout off major support?USD/JPY is reacting off the pivot which acts as an overlap support and a breakout of this level could lead the price to drop to the 1st support.
Pivot: 144.51
1st Support: 143.74
1st Resistance: 145.22
Risk Warning:
Trading Forex and CFDs carries a high level of risk to your capital and you should only trade with money you can afford to lose. Trading Forex and CFDs may not be suitable for all investors, so please ensure that you fully understand the risks involved and seek independent advice if necessary.
Disclaimer:
The above opinions given constitute general market commentary, and do not constitute the opinion or advice of IC Markets or any form of personal or investment advice.
Any opinions, news, research, analyses, prices, other information, or links to third-party sites contained on this website are provided on an "as-is" basis, are intended only to be informative, is not an advice nor a recommendation, nor research, or a record of our trading prices, or an offer of, or solicitation for a transaction in any financial instrument and thus should not be treated as such. The information provided does not involve any specific investment objectives, financial situation and needs of any specific person who may receive it. Please be aware, that past performance is not a reliable indicator of future performance and/or results. Past Performance or Forward-looking scenarios based upon the reasonable beliefs of the third-party provider are not a guarantee of future performance. Actual results may differ materially from those anticipated in forward-looking or past performance statements. IC Markets makes no representation or warranty and assumes no liability as to the accuracy or completeness of the information provided, nor any loss arising from any investment based on a recommendation, forecast or any information supplied by any third-party.

AUD/JPY Bulls Eye 95+ After Bullish ReversalAUD/JPY bounced sharply on Thursday, snapping a 3-day losing streak with a solid bullish-range session. The rally kicked off from a bullish pinbar above 92, where the higher low reinforces support and the broader bullish case.
The 1-hour chart shows a clean breakout from an inverted head and shoulders pattern, pointing to a target around 95.50. With resistance at the April high (95.30), March high (95.75), and the 96 handle, there’s still room for bulls to run.
Dips toward 94 may offer opportunities to join the trend — but a break back below the neckline would shift the tone back to risk-off.
Matt Simpson, Market Analyst at City Index and Forex.com

AUDJPY Potential UpsidesHey Traders, in today's trading session we are monitoring AUDJPY for a buying opportunity around 93.600 zone, AUDJPY is trading in an uptrend and currently is in a correction phase in which it is approaching the trend at 93.600 support and resistance area.
Trade safe, Joe.

AUDJPY SHORT FORECAST Q2 W25 D16 Y25AUDJPY SHORT FORECAST Q2 W25 D16 Y25
Professional Risk Managers👋
Welcome back to another FRGNT chart update📈
Diving into some Forex setups using predominantly higher time frame order blocks alongside confirmation breaks of structure.
Let’s see what price action is telling us today! 👀
💡Here are some trade confluences📝
✅Weekly Order block rejection
✅15' Order block
✅Daily order block identified
🔑 Remember, to participate in trading comes always with a degree of risk, therefore as professional risk managers it remains vital that we stick to our risk management plan as well as our trading strategies.
📈The rest, we leave to the balance of probabilities.
💡Fail to plan. Plan to fail.
🏆It has always been that simple.
❤️Good luck with your trading journey, I shall see you at the very top.
🎯Trade consistent, FRGNT X

Potential bullish reversal?USD/JPY is reacting off the pivot and could rise from this level to the 1st resistance.
Pivot: 143.79
1st Support: 139.64
1st Resistance: 148.91
Risk Warning:
Trading Forex and CFDs carries a high level of risk to your capital and you should only trade with money you can afford to lose. Trading Forex and CFDs may not be suitable for all investors, so please ensure that you fully understand the risks involved and seek independent advice if necessary.
Disclaimer:
The above opinions given constitute general market commentary, and do not constitute the opinion or advice of IC Markets or any form of personal or investment advice.
Any opinions, news, research, analyses, prices, other information, or links to third-party sites contained on this website are provided on an "as-is" basis, are intended only to be informative, is not an advice nor a recommendation, nor research, or a record of our trading prices, or an offer of, or solicitation for a transaction in any financial instrument and thus should not be treated as such. The information provided does not involve any specific investment objectives, financial situation and needs of any specific person who may receive it. Please be aware, that past performance is not a reliable indicator of future performance and/or results. Past Performance or Forward-looking scenarios based upon the reasonable beliefs of the third-party provider are not a guarantee of future performance. Actual results may differ materially from those anticipated in forward-looking or past performance statements. IC Markets makes no representation or warranty and assumes no liability as to the accuracy or completeness of the information provided, nor any loss arising from any investment based on a recommendation, forecast or any information supplied by any third-party.

USD/JPY(20250616)Today's AnalysisMarket news:
Trump: The United States may still intervene in the Iran-Israel conflict. If Iran launches an attack on the United States, the United States will "fight back with all its strength on an unprecedented scale." Iran and Israel should reach an agreement.
Technical analysis:
Today's buying and selling boundaries:
143.79
Support and resistance levels:
145.47
144.84
144.43
143.15
142.74
142.12
Trading strategy:
If the price breaks through 144.43, consider buying in, the first target price is 144.84
If the price breaks through 143.79, consider selling in, the first target price is 143.15

Bullish bounce off 61.8% Fibonacci support?USD/JPY is falling towards the support level which is a pullback support that aligns with the 61.8% Fibonacci retracement and could bounce from this level to our take profit.
Entry: 143.43
Why we like it:
There is a pullback support level that aligns with the 61.8% Fibonacci retracement.
Stop loss: 142.88
Why we like it
There is a pullback support level that lines up with the 61.8% Fibonacci projection.
Take profit: 144.38
Why we like it:
There is an overlap resistance level.
Enjoying your TradingView experience? Review us!
Please be advised that the information presented on TradingView is provided to Vantage (‘Vantage Global Limited’, ‘we’) by a third-party provider (‘Everest Fortune Group’). Please be reminded that you are solely responsible for the trading decisions on your account. There is a very high degree of risk involved in trading. Any information and/or content is intended entirely for research, educational and informational purposes only and does not constitute investment or consultation advice or investment strategy. The information is not tailored to the investment needs of any specific person and therefore does not involve a consideration of any of the investment objectives, financial situation or needs of any viewer that may receive it. Kindly also note that past performance is not a reliable indicator of future results. Actual results may differ materially from those anticipated in forward-looking or past performance statements. We assume no liability as to the accuracy or completeness of any of the information and/or content provided herein and the Company cannot be held responsible for any omission, mistake nor for any loss or damage including without limitation to any loss of profit which may arise from reliance on any information supplied by Everest Fortune Group.

Bearish continuation?USD/CAD has rejected off the resistance level which is a pullback resistance and could drop from this level to our take profit.
Entry: 1.3595
Why we like it:
There is a pullback resistance level.
Stop loss: 1.3644
Why we like it:
There is an overlap resistance level that aligns with the 50% Fibonacci retracement.
Take profit: 1.3545
Why we like it:
There is a support level at the 100% and the 78.6% Fibonacci projection.
Enjoying your TradingView experience? Review us!
Please be advised that the information presented on TradingView is provided to Vantage (‘Vantage Global Limited’, ‘we’) by a third-party provider (‘Everest Fortune Group’). Please be reminded that you are solely responsible for the trading decisions on your account. There is a very high degree of risk involved in trading. Any information and/or content is intended entirely for research, educational and informational purposes only and does not constitute investment or consultation advice or investment strategy. The information is not tailored to the investment needs of any specific person and therefore does not involve a consideration of any of the investment objectives, financial situation or needs of any viewer that may receive it. Kindly also note that past performance is not a reliable indicator of future results. Actual results may differ materially from those anticipated in forward-looking or past performance statements. We assume no liability as to the accuracy or completeness of any of the information and/or content provided herein and the Company cannot be held responsible for any omission, mistake nor for any loss or damage including without limitation to any loss of profit which may arise from reliance on any information supplied by Everest Fortune Group.

USDJPY 1W forecast until September 2025A huge inverted Head&Shoulders has been started. Volatility chop-chop. Left shoulder is ready and the price is heading up to the base at 145.188
In the middle of June we will see a fast fall to print Head bottoming at 138.75
Before printing Right shoulder the price has to visit the base again in the beginning of August 2025
What will happen in September? I will keep posting and updating (if I see necessity) 1W chart here. For 1D weekly updates check 'Also on' in my Profile.

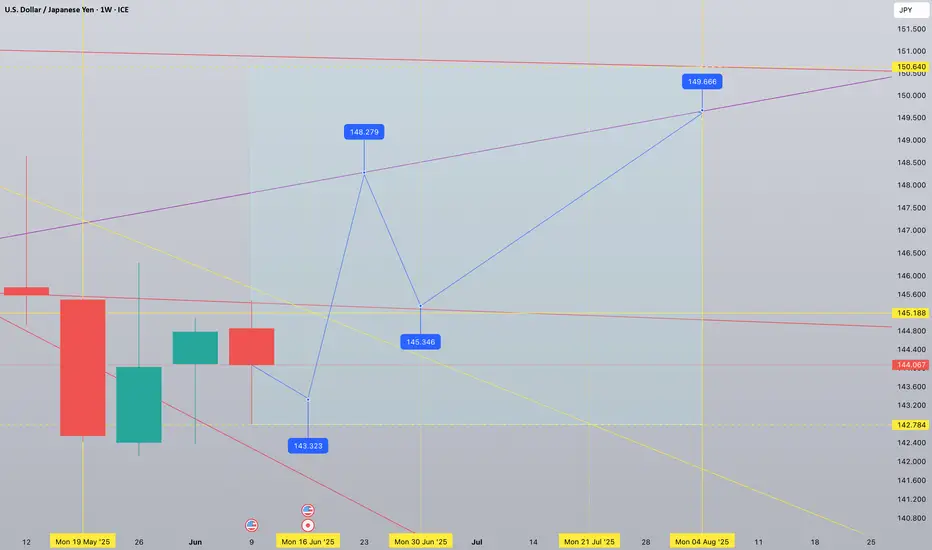
USDJPY 1W tf forecast until August 2025 Current midterm bias is bullish. 150,64 and 142,78 are extreme levels to be respected by the price action. One more week of red week of sideways movement will actually form a reversal pattern followed by a strong upward spike. A powerful breakout to 148,27 is to be retested at 145,34 - healthy retest. July will show an organic growth topping at 149.66 in the beginning of August 2025
GBPJPY Strong rebound. Buy opportunity.The GBPJPY pair has been trading within an Ascending Triangle pattern. Today's geopolitics made the price form its latest Higher Low at the bottom of the pattern, which also coincided with a 4H MA200 (orange trend-line) test, and rebounded.
That was a clear buy signal on the 4H RSI Support that signaled the last three bottom buys. Our Target is the top of the pattern at 196.300.
-------------------------------------------------------------------------------
** Please LIKE 👍, FOLLOW ✅, SHARE 🙌 and COMMENT ✍ if you enjoy this idea! Also share your ideas and charts in the comments section below! This is best way to keep it relevant, support us, keep the content here free and allow the idea to reach as many people as possible. **
-------------------------------------------------------------------------------
Disclosure: I am part of Trade Nation's Influencer program and receive a monthly fee for using their TradingView charts in my analysis.
💸💸💸💸💸💸
👇 👇 👇 👇 👇 👇

USDJPY Strong support formed. Excellent buy opportunity.The USDJPY pair is trading within a Channel Down since the start of the year but following the April 22 Low, it has been rising on Higher Lows. Today that trend-line was tested and again produced a rebound (so far).
Since the April 22 Low was very close to the 139.600 Support (from the September 16 2024 Low), there are higher probabilities that we will have a trend change to bullish, at least for the medium-term.
The natural Resistance now is the 1D MA200 (orange trend-line), so we will target just below it at 148.675 (Resistance 1).
-------------------------------------------------------------------------------
** Please LIKE 👍, FOLLOW ✅, SHARE 🙌 and COMMENT ✍ if you enjoy this idea! Also share your ideas and charts in the comments section below! This is best way to keep it relevant, support us, keep the content here free and allow the idea to reach as many people as possible. **
-------------------------------------------------------------------------------
Disclosure: I am part of Trade Nation's Influencer program and receive a monthly fee for using their TradingView charts in my analysis.
💸💸💸💸💸💸
👇 👇 👇 👇 👇 👇

USD/JPY(20250613)Today's AnalysisMarket news:
The number of initial jobless claims in the United States for the week ending June 7 was 248,000, higher than the expected 240,000, the highest since the week of October 5, 2024. The monthly rate of the core PPI in the United States in May was 0.1%, lower than the expected 0.30%. Traders once again fully priced in the Fed's two interest rate cuts this year.
Technical analysis:
Today's buying and selling boundaries:
143.73
Support and resistance levels:
145.09
144.58
144.25
143.21
142.88
142.37
Trading strategy:
If the price breaks through 143.73, consider buying in, the first target price is 144.25
If the price breaks through 143.21, consider selling in, the first target price is 142.88

GBP/JPY - Triangle Breakout (12.06.2025)The GBP/JPY Pair on the M30 timeframe presents a Potential Selling Opportunity due to a recent Formation of a Triangle Breakout Pattern. This suggests a shift in momentum towards the downside in the coming hours.
Possible Short Trade:
Entry: Consider Entering A Short Position around Trendline Of The Pattern.
Target Levels:
1st Support – 194.34
2nd Support – 193.76
🎁 Please hit the like button and
🎁 Leave a comment to support for My Post !
Your likes and comments are incredibly motivating and will encourage me to share more analysis with you.
Best Regards, KABHI_TA_TRADING
Thank you.
Disclosure: I am part of Trade Nation's Influencer program and receive a monthly fee for using their TradingView charts in my analysis.
