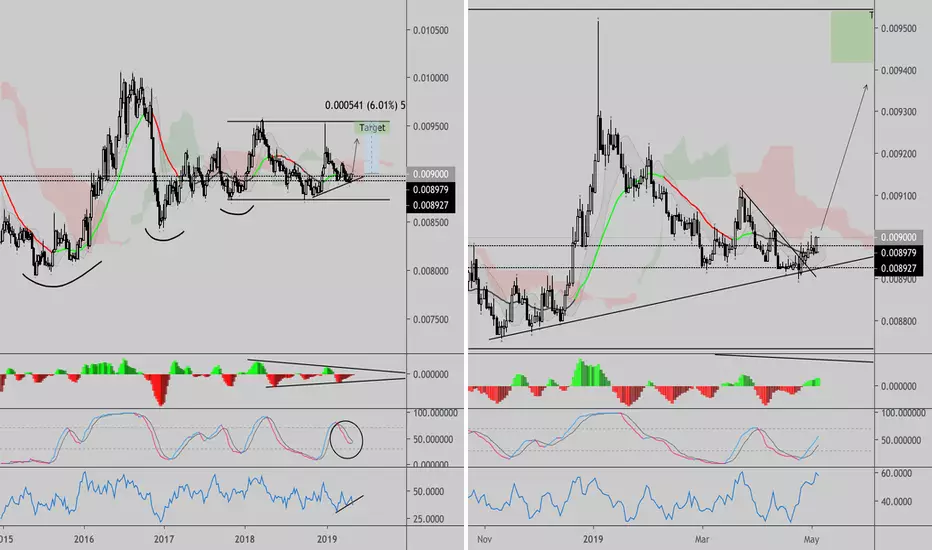
EU on it's bullish trend. Here's a trading plan. Previous Analysis on EU
In my last analysis, I have called EU have made short term top and will correct to the price level where Euro is at right now.
The big idea is though that Euro is on a run and we want to get a piece of it. The current support level could be a solid support to trade on short term.
While I do not recommend committing fully at this level, it's worth to test water and see how it goes.
As I have drawn on this chart, there are multiple way this can go, but the bottom line is support around 1.107 level should not be violated on daily candle.
As long as we keep our chart steady as explained, Euro should remain bullish and its worth a long bet.
One thing to note is that Global Recession could be near done (based on statistics) and we could take current phase as "Weakening Dollar Phase" as dxy has violated
very important support level. My idea on dxy could be found here .
Please note that this is not a TRADING recommendation.
Thank you and you all have good luck with your trading!
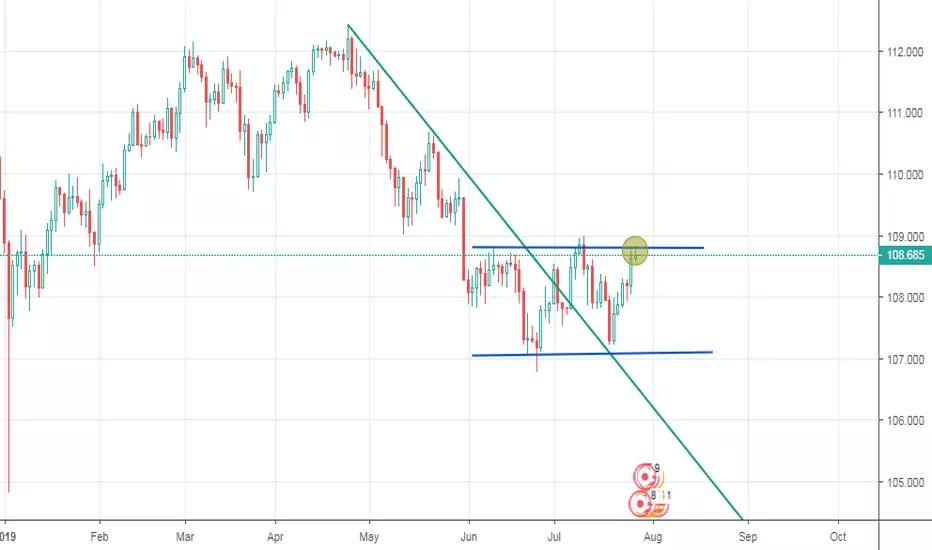
JPYUSD

USDJPY is waiting for a good BULLISH momentumUSDJPY may kiss the key level points at 108, 107.8, 107.5 to gather enough strength to hustle upward upto 109.25 or even higher upto 109.75 level

short goldas shown two triangle converge and give a perfect short opportunity for gold remember money management is key

$EURUSD - Time to open Buy ? WatchingNOTE:
These are just my opinions. My messages or chart analysis are
NOT intended as a recommendation to buy or sell any FX, cryptocurrency or asset.
Do Your Own Research.

USDJPY BEARISH PLAYUSDJPY has given a double rejection on the trendline after the bulls had a go and failed again between the 108.000 & 108.500 range. The bears are in and ready to stay. Looking for shorts in the smaller TF


USDJPY forming bullish butterfly | Upto 12.5% expected.After formation of successful gartley pattern priceline of U.S Dollar / Japanese Yen Forex pair is forming last leg of bullish butterfly soon it will be entered in potential reversal zone.
MACD is still bearish.
I have used Fibonacci sequence to set the targets:
Buy between: 101.950 to 98.515
Sell between: 104.640 to 111.119
Regards,
Atif Akbar (moon333)

test trial 3 pairs eur/usd gbp/usd jpy/usd on usa newstest trial 3 pairs eur/usd gbp/usd jpy/usd on usa news.
The strategy is to go long on the 3 pairs mentioned and wait to be profitable.


A potential double bottom The price is no longer LL. So, we suspect, it could be a potential double bottom. However, it hasn't broken the neckline yet. So, let's wait until the price get above the neckline, and pullback. Otherwise, it could turn into a triple bottom or just continue to go down.
JPYUSD Head And Shoulder 2 patterns are visible in this chart
head and shoulders are clearly visible.
Trend Line is broken.
pullback happened.
Its time to short JPYUSD or long USDJPY.

How to Read Volume Profile StructuresWhat Is Volume Profile?
There are two ways of observing the total volume transactions in any market. As a spot forex trader, you can tap into tick volumes as an accurate visual representation of the total traded volume in the X-axis, which would then make your analysis be based on time.
Alternatively, you can carry out your volume study through the vertical Y-axis, in which case, you are analyzing the total activity based on price levels. It is this latter study what volume profile is about; it’s a histogram of the amounts bought and sold at specific price levels as opposed to specific times.
The volume profile allows any trader to evaluate the market context to keep track of the never-ending auction process. That’s what a market is at the end of the day, a constant negotiating process to find equilibrium/agreement (via the accumulation of transactions at a certain level), and the ones that were perceived too cheap or too expensive (no volume found). The art of reading volume profile is all about studying the anatomy of the market auctions.
Before taking things to the next level, allow me to walk you through some basics. When drawing your volume profile in the chart, you must become intimately familiar with the following values:
1. Point of Control (PoC): It refers to the area in the chart with the most traded volume activity. This is by far the most relevant area you want to monitor as it can help to define the placement of your stops or the areas in the chart where you might find the most pristine entry levels. The highest concentrated area of volume for a particular period of time we will call it PoC or Point of Control and you will be surprised how many times it acts as a wall on a retest. Traders tend to factor this in as an area of support or resistance.
2. High Volume Nodes (HVN): Sub-sequences in the chart with high volume activity. While not as powerful nor symbolic as the PoC, the HVN is also a powerful area as it also represents increased trading activity.
3. Value Area (VA): The range of price levels in which a specified percentage of all volume was traded. By default, the industry standards tends to be 70%. Once I explain the principle of the distribution curve below, it will become much clearer why the default number is the 70%, bear with me.
There are three different types of volume profiles to use in your charts. When you first call the volume profile option through the widely popular charting package trading view, the options include:
Fixed Range
Visible Range
Session Volume (Preferred)
I personally find the combination of the daily price action activity and its respective volume flows at specific price levels the most relevant approach as I will demonstrate in the next paragraphs. The session volume allows you to constantly obtain an update to re-evaluate the market, whereas the assessment of the fixed range or the visible range is more discretionary.
That said, the fixed and visible range options also serve as useful tools depending on the purpose of your analysis, that’s why I will also spend some time going through the most valuable benefits of its use.
Fixed Range: Selection Of Interest Levels A La Carte
Trading the markets, especially if you are an intraday trader, involves constant interaction with your charts. You are constantly looking for areas that you can lean against to take certain actions. Right? This first fixed range option allows you to select any area in the chart to deconstruct the total activity. This is a tool that can be of enormous value if you are looking to tighten or trail your stops as well as spotting areas of most interest to enter your positions.
Let’s say that you wanted to play a short in the EUR/USD 30m chart after the breakout of the range. A fairly conventional strategy would have been to wait for the price to break below the two horizontal support levels and enter short on a retest of either one of them. The next logical question would then be, where would you place your stop? If you are trading conservatively, you’d probably be placing your stop somewhere above the 1.16 in order to leave enough wiggle room in case the rebound returns back into the range.
However, if you think about it, there are other areas in the chart that still make a lot of sense to capitalize on. If you were interested in tightening your stop in such a magnitude that your short trade could exploit the prospects of a much larger risk reward, you could then be tapping into the power of the fixed range volume profile to identify at what price level after the range breakout the highest concentration of volume occurred. You could then use this as an area of relevance to assist your action as a seller. In the example, it may have been a great area to play with a much tighter stop.
There is a multitude of examples I could provide about the usefulness of the fixed range volume profile. However, since I want the core of this tutorial to be about the session volume structures, I’d refrain from further chart illustrations unless you want me to (post comments below). I am sure you can figure out how it could be of benefit to you, depending on your trading style.
Visible Range: The Macro View Of The Market
As the name indicates, the visible range option unpacks as much trading activity as data is in your chart. It portrays the big picture view of the most-traded price levels over a specified period of time.
This option is most suited as part of your daily or weekly analysis to spot areas of interest in the chart. By stepping back and projecting an eagle-view from a macro level, it helps you to easily identify key supports and resistances, which is what I mainly suggest to use the visible range for.
One of the most powerful approaches that I recommend is to select your macro areas of interest by zooming out your charts. Once done, you can start drawing horizontal rectangles at every high volume nodes (in black) or low volume node (in red). The areas highlighted will be by far the most relevant that you want to be paying attention going forward.


Top And Bottom Analysis "USD/JPY" by ThinkingAntsOk4H CHART EXPLANATION:
a)Price has broken the ascending triangle trendline
b)Currently the price is inside a Flag pattern Formation ( this type of patterns are consider continuation structures)
c)The Flag pattern is supported by a major support zone
Based on this, if the price breaks down below 108.000, we expect a continuation of the bearish movement, towards 106.600
MULTI TIMEFRAME VISION:
-Daily:
-Weekly


The unwind is comingJPYUSD broke out today with a huge 1% move to break out of a 4 year long wedge. This is a bit of a technical move, but it has loads of fundamental implications.
Before I go into detail, note that before and during every major market breakdown, JPY spikes, at least in modern times. It has a reputation as a safety currency / safe haven due to this reputation. The reason being that Japan has had extremely low interest rates for a very long time, making it an ideal currency to borrow in, then purchase foreign bonds. IE, a carry trade. The reason it's a safe haven is that when risk starts to occur, traders who have huge positions built up buying foreign fixed income of any variety will sell those positions, and will re-purchase their Yen as they do so.
The problem here is that this can become a bit of a feedback loop. As we see liquidations in these bond positions, this will force more traders to cover, resulting in the Yen rising more and more. This started to occur in 2007 before the financial crisis.. it was actually one of the dominant stories of that era (see www.marketwatch.com) . If only more people knew what this meant for overall financial markets.
US High Yield
One of the biggest risks that has been identified by many people over the past 1-2 years has been the pervasive reach for yield. There has been a significant bubble of corporate debt built up over the past decade, and a lot of it is covenant light, or poorly rated. When the yen rises, corporate debt gets liquidated... Turns out, a significant portion of the buyers of US corporate debt have been asian buyers who's own sovereign bonds are negative yielding. There have been recent stories that many of these purchases have been made un-hedged even...
So long story short, the JPYUSD carry trade can be used to proxy risks to the US corporate debt bubble, and by association, the global reach for yield. This is a trade that can seriously unwind... big potential for negative convexity here in my opinion. IF this continues to break to the upside, it'll cause a lot of issues in markets globally, but watch the high yield space (BDC's, corporate bond etf's, etc).

USD/JPY Short Idea (5/29/19)USD/JPY Short Idea (5/29/19) 1HR Chart
- Looking at a double top off of the 200 EMA and a disturbance level
- DXY is looking like its going to be bearish so then UJ should also follow
- Looking for price to come down to 109.140


"Top and Bottom Analysis" USD/JPY by ThinkingAntsOk4H CHART EXPLANATION:
Main Items we Observe on the Chart:
-Price has broken the ascending trendline.
-Currently, price is inside a corrective structure.
-We expect the triangle Trendline to give some type of Support before the breakout.
Based on this, if the price breaks down the corrective structure below 109.750 we expect a continuation of the bearish movement towards the triangle trendline, after that if price makes a new corrective structure on that area we will look for a 2nd downward movement towards 105.300
MULTI TIMEFRAME VISION:
- Weekly:
-Daily:


JPYUSD looks ready to push higherHigher timeframe confluence long trade.
Weekly currently in a squeeze, momentum turning positive and + a hidden bull div.
Daily showing trendline broken, positive momentum and 36wma support.