PY/USD Analysis: Rising Wedge Bearish Reversal & Short SetupThis chart represents the JPY/USD (Japanese Yen vs. US Dollar) on a daily timeframe (1D), published on April 3, 2025, via TradingView. The price action and technical indicators suggest a bearish outlook based on the formation of a Rising Wedge Pattern, a classic reversal structure signaling potential price depreciation.
1. Chart Structure & Identified Patterns
A. Rising Wedge Formation (Bearish Reversal Pattern)
The price has been moving in an uptrend, forming higher highs (HH) and higher lows (HL).
The two converging black trendlines indicate a rising wedge, a pattern that typically precedes a downside breakout.
A rising wedge is considered a bearish signal, especially when formed after a strong rally.
B. Support and Resistance Levels
Resistance Zone (Highlighted in Beige, Upper Range)
This level represents a historically significant supply area where selling pressure is expected.
Price action shows multiple rejections at this level, indicating the presence of strong resistance.
The red downward arrow further confirms that this level is acting as a cap on price movement.
Support Zone (Highlighted in Beige, Lower Range)
This area previously served as a strong demand level, where buyers stepped in, reversing the price.
The green upward arrow suggests that it played a critical role in the prior bullish move.
C. Key Price Levels
All-Time High (ATH) Marked at ~0.007155
This represents the historical peak price, which serves as a potential long-term resistance.
Stop-Loss Placement (~0.006959)
This is placed above the resistance level to manage risk in case of a false breakout.
Target Level (~0.006178)
Based on the wedge height, this level is calculated as the measured move after a breakdown.
2. Price Action & Market Sentiment
A. Recent Bullish Move
The market has been in a strong uptrend since hitting the support zone.
This move was characterized by higher lows and higher highs, reinforcing bullish momentum.
However, momentum appears to be weakening as the price struggles to break through the resistance.
B. Confirmation of a Bearish Reversal
The price has touched the upper resistance zone multiple times but failed to break through.
The trendline breakdown (expected move) suggests sellers are stepping in.
A lower high formation is seen as an early warning of a reversal.
3. Trade Setup: Short Position Strategy
This setup aligns with the principles of technical analysis, utilizing the Rising Wedge as a bearish reversal pattern.
A. Entry Strategy
Sell Entry Trigger: Enter a short trade upon a confirmed breakdown below the lower trendline.
Retest Confirmation: Ideally, wait for a pullback to the broken trendline before shorting to avoid false signals.
B. Risk Management
Stop-Loss Placement: Above the resistance zone at 0.006959, to protect against an invalidation.
Take-Profit Target: Set at 0.006178, calculated based on the wedge’s height projection.
C. Reward-to-Risk Ratio (RRR)
RRR = 2:1 or higher
The target level offers a risk-reward ratio that justifies the trade setup.
4. Summary & Final Outlook
Bearish Signals:
✅ Rising Wedge Pattern – A strong reversal indicator.
✅ Lower Highs and Weak Momentum – Suggests selling pressure.
✅ Failure to Break Resistance – Indicates bullish exhaustion.
✅ Projected Target Based on Wedge – Price expected to reach 0.006178.
Neutral Considerations:
If price does not break the lower trendline, the pattern is not validated.
If a false breakdown occurs, prices may briefly recover before falling.
Bullish Invalidation:
If the price breaks above 0.006959 and sustains above resistance, the bearish setup is invalidated.
Final Verdict:
📉 Bearish Bias – The market setup favors a downside move upon a confirmed breakdown.
🎯 Target: 0.006178 (Key support level).
⚠️ Risk: If the price does not break lower, consolidation may occur before a clearer move.
JPYUSD

JPY/USD: Bearish Triangle Pattern Breakout Towards TargetChart Pattern: Triangle Pattern
Pattern Description
Type: The chart identifies a Triangle Pattern, which is a type of consolidation pattern that can act as either a continuation or reversal pattern depending on the preceding trend and the breakout direction. Triangles are characterized by converging trendlines, indicating a period of indecision in the market as the price range narrows.
Specific Type: This appears to be a Symmetrical Triangle, as the upper and lower trendlines converge at a similar angle, suggesting neither buyers nor sellers have clear control during the consolidation phase.
Appearance on the Chart:
The Triangle Pattern is marked with two converging trendlines:
Upper Trendline (Resistance): Connects the lower highs, sloping downward.
Lower Trendline (Support): Connects the higher lows, sloping upward.
The pattern began forming around March 27, after a sharp downtrend, and continued until the breakout on April 2, 2025.
Breakout Direction:
Symmetrical Triangles can break out in either direction, but they often continue the preceding trend. In this case, the preceding trend was bearish (a sharp decline from 0.006720 to 0.006640), and the breakout is to the downside, confirming a bearish continuation.
The chart shows the price breaking below the lower trendline of the triangle around April 2, 2025, with a strong bearish candle, indicating a confirmed bearish breakout.
Key Levels and Trading Setup
1. Support Level
A horizontal support zone is marked around 0.006640 (approximately 0.00664–0.00665).
This level acted as a base during the triangle formation, with the price bouncing off this zone multiple times (e.g., on March 28 and March 31).
The price has now broken below this support, turning it into a resistance level on any potential retest.
2. Resistance Level
A resistance zone is marked around 0.006705 (approximately 0.00670–0.00671).
This level corresponds to a previous high within the triangle and aligns with the upper boundary of the triangle at the time of the breakout.
After the breakout, this resistance level is where the stop loss is placed, as a move back above this level would invalidate the bearish setup.
3. Target
The target for the breakout is projected at 0.006599 (approximately 0.00660).
This target is likely calculated by measuring the height of the triangle at its widest point (from the highest high to the lowest low within the pattern) and projecting that distance downward from the breakout point.
The chart indicates a potential move of -0.000604 (-0.96%), which aligns with the distance from the breakout level (around 0.006654) to the target (0.006599).
4. Stop Loss
A stop loss is suggested above the resistance level at 0.006705.
This placement ensures that if the breakout fails and the price moves back above the triangle’s lower trendline (now acting as resistance), the trade is exited with a manageable loss.
Trading Setup Summary
Entry:
The setup suggests entering a short (sell) position after the price breaks below the lower trendline of the Triangle Pattern, which occurred around April 2, 2025. The breakout is confirmed by a strong bearish candle closing below the trendline at approximately 0.006654.
Stop Loss:
Place a stop loss above the resistance level at 0.006705 to protect against a false breakout or reversal. The distance from the breakout level (0.006654) to the stop loss (0.006705) is 0.000051, representing the risk on the trade.
Take Profit/Target:
Aim for the target at 0.006599, which is the projected price objective based on the triangle’s height. The distance from the breakout level to the target is 0.000055, or a 0.96% move.
Risk-Reward Ratio:
The risk is 0.000051 (from 0.006654 to 0.006705), and the reward is 0.000055 (from 0.006654 to 0.006599), giving a risk-reward ratio of approximately 1:1.08 (0.000055 / 0.000051). While this ratio is slightly above 1:1, it’s on the lower side for a typical trading setup, so traders should ensure high confidence in the breakout.
Additional Observations
Price Action Context:
Before the triangle formed, the price experienced a sharp decline from 0.006720 (March 23) to 0.006640 (March 27), indicating a strong bearish trend.
The triangle represents a consolidation phase within this downtrend, and the downside breakout suggests a continuation of the bearish momentum.
Volume and Momentum:
The chart doesn’t display volume or momentum indicators (e.g., RSI, MACD). However, a typical confirmation of a triangle breakout would include:
An increase in volume on the breakout candle, indicating strong selling pressure.
Bearish momentum signals, such as an RSI below 50 or a bearish MACD crossover.
Traders might want to check these indicators for additional confirmation of the breakout’s strength.
Timeframe:
This is a 1-hour chart, so the setup is intended for short-term trading, with the target potentially being reached within a few hours to a day.
Market Context:
USD/JPY is influenced by factors like U.S. dollar strength, Japanese yen safe-haven demand, and interest rate differentials. A bearish move in USD/JPY could be driven by a stronger yen (e.g., due to risk-off sentiment) or a weaker dollar (e.g., due to dovish U.S. economic data).
Conclusion
The TradingView idea presents a bearish setup for USD/JPY based on a Symmetrical Triangle Pattern on the 1-hour chart. The price has broken below the triangle’s lower trendline, confirming a bearish continuation with a target of 0.006599. The setup includes a stop loss at 0.006705 to manage risk, offering a risk-reward ratio of approximately 1:1.08. Key levels to watch include the former support (now resistance) at 0.006640 and the resistance at 0.006705. Traders should consider additional confirmation from volume and momentum indicators, as well as broader market conditions, before executing the trade. Since this chart is from April 2, 2025, market conditions may have evolved, and I can assist with searching for more recent data if needed!

Triangle Breakout in JPY/USD – Bullish Move Ahead?This TradingView chart represents a detailed technical analysis setup for the Japanese Yen (JPY) against the U.S. Dollar (USD). The main focus of the chart is a symmetrical triangle pattern breakout, a common formation that signals potential price movement.
In this detailed breakdown, we will analyze the following aspects:
Technical Pattern: Symmetrical Triangle Formation
Support and Resistance Levels
Breakout Confirmation
Trading Setup Explanation
Risk Management Strategy
Market Expectations (Bullish & Bearish Scenarios)
Conclusion & Trading Plan
1. Technical Pattern: Symmetrical Triangle Formation
The chart showcases a symmetrical triangle, which is a continuation pattern that typically occurs in trending markets. It indicates a period of consolidation where buyers and sellers struggle for dominance, leading to an eventual breakout.
Characteristics of the Symmetrical Triangle in This Chart:
Converging Trendlines:
The upper trendline (resistance) is sloping downward, showing lower highs.
The lower trendline (support) is sloping upward, showing higher lows.
Apex Formation:
As the price moves closer to the triangle's apex, volatility decreases, creating a squeeze effect.
Breakout Possibility:
Once price reaches a critical point, a breakout is expected in either direction.
Why is This Pattern Important?
Symmetrical triangles suggest that the market is indecisive, but once a breakout occurs, it can trigger a strong price movement.
Traders wait for the breakout direction to confirm the trade before entering a position.
2. Key Support and Resistance Levels
Support and resistance levels are crucial for identifying potential entry, stop-loss, and target areas.
Resistance Level:
A horizontal resistance zone (highlighted in beige) is drawn at the top.
This zone represents historical price rejection levels, where sellers have previously stepped in.
A confirmed breakout above this level would indicate strong bullish momentum.
Support Level:
The lower support zone (marked in blue) acts as a buying interest area.
Price has bounced off this zone multiple times, confirming it as a strong support level.
A break below this zone would signal a bearish reversal.
Trendline Support:
The lower boundary of the symmetrical triangle also acts as dynamic support.
If price respects this trendline, it suggests bullish strength leading to a breakout.
3. Breakout Confirmation & Market Reaction
The most important part of the setup is the breakout, which occurs when the price successfully moves beyond the triangle's trendline resistance.
Key Observations from the Chart:
Breakout Zone:
The breakout occurs near the right edge of the triangle (circled in red).
The price breaks above the upper trendline, confirming a bullish breakout.
Confirmation Candle:
A bullish candle follows the breakout, confirming buying pressure.
Traders should wait for a retest of the trendline before entering.
Volume Consideration:
Strong breakout moves are typically accompanied by a rise in volume, increasing the likelihood of follow-through.
4. Trading Setup Explanation
This trade follows a trend-following breakout strategy, where traders capitalize on price momentum after confirmation.
Entry Point:
The ideal entry is just above the breakout candle.
Traders can also wait for a retest of the broken trendline before entering.
Stop Loss Placement:
The stop loss is placed slightly below the previous swing low at 0.006652.
This prevents excessive drawdowns in case of a false breakout.
Profit Target Calculation:
The profit target is set at 0.006795, which is calculated based on:
The height of the triangle formation projected from the breakout point.
The next major resistance level, aligning with historical price action.
5. Risk Management Strategy
Risk management is a critical component of any trading strategy. Here’s how it is applied in this setup:
Risk-to-Reward Ratio (RRR):
A good trade setup maintains an RRR of at least 2:1.
If the stop loss is 33 pips (0.000033) and the target is 112 pips (0.000112), the RRR is 3:1, making this a high-probability trade.
Position Sizing Consideration:
Risk per trade should be limited to 1-2% of the total account balance.
Leverage should be used cautiously, as breakouts can sometimes retest the breakout zone before continuing.
6. Market Expectations (Bullish & Bearish Scenarios)
Bullish Scenario (Successful Breakout):
✅ If price sustains above the breakout level, it will likely continue to rally toward the target at 0.006795.
✅ A strong bullish momentum candle would confirm further buying pressure.
✅ If volume supports the breakout, trend continuation is highly probable.
Bearish Scenario (False Breakout or Reversal):
❌ If price falls back inside the triangle, it indicates a false breakout.
❌ If price closes below 0.006652, bears take control, and price may drop further.
❌ A breakdown below the support level would shift the market sentiment bearish.
7. Conclusion & Trading Plan
This chart presents a classic symmetrical triangle breakout trade with a clear entry, stop-loss, and target strategy.
Summary of Trading Plan:
Component Details
Pattern Symmetrical Triangle
Breakout Direction Bullish
Entry Point Above the breakout confirmation candle
Stop Loss 0.006652 (below support)
Take Profit (Target) 0.006795
Risk-to-Reward Ratio Favorable (3:1)
Market Bias Bullish (if price sustains above breakout)
Final Considerations:
Always wait for confirmation before entering.
Monitor volume and price action for additional validation.
Stick to the risk management plan to minimize losses.
If executed correctly, this setup offers a high-probability trade with a strong risk-to-reward ratio, making it a profitable trading opportunity in the JPY/USD market.

JPY/USD 4H Chart Analysis – Head & Shoulders Breakdown & BearishThis detailed technical analysis covers a Head & Shoulders pattern formation on the 4-hour chart of JPY/USD, highlighting a potential bearish reversal setup. The pattern suggests a shift from an uptrend to a downtrend, supported by a trendline breakdown and key resistance & support levels.
1️⃣ Understanding the Chart Pattern: Head & Shoulders (H&S)
📉 What is the Head & Shoulders Pattern?
The Head & Shoulders (H&S) is a classic bearish reversal pattern that appears after a prolonged uptrend, signaling a shift in market sentiment from bullish to bearish. It consists of three main parts:
Left Shoulder: A peak followed by a retracement.
Head: A higher peak, indicating the last strong bullish attempt.
Right Shoulder: A lower peak, failing to reach the height of the head, showing weakening momentum.
Neckline: A crucial support level that connects the lows of the shoulders. A confirmed break below this neckline is the trigger for a bearish continuation.
📊 Breakdown of the Pattern in This Chart
Left Shoulder (First Peak): The price made a high and then pulled back.
Head (Higher Peak): The market made another higher high but failed to sustain it, indicating exhaustion.
Right Shoulder (Lower Peak): A weaker attempt to push higher, but price failed to break previous highs, confirming the loss of bullish strength.
Neckline Breakout: The dotted trendline shows the ascending support that was eventually broken, confirming bearish momentum.
2️⃣ Key Technical Levels & Market Structure
Understanding the important levels in the market is crucial for setting up an effective trade.
🟧 Resistance Zone (Supply Area)
The resistance level, marked in a beige box, is located around 0.006800.
Price was rejected multiple times from this zone, confirming strong selling pressure.
The head of the pattern was formed in this region before a sharp drop.
🔵 Support Level (Neckline & Demand Area)
The neckline of the Head & Shoulders pattern was acting as support before being broken.
This level was tested multiple times before the final breakdown.
Once broken, it turned into a resistance level, meaning price may pull back to this area before continuing downward.
📉 Trendline Breakout (Bearish Confirmation)
A dashed trendline was previously supporting the uptrend but was broken, confirming the bearish shift in market structure.
This signals a trend reversal and a possible extended move lower.
3️⃣ Trading Strategy & Execution
A well-planned entry, stop loss, and take-profit strategy is essential for managing risk effectively.
📌 Entry Strategy (Short Setup)
Ideal Entry: Look for price to pull back to the neckline (previous support turned resistance).
Confirmation: Watch for bearish candlestick patterns such as:
Bearish engulfing
Pin bar rejection
Shooting star
Lower highs forming near the neckline
A rejection in this zone confirms seller dominance and a high-probability short setup.
📌 Stop Loss Placement
The Stop Loss is placed above the right shoulder at 0.006725.
This ensures protection from false breakouts or unexpected bullish moves.
📌 Profit Target Projection
Take-Profit Target: The projected move suggests a target at 0.006493.
This aligns with previous structural support, increasing its significance.
The measured move for Head & Shoulders suggests that price could fall further after confirmation.
Risk-Reward Ratio
The Risk (Stop Loss): Around 50 pips.
The Reward (Profit Target): Around 180 pips.
This results in a Risk-Reward Ratio of approximately 1:3, making it an attractive trade.
4️⃣ Market Sentiment & Expected Price Movement
📉 Bearish Scenario (Most Likely)
Price retests the neckline but fails to break above it.
Sellers step in, rejecting the resistance level, leading to further downside.
Price targets the next major support at 0.006493, completing the Head & Shoulders move.
📈 Bullish Scenario (Alternative)
If price reclaims the neckline and moves back above 0.006725, the pattern is invalidated.
This could lead to a bullish continuation back toward previous highs.
In this case, traders should cut losses early and avoid forcing a short trade.
5️⃣ Risk Management & Best Practices
1️⃣ Position Sizing:
Risk only 1-2% of your account per trade to maintain long-term profitability.
2️⃣ Confirmation Before Entry:
Wait for price to reject the neckline resistance before entering short.
Avoid entering too early without clear bearish signs.
3️⃣ Monitor News & Fundamentals:
Major economic events, interest rate decisions, or central bank announcements could impact JPY/USD price action.
🔎 Final Conclusion: Bearish Outlook on JPY/USD
The Head & Shoulders breakdown signals a trend reversal from bullish to bearish.
The neckline breakout confirms seller control over the market.
The best short entry is on a pullback to previous support (now resistance).
Target at 0.006493, with a Stop Loss at 0.006725 ensures controlled risk.
📢 Trading Bias: Bearish 📉
💡 Watch for a retest & rejection before entering short.

JPY/USD Weekly Forecast – Falling Wedge Breakout & Bullish MoveChart Overview
This chart presents a technical analysis of the Japanese Yen (JPY) against the U.S. Dollar (USD) on a daily timeframe, published on TradingView. The setup is based on a Falling Wedge pattern, which has led to a bullish breakout, signaling a potential price rally. Let's break it down step by step.
1️⃣ Identifying the Pattern – Falling Wedge Formation
The primary pattern identified in the chart is a Falling Wedge, which is a well-known bullish reversal pattern.
Characteristics of the Falling Wedge in this Chart:
Two downward-sloping trendlines (black lines) forming a wedge shape.
Price makes lower highs and lower lows, but the distance between highs and lows gradually narrows.
The breakout occurs when price closes above the upper trendline, confirming a potential uptrend.
Key Observations:
✅ The pattern starts forming around September 2024 and continues until December 2024.
✅ A breakout occurs at the end of December 2024, confirming bullish momentum.
✅ After breaking out, the price retests the wedge's upper boundary, acting as new support before continuing upward.
2️⃣ Support & Resistance Zones – Key Price Levels
Support Level:
The support zone is marked in a beige rectangle at the bottom of the chart.
This is where buyers repeatedly stepped in, preventing further decline.
The price touched this area multiple times before reversing upwards, making it a strong demand zone.
Resistance Level:
The resistance zone is identified at the top of the chart (shaded beige area).
This level represents previous price peaks, where selling pressure was strong.
The price is expected to face some resistance when approaching this zone.
3️⃣ Trend Reversal Confirmation & Bullish Structure
After breaking out of the falling wedge, the price has started forming higher highs and higher lows, indicating an uptrend.
Key Trend Indicators:
✔ Curved blue dashed line suggests an upward trajectory, confirming a rounded bottom reversal.
✔ Price is following a trendline support, validating bullish sentiment.
✔ Momentum is strong, and buyers are in control after the breakout.
4️⃣ Trading Setup – Entry, Stop Loss & Take Profit
This analysis is structured into a trading plan with clear risk management.
📌 Entry Point (Buy Confirmation)
Entry is ideal on a retest of the breakout zone or a continuation of the bullish structure.
The recent higher low serves as a great point to confirm trend continuation.
📌 Stop-Loss Placement
Stop-loss is placed at 0.006465 (marked in blue), below the latest support.
This level ensures protection against false breakouts.
📌 Take Profit Target
The target is set at 0.007128, aligning with historical resistance.
If momentum remains strong, the price might push even higher.
5️⃣ Risk-to-Reward Ratio (RRR) & Trade Justification
Risk-to-Reward Analysis:
Stop-Loss: 0.006465 (below support)
Entry Price: Around 0.006671
Target Price: 0.007128
Risk-to-Reward Ratio: Approximately 1:2.5, meaning for every $1 risked, there's a $2.5 potential gain.
Trade Justification:
✔ Falling Wedge breakout is confirmed.
✔ Retest of broken resistance turned support gives an ideal entry.
✔ Bullish trend structure supports the upside move.
✔ Well-defined stop-loss and take-profit levels provide controlled risk exposure.
6️⃣ Final Thoughts & Conclusion
📌 This is a textbook bullish setup based on a Falling Wedge breakout. The combination of pattern breakout, trend structure, and strong support makes this a high-probability trade.
📌 Potential Risks to Watch:
If price fails to hold above stop-loss, it could indicate bullish weakness.
Major macroeconomic news or fundamental events can shift momentum.
📌 Overall Bias: ✅ Bullish towards the 0.007128 target, as long as the price remains above key support zones.

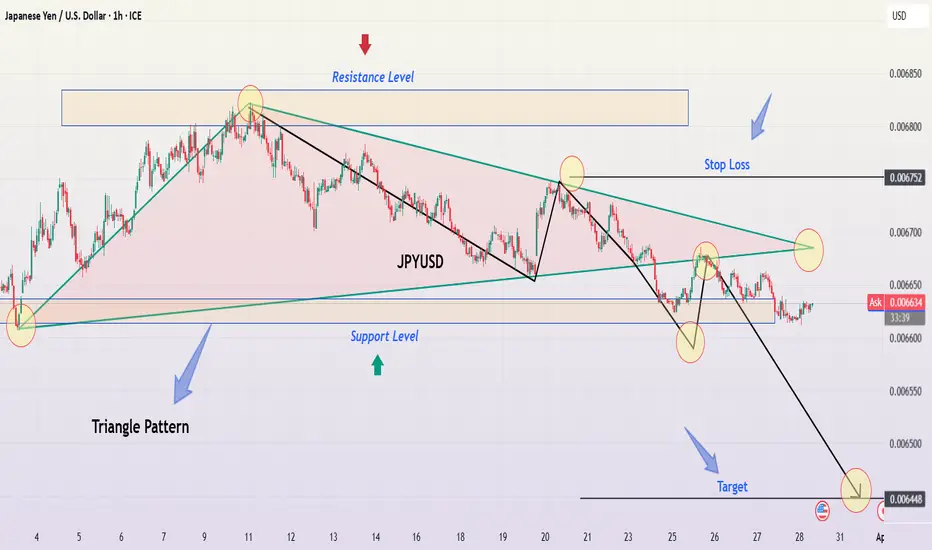
JPY/USD Descending Triangle Breakdown – Bearish Trading Setup📌 Overview: Understanding the Current Market Structure
This analysis focuses on the JPY/USD pair on the 1-hour timeframe, highlighting a well-defined descending triangle pattern, a classic bearish continuation setup. The price action indicates selling pressure increasing as lower highs form, while support remained relatively stable before ultimately breaking down.
This setup suggests a potential trend continuation to the downside, making it a compelling trade opportunity for short-sellers. Let's dive deeper into the technical breakdown, trading strategy, and market expectations.
📊 Technical Breakdown: Chart Pattern Analysis
1️⃣ The Descending Triangle Pattern: A Bearish Signal
The descending triangle is one of the most reliable continuation patterns in technical analysis, often leading to a breakdown when support is breached. This chart confirms the pattern through:
✅ Downward Sloping Resistance Line:
The price tested this level multiple times but was consistently rejected.
Lower highs indicate sellers are dominating and buyers are failing to push higher.
✅ Flat Support Level:
The price found strong support at a key horizontal level, bouncing off multiple times.
However, each bounce became weaker, signaling buyers losing strength.
✅ Breakout & Confirmation:
The final breakdown below support occurred with strong momentum.
The price has now turned previous support into resistance, a bearish confirmation.
🔎 Implication:
A descending triangle breakout to the downside often results in an extended downward move, aiming for the measured move target based on the triangle’s height.
2️⃣ Key Price Levels & Trading Zones
📌 🔴 Resistance Zone (Upper Triangle Boundary):
0.006700 – 0.006750
This level acted as a strong rejection zone, confirming lower highs.
It now serves as a resistance level after the breakdown.
📌 🟢 Support Level (Triangle Base):
This level previously held price from breaking lower multiple times.
However, with each bounce becoming weaker, it finally gave way.
Break & Close below this level confirms the bearish continuation.
📌 🎯 Target Projection (Based on Triangle Breakout):
0.006448 (Final Target) – This level aligns with historical price action and the triangle’s projected move.
📌 🚨 Stop Loss Placement:
Above the last swing high (~0.006752)
If price reclaims this zone, the bearish outlook becomes invalid.
📈 Price Action & Market Sentiment
3️⃣ Bearish Momentum & Breakdown Confirmation
✅ Lower Highs Indicate Weakness:
Buyers attempted multiple recoveries but were consistently rejected at lower levels.
This pattern suggests exhaustion in buying pressure.
✅ Breakout Candle Strength & Volume Confirmation:
The price broke support with strong momentum and increased volume, confirming sellers’ control.
A breakdown without volume is often a fakeout, but this chart shows clear momentum.
✅ Potential Retest Before Further Drop:
After a breakdown, price often retests the broken support before continuing lower.
A pullback to the resistance zone (~0.006650 - 0.006700) could offer an ideal short entry.
✅ Bearish Trend Confirmation:
The price remains below key resistance and continues forming lower lows.
The downtrend structure remains intact, reinforcing the bearish sentiment.
📉 Trading Strategy: How to Trade This Setup?
🔹 Entry Strategy:
Ideal Entry: Short after a pullback to broken support (~0.006650 - 0.006700).
Aggressive Entry: Short immediately on the breakdown if momentum remains strong.
🔹 Stop Loss Placement:
Place above last swing high (0.006752) to avoid being stopped out by noise.
Ensures protection against sudden bullish reversals or fakeouts.
🔹 Take Profit Targets:
✅ First Target: 0.006500 (Psychological level)
✅ Final Target: 0.006448 (Triangle measured move)
🔹 Risk Management:
Use a Risk-to-Reward ratio (RRR) of at least 1:2 for an optimal trade setup.
Never risk more than 2% of total capital per trade.
⚠️ Market Outlook & Key Watchpoints
📌 Scenario 1: Bearish Continuation (High Probability)
If price retests the broken support and faces rejection, expect further downside.
Target remains at 0.006448.
📌 Scenario 2: Fake Breakdown & Bullish Reversal (Low Probability)
If price closes above 0.006750, it invalidates the bearish setup.
In that case, a bullish move towards 0.006800+ is possible.
📢 Final Thoughts:
The bearish breakout is clear, but waiting for a proper pullback before entry is ideal.
Volume confirmation is crucial to avoid fakeouts.
If support turns into resistance, a high-probability short trade is set up.
🔹 What’s your take on this setup? Will JPY/USD reach its target? Drop your thoughts below! 🚀
#JPYUSD #ForexTrading #TechnicalAnalysis #PriceAction
JPY/USD - Will we make a strong bounce?The JPY/USD is in a downward channel. Will it find support around 0.006 and rebound, or will it break below this key level?
The pair has nearly reached a major support zone—an area where buyers have previously shown strong interest. This level has historically acted as both strong resistance and support, increasing the likelihood of a bounce if buyers step in.
What do we want to see?
For a continuation to the upside, we need this level to hold as support. A bullish engulfing candle could signal a potential reversal.
If JPY/USD is to move lower, we need a clear break below support with high volume to confirm the breakout. In that case, lower prices could follow.
Thanks for your support.
- Make sure to follow me so you don't miss out on the next analysis!
- Drop a like and leave a comment!

JPY/USD Technical Analysis – Bullish Breakout from Falling WedgeIntroduction
The JPY/USD chart showcases a classic falling wedge pattern, a strong bullish reversal signal. This pattern is characterized by converging downward-sloping trendlines, indicating a weakening bearish momentum. Eventually, buyers stepped in, leading to a breakout to the upside. This analysis breaks down key elements, including support and resistance zones, trendlines, trading strategy, and risk management.
1. Breakdown of the Chart Pattern
A. The Falling Wedge Formation (Bullish Reversal Pattern)
A falling wedge is a bullish technical pattern that forms when the price consolidates within two downward-sloping trendlines that converge over time. This signals that selling pressure is decreasing and a reversal may be near.
Downtrend Structure: The price was previously in a consistent downtrend, making lower highs and lower lows, which formed the wedge.
Breakout Confirmation: Once the price broke above the upper trendline, the pattern was confirmed, indicating the start of a bullish move.
Retest Possibility: Often, after a breakout, the price retests the upper trendline before continuing higher. If it holds, it strengthens the bullish outlook.
B. Key Levels Identified in the Chart
1. Support Zone (Buying Area)
The price found strong support in the 0.006291 – 0.006500 region.
Buyers stepped in, preventing the price from dropping further.
This support level coincides with the bottom of the wedge, further validating its importance.
2. Resistance Zone (Profit Target)
The 0.007100 – 0.007200 area is a major resistance level where sellers have previously dominated.
If the price reaches this level and consolidates, traders will look for either a breakout or a rejection.
A break above 0.007200 would indicate further bullish continuation.
3. Trendlines & Curve Formation
A curved trendline in the chart suggests a gradual transition from bearish to bullish momentum.
The dotted ascending trendline now acts as dynamic support, helping the price sustain its bullish move.
2. Trading Strategy & Risk Management
A. Entry Strategies
Traders have two primary ways to enter this trade:
Aggressive Entry:
Enter immediately after the breakout of the wedge.
Higher risk but captures early momentum.
Conservative Entry:
Wait for a pullback to the trendline before entering.
Lower risk as it confirms trend continuation.
B. Take Profit Targets
Primary Target: 0.007117 (Resistance level from previous highs).
Extended Target: 0.007200 (Next significant resistance).
C. Stop Loss Placement
Below the recent swing low at 0.006291 to protect against false breakouts.
Ensures a favorable risk-to-reward ratio.
3. Market Sentiment & Confirmation Signals
✅ Bullish Confirmation
Breakout from the falling wedge
Price holding above the trendline
Higher highs and higher lows formation
Increased buying volume
⚠️ Bearish Risks & Invalidations
A break below the trendline would indicate weak momentum.
If the price fails to hold support, it could reverse downward.
Low volume on the breakout could signal a fake breakout.
4. Final Thoughts
This setup provides a high-probability trading opportunity following the breakout from a falling wedge pattern. The risk-to-reward ratio is favorable, making it an ideal setup for trend-following traders. However, patience is key—waiting for a successful retest before entering can minimize risks. If the price maintains momentum, we could see a rally toward the 0.007100 – 0.007200 resistance zone in the coming weeks. 🚀

JPY/USD 4H Chart Analysis – Head & Shoulders BreakdownThis JPY/USD 4-hour chart showcases a Head & Shoulders (H&S) pattern, a well-known bearish reversal pattern signaling a potential downtrend after an extended bullish run. The breakdown of the neckline support and the trendline breakout are key confirmations of a shift in momentum, making this a high-probability trading setup.
📌 1️⃣ Understanding the Head & Shoulders Pattern
The Head & Shoulders pattern is a classic reversal structure that forms after a prolonged uptrend. It consists of three peaks:
Left Shoulder: The first peak forms as buyers push the price higher, followed by a pullback.
Head: The price rallies again, making a higher peak, but sellers start to gain strength, causing another pullback.
Right Shoulder: A lower high is formed as buying pressure weakens, signaling exhaustion of the uptrend.
This pattern is significant because it suggests that bullish momentum is fading and that a potential trend reversal is underway.
📌 2️⃣ Trendline Breakout – Bearish Confirmation
Before the formation of the Head & Shoulders, the market was in a strong uptrend, supported by a rising trendline (dashed black line).
The price respected this trendline multiple times, acting as dynamic support.
However, after the right shoulder formation, the price broke below the trendline, indicating that selling pressure is increasing.
A trendline breakout after a reversal pattern strengthens the bearish case, increasing the likelihood of further downside movement.
📌 3️⃣ Key Resistance & Support Levels
Understanding the key price levels is essential for determining trade entries, stop-loss placements, and target zones.
📍 Resistance Zone (Stop-Loss Area):
0.006776 is the recent high and a key resistance level where sellers previously stepped in.
If the price reclaims this level, the bearish thesis could be invalidated, making it a logical place to set a stop-loss.
This level also aligns with the Head of the pattern, further reinforcing it as a strong supply zone.
📍 Support Level (Neckline Zone):
The neckline (horizontal support zone) was previously holding as support but has now been broken.
If the price pulls back to this area and rejects it, it could serve as a strong entry point for short trades.
A confirmed retest of the neckline would validate the breakdown, increasing the likelihood of a further decline.
📍 Bearish Target (Profit-Taking Zone):
The price is projected to decline toward 0.006457, which is derived by measuring the height of the Head & Shoulders pattern and projecting it downward.
This level also coincides with historical support, making it a strong take-profit area.
If bearish momentum continues, further downside targets may come into play.
📌 4️⃣ Trading Plan – Execution Strategy
This setup provides a clear structure for planning a high-probability short trade.
✅ Entry Strategy:
Option 1 (Aggressive Entry): Enter a short trade immediately after the breakdown of the neckline.
Option 2 (Conservative Entry): Wait for a retest of the broken neckline as resistance before entering a short position.
🚀 Stop-Loss Placement:
Above 0.006776 (recent resistance & Head of the pattern).
Ensures protection from a potential false breakout.
🎯 Take-Profit Strategy:
First target: 0.006457 (measured move of the pattern).
Extended target: Lower psychological support if momentum continues downward.
📌 5️⃣ Market Sentiment & Additional Considerations
While this technical setup suggests a bearish outlook, traders should also consider:
🔸 Fundamental Factors: Economic data releases, interest rate decisions, and geopolitical events can impact market sentiment.
🔸 Volume Confirmation: A high-volume breakout strengthens the bearish bias, whereas weak volume may indicate a potential fake-out.
🔸 RSI & Momentum Indicators: Checking if the RSI is in overbought territory or showing bearish divergence can provide further confidence in the setup.
🔸 Psychological Levels: Traders should watch for price reactions near key round numbers, as these often act as support/resistance.
📌 6️⃣ Conclusion – Why This Setup is High Probability
This JPY/USD 4H chart presents a well-defined Head & Shoulders pattern, a classic reversal setup that indicates a shift from bullish to bearish momentum. The trendline breakout and neckline breach reinforce the bearish bias, making this a high-probability short trade opportunity.
💡 Key Takeaways:
✅ A confirmed trendline break + H&S pattern indicates a bearish reversal.
✅ Watch for a neckline retest as a potential short entry.
✅ Bearish target: 0.006457 with stop-loss above 0.006776.
✅ Consider fundamental factors & market sentiment for additional confirmation.
🔽 Overall Bias: Bearish 📉
#JPYUSD #ForexTrading #HeadAndShoulders #PriceAction #TradingSetup #TrendReversal

JPY/USD Head & Shoulders Breakdown – Full Professional Analysis1. Introduction to the Chart Pattern
The JPY/USD chart on the 1-hour (H1) timeframe displays a well-defined Head & Shoulders (H&S) pattern, which is a well-known bearish reversal pattern in technical analysis. This pattern signals the potential end of the previous uptrend and the beginning of a downward move.
A Head & Shoulders pattern consists of three main components:
Left Shoulder: The price rallies to a peak, then retraces.
Head: The price rises higher than the left shoulder, marking the highest point before declining.
Right Shoulder: A lower peak compared to the head, indicating weakening bullish strength.
Neckline: The horizontal support level that, once broken, confirms the bearish trend.
2. Key Levels & Market Structure
🔹 Resistance Level (Supply Zone)
The blue box at the top represents the resistance area, where price action was repeatedly rejected.
This indicates strong selling pressure at this level, preventing further bullish momentum.
🔹 Support Level (Neckline)
The horizontal blue line acts as the support level or neckline of the H&S pattern.
Price has tested this area multiple times, confirming it as a crucial level for trend continuation or reversal.
🔹 Trend Line (Dynamic Support)
The black dashed trend line represents the previous uptrend, which provided support before being violated.
The break of this trend line suggests a weakening bullish structure and increased chances of a bearish move.
3. Breakdown of the Head & Shoulders Pattern
Initial Uptrend:
The market was in a strong uptrend before forming the Head & Shoulders pattern.
Buyers pushed the price higher, making higher highs and higher lows.
Formation of Left Shoulder:
Price reached a peak and then retraced, forming the left shoulder as sellers entered the market.
Formation of the Head:
A strong rally followed, breaking the left shoulder’s peak and reaching a new high, forming the head.
However, buyers started losing momentum, leading to another retracement.
Formation of Right Shoulder:
The price made another attempt to move upward but failed to surpass the head’s high, forming the right shoulder.
This signaled a reduction in bullish strength and potential trend exhaustion.
Neckline Breakdown (Bearish Confirmation):
The price dropped below the neckline (support level), confirming a bearish reversal.
This is the official entry signal for traders looking for a short setup.
4. Expected Market Behavior & Trading Setup
📉 Bearish Confirmation Steps:
Neckline Retest: The price might retest the broken neckline before continuing downward.
Bearish Candlestick Patterns: Look for rejection signals like bearish engulfing or shooting star formations.
Volume Increase on Breakdown: Strong selling pressure confirms the trend continuation.
🎯 Potential Take Profit Levels:
1️⃣ Target 1 (TP1): 0.006492 – This is a short-term support level, where the price might pause before further decline.
2️⃣ Target 2 (TP2): 0.006430 – A stronger support zone, where sellers may take profits.
🚨 Stop Loss Placement:
A stop-loss should be placed above the right shoulder to protect against false breakouts.
This ensures a favorable risk-to-reward ratio.
5. Risk Management & Market Conditions
✅ Entry Strategy: Wait for a retest of the neckline for a higher probability short trade.
✅ Risk-to-Reward Ratio: Ideally, aim for 1:2 or 1:3 to ensure profitability.
✅ Market Catalysts: Be cautious of fundamental news events, as they can cause unexpected volatility.
6. Conclusion: Bearish Outlook for JPY/USD
🔸 The Head & Shoulders pattern breakdown suggests a strong bearish trend reversal.
🔸 If the neckline holds as resistance, a short trade offers a high-probability setup.
🔸 Price may reach TP1 first, then potentially extend to TP2 if selling pressure persists.
📢 Final Verdict: Bearish trend confirmed; watch for short opportunities on retest.
📊 TradingView Tags:
#JPYUSD #HeadAndShoulders #ForexTrading #TechnicalAnalysis #BearishBreakout #ShortTrade

JPY/USD Technical Analysis - Head & Shoulder Chart Bearish Move1️⃣ Chart Type & Timeframe:
Market: Japanese Yen (JPY) / U.S. Dollar (USD)
Timeframe: 1-hour chart (H1)
Platform: TradingView
This is an intraday chart used by traders to identify short-term price action and trend reversals.
2️⃣ Identifying the Key Chart Pattern – Head & Shoulders
The dominant pattern on this chart is the Head & Shoulders (H&S), a well-known bearish reversal signal that forms after an uptrend. Let’s break it down:
A. Formation of the Pattern
Left Shoulder: The price forms a peak, then retraces down to a support level.
Head: A higher peak is formed, followed by another decline, indicating buyers are losing control.
Right Shoulder: The price attempts another rise but fails to reach the previous high, showing bearish momentum is increasing.
B. Neckline & Trendline Support
The neckline acts as a key support level. A break below it confirms the bearish move.
The trendline, which has been supporting price action for a while, is also at risk of breaking.
3️⃣ Key Support & Resistance Levels
Resistance Level (0.006750 - 0.006819):
This is the previous high area where sellers are active. A stop-loss is placed above this level.
Support Level (0.006567 - 0.006468):
Key demand zones where buyers may step in. These are the take profit (TP) levels.
4️⃣ Price Action & Expected Movement
📉 Bearish Outlook – A potential breakdown from the neckline and trendline would confirm further downside.
If price breaks the trendline, a pullback to retest resistance is expected before dropping further.
Take Profit (TP) 1: 0.006567 – Minor support, possible bounce.
Take Profit (TP) 2: 0.006468 – Stronger support, deeper correction possible.
🚨 Stop Loss: Above 0.006819, just beyond the right shoulder and all-time high (ATH).
5️⃣ Trading Strategy & Execution
💡 Entry Strategy:
Sell Breakout Entry: Short the market when the neckline/trendline is broken with strong volume.
Retest Confirmation: Wait for a pullback to the broken trendline and enter when price rejects it.
📌 Risk Management:
Risk-to-Reward Ratio: 1:2 or higher for an optimal setup.
Use trailing stop-loss to secure profits if TP1 is hit.
6️⃣ Market Psychology & Smart Money Behavior
The Head & Shoulders pattern reflects buyer exhaustion and increased seller strength.
Smart money often enters after the breakdown when weak hands get stopped out.
Conclusion: Trade with Confidence!
This chart presents a high-probability bearish trading opportunity based on a textbook Head & Shoulders formation, support/resistance dynamics, and trendline analysis. A disciplined approach with risk management will ensure better execution.
📉 Final Verdict: Bearish Breakdown Expected – Sell the Retest!
🔥 Tags for TradingView Idea:
#JPYUSD #ForexTrading #HeadAndShoulders #TechnicalAnalysis #BearishReversal #SmartMoney #PriceAction #RiskManagement #TradingSetup #TrendlineBreak

Short I just opened three short positions.
I waited for the price to come back to the fair value gap area that was created a few days ago (blue rectangular box in the chart).
Please look at my previous publication on JPYUSD short positions. It explains the reasons for short entry. It is linked to this one.
Entry: 149.40
S/L: 150.183
Target 1: 148.272
Target 2: 147.547
Target 3: 146.707

JPY/USD Trading Setup – Falling Wedge Breakout & Bullish MoveThe JPY/USD 1-hour chart is displaying a well-defined falling wedge pattern, which is typically a bullish reversal setup. This pattern forms as price action moves within converging trendlines, indicating that selling pressure is gradually weakening. The breakout from this pattern signals a potential trend reversal, and the price may be heading toward key resistance zones and an eventual bullish target.
This analysis will break down the chart structure, market psychology, key levels, and a trading setup to help traders make an informed decision.
1. Understanding the Falling Wedge Pattern
The falling wedge is a common price action pattern characterized by:
🔹 Lower highs and lower lows forming within two downward-sloping trendlines.
🔹 Decreasing volume, indicating that sellers are losing momentum.
🔹 A breakout above the upper trendline, confirming a shift in trend and signaling the start of bullish momentum.
Market Psychology Behind the Wedge Pattern:
📉 During the wedge formation, the market is in a downtrend, and sellers are in control. However, with each new lower low, the price finds strong support, and buyers start stepping in.
📊 As the wedge narrows, the downward momentum weakens, and sellers struggle to push the price lower. Eventually, demand exceeds supply, leading to a breakout to the upside, which is exactly what we see on this chart.
2. Key Levels & Market Structure
🔹 Support Zone & Reversal Area:
The support zone between 0.006660 - 0.006680 acted as a strong demand area, preventing further downside.
This is also labeled as a reversal area, meaning buyers were aggressive in this zone.
The final touch at this support led to a strong bounce, initiating the breakout.
🔹 Resistance Level:
The price is now approaching a key resistance area at 0.006780 - 0.006800, which previously acted as a supply zone.
A break and retest of this level would further confirm bullish momentum.
🔹 All-Time High (ATH) & Target Level:
The ATH region is marked on the chart as a historical resistance level where price faced strong selling pressure before.
If the current breakout holds, price action could aim for the 0.006851 target level, completing the measured move from the wedge pattern.
3. Trading Strategy & Execution Plan
📈 Entry Strategy:
There are two main ways to enter this trade:
1️⃣ Aggressive Entry: Enter immediately after the breakout above the falling wedge.
2️⃣ Conservative Entry: Wait for a breakout AND retest of the previous resistance turned support (0.006780 zone) before entering long.
🔻 Stop-Loss Placement:
To manage risk, traders should consider placing stop-loss orders:
Below the previous support zone (0.006660) to minimize downside risk.
Alternatively, below the wedge breakout point if using a tight stop-loss.
🎯 Take-Profit Targets:
1️⃣ First Target: 0.006780 (near-term resistance level).
2️⃣ Final Target: 0.006851 (based on wedge breakout projection).
4. Confirmation & Risk Management
🔎 Key Confirmation Factors for a Strong Breakout:
✅ Price breaks above the falling wedge with strong bullish candles.
✅ Volume increases, showing strong buying interest.
✅ RSI or other momentum indicators confirm bullish divergence.
⚠️ Potential Risks to Consider:
False Breakout: If price falls back inside the wedge, this could invalidate the bullish setup.
Rejection at Resistance: If buyers fail to push price above the 0.006780 resistance, it could lead to another consolidation.
5. Final Thoughts & Trading Outlook
📌 This JPY/USD chart presents a high-probability bullish setup due to the breakout from a falling wedge pattern.
📌 The breakout, strong support zone, and bullish price action indicate further upside potential.
📌 Risk management is key—waiting for confirmation can increase the probability of success.
💡 Final Verdict: Bullish Bias – Watching for Retest & Continuation to Target! 🚀

JPY/USD Breakout from Falling Channel – Bullish Trading SetupOverview of the Chart:
The Japanese Yen (JPY) against the U.S. Dollar (USD) 1-hour chart showcases a well-defined market structure, transitioning from a downtrend within a falling channel to a breakout with bullish momentum. The chart highlights critical support and resistance levels, a confirmed breakout, and a forecasted price movement that could indicate further bullish continuation.
This analysis will break down the chart patterns, technical indicators, and potential trade setups, providing a professional outlook on price action behavior.
Technical Breakdown of the Chart
1. Falling Channel Pattern – Downtrend Phase
The price had been trading within a descending channel, marked by two parallel trendlines (blue lines), indicating a controlled downtrend.
A falling channel is a bullish reversal pattern, as it signals that bearish momentum is weakening.
Within the channel, price action consistently created lower highs and lower lows, adhering to the structure of the pattern.
The red dashed trendline inside the channel acted as a dynamic resistance, rejecting price movements multiple times before the breakout.
📌 Key Observation: The falling channel pattern suggests accumulation, where selling pressure gradually diminishes, paving the way for a bullish reversal.
2. Support Zone & Bullish Breakout
The price eventually reached a strong horizontal support level (highlighted blue zone at the bottom), which acted as a critical demand area.
This support level had previously led to strong rebounds, making it a significant zone for potential reversals.
Bullish breakout confirmation:
A strong bullish candle closed above the upper boundary of the channel, breaking the trendline resistance.
The breakout suggests a shift in market structure from a downtrend to an uptrend, as buyers regained control.
The price has now moved above the previous resistance, confirming the bullish momentum.
📌 Key Takeaway: The breakout is a strong signal that sellers have lost control, and a potential bullish trend could emerge.
3. Resistance Zone – Key Barrier for Buyers
The next area of interest is the resistance level (highlighted in a blue rectangular zone).
This level has historically acted as a strong supply zone, where price previously struggled to break through.
If the price manages to sustain above this level, it would confirm bullish continuation toward higher price targets.
📌 Technical View: If buyers break past this resistance, it could lead to a strong bullish rally, reinforcing the new uptrend.
4. Target Projection & Forecasted Price Movement
The chart outlines a forecasted bullish path using a zigzag projection (black lines). Here’s the expected price action:
Short-Term Movement:
Price might face temporary resistance near the blue resistance zone.
A minor pullback or consolidation in this area is expected before further movement.
Retest of Support:
If price pulls back, it could retest the broken channel resistance or the support zone.
A successful retest and bounce would validate the strength of the breakout.
Bullish Continuation:
If the resistance zone is broken, price is likely to continue toward the target level of 0.006842, a previous swing high.
This level acts as the final upside target based on historical resistance levels.
📌 Key Insight: The market structure suggests that price will follow a higher-high, higher-low pattern, which is characteristic of an uptrend.

JPY/USD – Bullish Breakout After Falling Wedge!Let's take a deep dive into the JPY/USD price action and technical setup on the daily chart. The market has presented us with a falling wedge breakout, a strong bullish reversal signal. This pattern indicates a potential shift from the previous downtrend into an uptrend.
1️⃣ Falling Wedge Pattern – Bullish Reversal Signal
The falling wedge is a classic bullish reversal pattern. It forms when price action makes lower highs and lower lows within two converging trendlines. The key characteristic of this pattern is the decreasing selling pressure, leading to a breakout to the upside.
We observed a clear breakout from the wedge, indicating bullish momentum.
Buyers have stepped in strongly, pushing prices above the resistance zone.
This signals a potential trend reversal from bearish to bullish.
2️⃣ Breakout Confirmation & Key Levels
Once the price broke above the wedge, it faced a crucial resistance zone (marked in blue on the chart). After breaking this level, it has now turned into support—a strong technical confirmation.
Resistance Turned Support: The previous resistance is now acting as support, giving further confidence in the bullish move.
Retest Expected: After breakouts, the price often comes back to retest support before continuing higher. If it holds, it’s a good entry opportunity.
3️⃣ Entry, Stop Loss & Take Profit Targets
Based on the technical setup, here’s how we can approach this trade:
🔹 Entry: Ideal entry is around the current support zone after a successful retest.
🔹 Stop Loss: Placed below the support level at 0.006574 to minimize risk.
🔹 Take Profit (TP): The target price is set at 0.007126, aligning with the previous swing high.
4️⃣ Trade Outlook & Expected Movement
If the price holds above support, we expect a bullish continuation towards the target.
A minor pullback is possible before the next move higher.
If the price breaks below the support zone, it may invalidate the bullish setup.
📌 Final Thoughts
This setup is a high-probability bullish trade, backed by the falling wedge breakout and retest of a key level. However, always manage risk properly and wait for confirmation before entering the trade.
What do you think? Do you see further upside, or is this a false breakout? Drop your thoughts below! 👇
#JPYUSD #ForexTrading #TechnicalAnalysis #TradingView #BullishBreakout #ChartPatterns

JPY/USD Price Action & Trade Setup
Market Structure & Trend:
The chart illustrates JPY/USD on the 4-hour timeframe, showing a rising channel pattern.
Price has recently rejected from resistance near 0.0068058 and is now showing signs of a bearish move.
Trade Setup:
Bearish bias: The pair is breaking down from the channel, indicating a potential trend reversal.
Key levels:
Resistance: 0.0068058
Support Zone: 0.0064368 (Target area)
Potential Move: A continuation of this bearish movement may lead to a drop toward the support zone.
Conclusion:
If the price sustains below the midline of the channel, further downside is likely.
A retest of support at 0.0064368 could offer potential opportunities for either a bounce or a continuation of the bearish trend.
📌 What’s next? Watch for price action near the support zone for potential trade setups.

Yen Falls Below 153 as BOJ Offers Little Policy ClarityThe yen fell below 153 per dollar on Wednesday, hitting a one-week low after BOJ Governor Ueda gave little clarity on rate policy. He reiterated the BOJ's commitment to a 2% inflation target, despite board member Tamura suggesting rates may rise to 1% in late 2025. The yen also weakened as Trump’s escalating tariffs raised inflation concerns, limiting the Fed’s ability to cut rates.
The key resistance level appears to be 153.85, with a break above it potentially targeting 154.90 and 156.00. On the downside, 151.90 is the first major support, followed by 151.25 and 149.20 if the price moves lower.

Fundamental Market Analysis for February 11, 2025 USDJPYThe Japanese Yen (JPY) has experienced a slight decline at the start of the new week, as concerns over US President Donald Trump's tariff threats have resurfaced, leading to speculation that Japan could also be subject to new US duties. Additionally, the moderate strength of the US Dollar (USD) has led to an increase in the USD/JPY pair towards 152.00 during the Asian session. The positive US jobs report on Friday, along with expectations that Trump's policies could boost inflation and limit the Federal Reserve's (Fed's) policy easing ability, is having a modest impact on the USD.
However, a significant yen decline seems unlikely due to growing confidence that the Bank of Japan (BoJ) will raise interest rates again this year, which continues to push Japanese government bond (JGB) yields higher. Consequently, the narrowing of the rate differential between Japan and other major central banks is expected to limit the decline in JGB yields. Therefore, it would be prudent to wait for strong follow-through selling in the yen before confirming that the USD/JPY pair has bottomed in the near term.
Trade recommendation: SELL 151.80, SL 152.40, TP 151.00

ShortThe price failed to reclaim the recent high at $158.87 and closed below the previous higher high. It also closed below EMA21, EMA55 and ascending trendline.
All momentum indicators enter the bear zone and lines are pointed to the downside. The similar price set up happened on the 17th July 2024 (blue vertical line in the chart) and it was followed by a sharp price fall.
I opened a short position at $154.55. Stop loss is placed at 156.80 (just above EMA 21) and the initial target is $151.40. Risk:Reward is roughly 1:1.75.

USDJPY R2🔍 Technical Analysis of USD/JPY
📌 Overall Trend:
After a downward correction, the price has reached the 154.250 support zone.
A positive reaction at this level suggests a potential upward move.
A price gap is visible in the 156.000 - 156.400 range, which may lead to a price increase to fill the gap.
📈 Buy Trade Signal (Long Position)
🔹 Entry Conditions:
If the price holds the 154.250 - 154.400 support zone and bullish reversal candlesticks appear, a long trade is recommended.
The ideal entry range is 154.600 - 154.860.
🔹 Stop Loss (SL):
Below 154.250
🔹 Take Profit (TP):
First target: 155.860
Second target: 156.110
Third target: 156.400 (if the bullish momentum continues)
🔹 Risk Management:
If the price stabilizes below 154.250, reconsider the trade.
Breaking above 156.110 increases the likelihood of further bullish movement to fill the price gap.
✅ Final Conclusion:
If the price finds support at 154.250 - 154.400, a buy trade is favorable.
A breakout above 156.110 could lead to a further target of 156.400.
📌 Ensure confirmation through price action and candlestick patterns before entering the trade.

USDJPY 4H Bearish TrendOANDA:USDJPY
📶 Technical Analysis:
Weekly (1W): Price is near its all-time high formed in 2024, with a bullish trend supported by moving averages (MAs).
Daily (1D): While the price shows bearish movement since the start of 2025, MAs indicate an overall bullish trend. There's significant volatility on both the upside and downside due to strong support and resistance levels, as well as fundamental factors like interest rate expectations and other economic events.
4-Hour (4H): In January 2025, the price has formed a bearish trend, breaking two support levels at 156.5 and 155.0. On January 27, the price tested the 155 support level three times before breaking it with a strong candle. MAs on the 4H chart are also showing a bearish formation.
Strategy: A potential short position is suggested if the price retests and confirms resistance at the broken support level of 155.0. Watch for the next key support around 152.0 if the price breaks below the current low of 153.7.
🆕 Fundamental Analysis:
Fed Interest Rates Decision (Jan 29): No change expected in the federal funds rate, currently at 4.5%. The accompanying press conference will provide important guidance for future market expectations.
🔤 Trade Comment:
A potential pending short order at 155.0 with a risk no more than 2%.
JPY is strong against all major pairs on 27 Jan as JPY currency index has +0.85%

GOLD is ready to fly againXAUUSD Gold is showing strong signs of preparing to take off again! After consolidating and building momentum, the precious metal is positioning itself for another powerful move upward. As the market aligns, this could be the perfect time to watch for golden opportunities. Are you ready to ride the wave of gold's next flight?"

#USDJPY Taking a closer look at the USD/JPY pair on the 1-hour timeframe, the current price action highlights a significant area of interest that could dictate the next move in the market. The momentum appears to be building around this key zone, offering potential opportunities for both intraday traders looking for quick gains and scalpers aiming to capitalize on shorter movements. Whether it leads to a breakout or a reversal will depend on how the price interacts with these critical levels, making patience and confirmation essential for executing a well-timed and calculated trade.
