USD/JPY 2-Hour Forex Chart2-hour performance of the U.S. Dollar (USD) against the Japanese Yen (JPY) from FOREX.com, showing a current exchange rate of 145.498 with a decrease of 0.661 (-0.45%). The chart highlights a recent sharp decline, with a shaded area indicating a potential support or resistance zone around 145.000 to 146.047. Key levels include 144.721 (support) and 146.047 (resistance), with the price movement tracked over the past two hours.
Jpyusdanalysis

"JP225 / NIKKEI" Index CFD Market Heist Plan (Swing/Day Trade)🌟Hi! Hola! Ola! Bonjour! Hallo! Marhaba!🌟
Dear Money Makers & Robbers, 🤑 💰💸✈️
Based on 🔥Thief Trading style technical and fundamental analysis🔥, here is our master plan to heist the "JP225 / NIKKEI" Index CFD Market. Please adhere to the strategy I've outlined in the chart, which emphasizes long entry. Our aim is to escape near the high-risk ATR Zone. Risky level, overbought market, consolidation, trend reversal, trap at the level where traders and bearish robbers are stronger. 🏆💸"Take profit and treat yourself, traders. You deserve it!💪🏆🎉
Entry 📈 : "The heist is on! Wait for the MA breakout (37300) then make your move - Bullish profits await!"
however I advise to Place Buy stop orders above the Moving average (or) Place buy limit orders within a 15 or 30 minute timeframe most recent or swing, low or high level for Pullback entries.
📌I strongly advise you to set an "alert (Alarm)" on your chart so you can see when the breakout entry occurs.
Stop Loss 🛑: "🔊 Yo, listen up! 🗣️ If you're lookin' to get in on a buy stop order, don't even think about settin' that stop loss till after the breakout 🚀. You feel me? Now, if you're smart, you'll place that stop loss where I told you to 📍, but if you're a rebel, you can put it wherever you like 🤪 - just don't say I didn't warn you ⚠️. You're playin' with fire 🔥, and it's your risk, not mine 👊."
📍 Thief SL placed at the recent/swing low level Using the 4H timeframe (35600) Day trade basis.
📍 SL is based on your risk of the trade, lot size and how many multiple orders you have to take.
🏴☠️Target 🎯: 39300 (or) Escape Before the Target
🧲Scalpers, take note 👀 : only scalp on the Long side. If you have a lot of money, you can go straight away; if not, you can join swing traders and carry out the robbery plan. Use trailing SL to safeguard your money 💰.
💰💵💴💸"JP225 / NIKKEI" Index CFD Market Heist Plan (Day / Swing Trade) is currently experiencing a bullishness🐂.., driven by several key factors.👆👆👆
📰🗞️Get & Read the Fundamental, Macro economics, COT Report, Geopolitical and News Analysis, Sentimental Outlook, Intermarket Analysis, Index-Specific Analysis,Positioning and future trend targets with Overall Score...... go ahead to check👉👉👉🔗🔗🌎🌏🗺
⚠️Trading Alert : News Releases and Position Management 📰 🗞️ 🚫🚏
As a reminder, news releases can have a significant impact on market prices and volatility. To minimize potential losses and protect your running positions,
we recommend the following:
Avoid taking new trades during news releases
Use trailing stop-loss orders to protect your running positions and lock in profits
💖Supporting our robbery plan 💥Hit the Boost Button💥 will enable us to effortlessly make and steal money 💰💵. Boost the strength of our robbery team. Every day in this market make money with ease by using the Thief Trading Style.🏆💪🤝❤️🎉🚀
I'll see you soon with another heist plan, so stay tuned 🤑🐱👤🤗🤩

JPY/USD Weekly Chart – Bullish Triangle Breakout Pattern Forming🔍 Chart Pattern Breakdown:
The chart is showing a symmetrical triangle pattern forming on the weekly timeframe of JPY/USD (Japanese Yen vs. US Dollar). This triangle is developing after a massive multi-year downtrend, which started all the way back in 2021. Such a triangle at the bottom of a trend often signals a potential reversal or a strong trend shift.
Here's what's happening technically:
🔺 Triangle Formation (Consolidation Phase):
Lower highs and higher lows indicate a clear symmetrical triangle.
The price has been bouncing between these converging trendlines for months.
This compression is like a spring — it’s storing energy and getting ready to break out.
The triangle pattern is nearing its apex, which means a breakout is likely soon.
📉 Previous Trend Context:
Before the triangle, the market had a strong bearish move — a downtrend that brought the pair into a major weekly support zone.
This support zone (marked in light blue) around 0.0062–0.0063 has been tested and respected multiple times.
📊 Key Technical Zones:
Support Zone: 0.0062 – 0.0063 — this is where price bounced and formed the base of the triangle.
Resistance Zone / Triangle Top: Around 0.0071 – this is the upper boundary of the triangle. A breakout above this will confirm the bullish scenario.
Target Area: 0.00829 – derived from measuring the height of the triangle and projecting it from the breakout point.
Major BOS (Break of Structure): Once price breaks above the triangle and the BOS line, it confirms a shift from bearish to bullish structure.
SL Zone: Stop loss area is just below the support zone at 0.00629 to protect against false breakouts.
🔁 Retest Setup:
After the breakout, it's common to see a pullback to retest the previous resistance (now turned support). That retest often provides a high-probability entry for swing and position traders. If it happens — that’s your golden moment!
🎯 Trade Plan (Example for Education):
Entry Criteria Value/Zone
Breakout Entry Above 0.0071 (confirmed candle close)
Retest Entry 0.0069 – 0.0070 (support flip)
Stop-Loss (SL) Below 0.00629
Target (TP) 0.00829
✅ Why This Setup Matters:
Clear structure on the weekly chart.
Multi-touch points on both trendlines = strong pattern.
Support zone backing the triangle base gives extra conviction.
A breakout from such consolidation patterns often results in sharp movements.
Risk/reward ratio is highly favorable.
⚠️ Risk Management Reminder:
Always trade with a plan, use a stop-loss, and don’t jump into the breakout blindly. Volume confirmation or retest confirmation will help increase the success rate. These kinds of setups are powerful, but only when approached with discipline.
🧠 Final Thoughts:
This JPY/USD triangle on the weekly chart is a textbook example of potential bullish reversal from a major downtrend. It’s showing signs of a structural shift, supported by strong support, tightening price action, and the chance for a breakout to deliver a major upside move toward 0.00829.
If you’re a swing or position trader, keep this on your radar. Momentum is building — don’t miss the move when the breakout hits. 📈🔥

JPYUSD | Head & Shoulders Breakdown Setup | Bearish move Build🔍 Technical Overview
A clear Head & Shoulders pattern has formed on the JPY/USD 8H chart — a well-known bearish reversal setup often signaling a shift from bullish momentum to bearish control. The pattern is confirmed with a left shoulder, higher head, and lower right shoulder, all aligned along a defined neckline acting as key horizontal support.
Currently, the price is retesting both the neckline and a descending trendline, which adds confluence to the bearish bias. If price fails to break back above this resistance zone, we can anticipate a further drop toward the projected target zone.
📌 Key Technical Levels
Head: ~0.007180
Neckline Support: ~0.006660
Retest Area (Confluence Zone): ~0.006940–0.006960
Bearish Target: ~0.006470 (measured from the head to the neckline and projected downward)
Trendline Resistance: Acting as dynamic resistance since the recent high
⚙️ Price Action Insights
Pattern Clarity: The structure of the H&S is clean and symmetrical — a classic sign of distribution and topping out after a bullish rally.
Retest in Play: Price is currently retesting the trendline resistance. Rejection from this area strengthens bearish continuation potential.
Momentum Shift: Bullish pressure is weakening. Lower highs on the right shoulder show buyer exhaustion.
🧠 Mindset & Strategy
This setup demonstrates how patience, pattern recognition, and confluence can align to offer a high-probability trading idea.
✅ Wait for Confirmation: A strong bearish candle off the retest zone or neckline breakdown gives a cleaner short entry.
✅ Risk Management First: Place stops just above the right shoulder or trendline (~0.007000 zone).
✅ Target Logically: The target is not random — it’s derived using the classic measured move technique, matching the head-to-neckline distance.
📋 Trade Idea (Not Financial Advice)
📍 Entry: On rejection at retest zone or confirmed neckline breakdown
🎯 Target: 0.006470
🛑 Stop Loss: Above 0.007000 (trendline/right shoulder area)
⚖️ Risk/Reward Ratio: Minimum 2:1 if entered post-retest confirmation
🧠 Trader’s Note (Minds Insight)
This is where discipline comes into play. Don’t chase the move. Let the pattern complete and confirm. Head and Shoulders formations are among the most reliable reversal patterns — but only after neckline breaks or strong rejections.
This setup teaches traders to trust the process, combine horizontal and diagonal resistance, and let the price action do the talking.

JPY/USD Rising Wedge Pattern Formed | Retest & Move To Target🧠 Overview:
The JPY/USD pair has recently exhibited a Rising Wedge Pattern, a classic technical formation known for its bearish implications. This pattern has developed over several days of bullish price action, showing diminishing bullish momentum as price action narrows.
The wedge is forming right beneath a minor resistance zone, increasing the likelihood of a potential rejection and breakdown. This setup is particularly noteworthy due to the multiple layers of confluence supporting the bearish bias.
🔍 Technical Breakdown:
📌 1. Rising Wedge Formation
A rising wedge is often considered a bearish reversal pattern, especially after a strong uptrend.
As seen on the chart, price is respecting both the upper and lower bounds of the wedge, but with a loss of bullish momentum, indicated by shallower highs.
This tightening price action hints at indecision and likely exhaustion from buyers.
📌 2. Minor Resistance Zone
Price has approached a previous structure high where strong selling interest was seen before.
This zone has already rejected price once, acting as a supply area.
The repeated failure to break above reinforces the strength of this resistance.
📌 3. SR Interchange (Support Turned Resistance)
Below the current price action, there's a well-defined Support-Resistance Flip Zone (SR Interchange).
Previously a strong demand area, this zone may now act as a new resistance if price breaks below and retests it.
This is a key area where sellers are likely to step in again.
📌 4. Break & Retest Structure
As price begins to break the lower wedge boundary, the next move we anticipate is a retest of the broken wedge trendline.
This retest, if confirmed by rejection candles (such as bearish engulfing or pin bars), would present an ideal entry opportunity for short positions.
🎯 Trade Plan & Price Levels:
💼 Bearish Scenario
Entry Point: Wait for a successful retest of the broken wedge line (confirmation via price action: bearish engulfing or pin bar).
Stop Loss: Above the recent swing high or above the wedge resistance (~0.006920).
Take Profit 1 (TP1): 0.006845 – First key support zone.
Take Profit 2 (TP2): 0.006807 – Next major support / liquidity zone.
🧩 Why This Setup Makes Sense:
✅ Multiple Confluences:
Bearish wedge structure = reversal pattern.
Resistance zone = psychological and technical rejection.
SR Interchange = confirms institutional selling interest.
Retest confirmation = high-probability entry.
Target zones = based on recent support levels and market structure.
🛑 Risk Management:
Risk-to-reward ratio favors short positions if executed after retest.
Avoid jumping in early — wait for confirmation.
Proper stop loss is key to avoiding false breakouts or premature entries.
📊 Summary:
This is a textbook bearish setup with strong technical backing. The rising wedge pattern, when combined with resistance and retest zones, offers a great shorting opportunity — assuming price respects the pattern. Patience will be crucial here; wait for the break, the retest, and the confirmation before entering.
🔔 What to Watch:
Price behavior near the lower wedge boundary.
Reaction on retest — do bulls defend or do bears take over?
Confirmation from volume or price action (engulfing candles, rejection wicks).
Any fundamental catalysts or USD-related news.
✍️ Final Thoughts:
This is a well-structured short setup on the JPY/USD 1H chart. Wedges often deceive with temporary breakouts before reversing hard — so discipline, timing, and confirmation will be key. If the market respects this technical structure, we could see a clean drop toward our projected targets.

JPY/USD Breakout from Curve Line – Targeting Upper Resistance JPY/USD presents a classic curve bottom formation, which is a powerful technical structure indicating accumulation by smart money. It’s supported by key price action behaviors like support/resistance flips, retesting confirmation, and a well-defined target zone.
Let’s break it down piece by piece.
📉 1. Curve Formation – Accumulation Phase
The most noticeable element here is the parabolic (curve) structure formed between October 2024 and March 2025. This kind of structure often reflects a slow accumulation process:
Price dips over several months form a rounded bottom — also called a saucer pattern.
This shows institutional players are quietly accumulating, while retail traders are often trapped in sell-side positions.
As the curve matures, the volume and momentum begin to shift, signaling the beginning of a bullish breakout.
This accumulation curve is bullish by nature and becomes even more potent when followed by a breakout and retest.
🔄 2. SR Flip Zone (Support-Resistance Interchange)
One of the most critical concepts in price action is the SR flip — where old resistance turns into new support. In this case:
The yellow-shaded zone previously acted as resistance — confirmed by multiple rejections.
After the breakout, this same zone is being retested as support — a healthy technical confirmation that the market has accepted higher prices.
This flip zone is a launchpad for continuation to the upside.
📍 3. Retest Confirmation – Smart Entry Opportunity
Zooming into recent price action:
The market pulled back cleanly into the SR zone and the curve line.
The confluence of horizontal support and the curved trendline makes this an extremely strong retest zone.
Buyers stepped in with force, suggesting that demand is active at this level.
This retest is where risk-to-reward is optimized. The ideal entries usually happen when price confirms structure after a breakout — not before.
🎯 4. Target Zone – Next Bullish Objective
The next logical target is shown in the blue box above (~0.00705–0.00710). Here's why this zone is important:
It marks a previous supply/resistance area.
It aligns with psychological round numbers and past consolidation.
A measured move from the bottom of the curve also aligns with this target.
In essence, it is the profit-taking zone where the market is likely to pause or reverse temporarily.
🔎 5. Insider Supply & Central Zone – Institutional Traces
The chart labels an “Insider Supply” area at the base of the curve. This implies:
Hidden accumulation likely occurred at this level.
Institutions tend to trap retail sellers during these periods with false breakdowns.
Once they’ve loaded up, price shifts upward in a controlled fashion — exactly what has happened here.
The Central Zone is the battlefield — the area where prior indecision took place, which has now turned into a stepping stone for upward movement.
💡 Strategy Recap:
Parameter Value
Entry Retest of SR Flip (0.00680–0.00685)
Stop Loss Below curve base (~0.00670 or lower)
Target 0.00705–0.00710
R/R Ratio 1:2 or better
This strategy is technically sound, supported by structure, and has strong reward potential.
🧠 Market Psychology:
Smart money accumulates when price is quiet and sentiment is bearish.
After accumulation, a controlled markup begins, with retests engineered to confirm the breakout.
Retail traders tend to enter late or get faked out — while institutions already hold positions.
This chart is a textbook example of how professional traders operate and manage structure-based risk.
🏁 Final Thoughts:
This is a high-probability technical setup built on multiple layers of confluence:
Curve structure
SR flip
Demand zone retest
Momentum shift
If momentum continues, the 0.00710 zone is a very realistic short-term target. Traders should manage risk tightly and monitor price behavior near the upper resistance box.

JPY/USD Daily Chart – Falling Wedge Breakout & Bullish Target🔍 Full Technical Analysis of JPY/USD (Daily Timeframe)
🧭 Overview
The chart shows a sophisticated price structure unfolding over several months. A falling wedge reversal pattern formed during a sustained downtrend, which later transitioned into a bullish breakout and continuation. This analysis provides insights into market behavior, price psychology, and a high-probability trading opportunity supported by classical technical analysis principles.
🔶 1. Market Context & Structure
Before diving into the pattern, it’s essential to understand the macro structure of the chart:
The pair experienced a strong bearish move from around August to December 2024, marked by lower highs and lower lows.
During this decline, volatility gradually decreased, which often indicates seller exhaustion.
A reversal zone emerged near a major support region — historically significant and previously tested.
🔷 2. The Falling Wedge Pattern (Reversal Signal)
A falling wedge is a bullish reversal pattern that forms when price is in a downtrend but begins to consolidate within converging trendlines. This pattern typically signals that the downtrend is losing momentum and a breakout to the upside is imminent.
📌 Characteristics of This Wedge:
Downward Convergence: The highs and lows begin to narrow over time, indicating reduced selling pressure.
Volume Decline (Implied): Though not displayed, falling wedges usually see volume dry up before breakout.
Duration: This wedge developed over several months (October 2024 – January 2025), lending strength to the pattern.
False Break Attempts: Several lower spikes failed to break the support, showing buying interest building.
✅ Bullish Breakout:
The breakout occurred decisively in late January 2025, with a large bullish candlestick closing above the upper wedge boundary — a confirmed breakout.
Post-breakout, the price rallied strongly, indicating that buyers were firmly in control.
🔷 3. Support & Resistance Zones
🔽 Support Zone (Demand Area):
Range: 0.006300 – 0.006400
Historical pivot zone where price previously reversed, now serving as a demand base.
The lower wick rejections near this zone reinforce it as a high liquidity zone for buyers.
🔼 Resistance Zone (Supply Area):
Range: 0.006850 – 0.006950
This area capped price during several prior rally attempts, making it a key breakout point.
Once price broke above this zone, it became a support flip zone, indicating trend reversal confirmation.
🎯 Target Level:
Marked at 0.007126, derived from a measured move:
Measure the height of the wedge at its widest point.
Project this vertically from the breakout level.
This target aligns with psychological round numbers and prior resistance, adding confluence.
🔶 4. Post-Breakout Price Action: Bullish Retest
A breakout is only the first part of a trade; the retest phase confirms the move and offers an optimal entry.
🔁 Retest Details:
After reaching the resistance zone, price pulled back, testing both:
The broken wedge trendline (now acting as dynamic support).
The horizontal structure support zone near 0.006650–0.006700.
A bullish engulfing candle or similar reversal pattern formed at this level — a classic retest entry.
📌 Trendline Respect:
A rising dotted trendline was drawn from the breakout low through higher lows.
This line acted as price memory and was respected multiple times, reinforcing the uptrend.
🔷 5. Trade Setup Breakdown
This is a swing trade setup based on pattern breakout, structural confluence, and trend continuation. Here's how it’s structured:
Component Details
Pattern Falling Wedge (Reversal)
Trade Bias Long (Buy)
Entry Price ~0.006700
Stop Loss 0.006614 (below trendline)
Target Price 0.007126 (measured wedge move)
R/R Ratio Approx. 3:1
Timeframe Daily (Medium-term swing)
🧠 6. Market Psychology & Behavior
Understanding the sentiment behind the candles is critical:
❗ Before the Breakout:
Sellers dominated but with weakening momentum.
Each push down was met with buying strength, seen in long wicks and smaller-bodied candles.
✅ At the Breakout:
Buyers overwhelmed sellers, often with a volume spike and wide-bodied green candle.
This is usually driven by institutional positioning and stop-loss triggering from short-sellers.
🔁 During the Retest:
Some retail traders exited prematurely, fearing a fakeout.
Smart money used the dip to accumulate positions, confirmed by the bounce from trendline.
🔼 Continuation Rally:
Strong continuation candle signals momentum traders entering.
Break above resistance signals a shift in sentiment and structure.
🛠️ 7. Strategy Notes & Professional Tips
📌 Risk Management:
Never risk more than 1–2% of capital.
Use dynamic trailing stop if price breaks above target zone.
📌 Trade Confirmation Ideas:
Look for volume spikes on breakout candles.
Use RSI or MACD divergence to confirm reversal (optional).
Look for candlestick patterns (engulfing, pin bar) on retests.
📌 Exit Plan:
Partial exit at key resistance.
Full exit at projected target or if price forms reversal signs (e.g., doji at resistance).
✅ Final Summary
This JPY/USD chart demonstrates an exemplary price action-based trading setup rooted in:
A well-formed falling wedge (bullish reversal).
Clean breakout + retest + continuation structure.
Multiple confluence factors: trendline, horizontal S/R, pattern projection.
Professional-grade risk/reward profile with a logical entry, stop, and target.
This kind of setup is highly favored among swing traders, price action purists, and institutional-level strategists due to its clarity and predictability.

JPY/USD – Rising Wedge Breakdown & Bearish Trading Setup1. Market Structure & Technical Pattern:
The Japanese Yen (JPY) against the U.S. Dollar (USD) has been exhibiting a clear Rising Wedge Pattern over the past few months. This is a classic bearish reversal pattern, indicating that buying momentum is gradually weakening, and a strong decline is likely to follow.
Formation of the Rising Wedge:
The price has been making higher highs and higher lows, confined within two converging trendlines (black lines).
The lower boundary (support trendline) has been consistently acting as a dynamic support level.
The upper boundary (resistance trendline) has been limiting further upward movement, indicating exhaustion of buying pressure.
Breakout Confirmation:
The price action tested the resistance zone multiple times but failed to sustain bullish momentum.
A strong rejection from the upper resistance level led to a sharp sell-off, causing a breakdown of the support trendline.
Once the price broke below the wedge, selling pressure intensified, confirming the trend reversal.
2. Key Technical Levels & Zones:
Resistance Level (0.006895):
The price previously struggled to break above this resistance zone, forming a strong supply area where sellers dominated.
This level aligns with the upper boundary of the rising wedge, making it a significant turning point.
The rejection from this zone initiated the bearish breakdown.
Support Level (Broken – 0.006650):
This level acted as a strong demand zone, preventing further downside movement during the wedge formation.
However, once the price broke below this level, it confirmed the end of the uptrend and the beginning of a downtrend.
This level may now act as a new resistance (role reversal principle).
Stop Loss Placement (Above 0.006895):
A logical stop-loss is placed just above the resistance level to protect against a potential invalidation of the bearish setup.
If the price closes above this level, the bearish thesis would be invalidated.
3. Trading Execution & Risk Management:
Sell Entry Strategy:
Traders looking for short positions should enter after a confirmed break below the wedge’s support.
A potential pullback (retest) to the broken trendline could offer an additional shorting opportunity.
The retest would confirm the previous support turning into resistance before a continuation of the downtrend.
Take Profit Targets (TP1 & TP2):
TP1 (0.006481):
This level represents a strong demand zone where short-term buyers may step in.
Traders may choose to book partial profits here.
TP2 (0.006251):
This is a deeper support level and the final target for this trade setup.
If the price sustains bearish momentum, it is likely to reach this level before stabilizing.
Risk-to-Reward Ratio Consideration:
This setup offers a high probability short trade with an attractive risk-to-reward ratio.
The stop-loss is well-defined, minimizing potential losses while maximizing profit potential.
4. Expected Price Movement & Projection:
Short-term Outlook:
A possible pullback to the broken wedge (previous support now acting as resistance) before continuation lower.
If the price retests and rejects the 0.006650 level, expect acceleration in the downtrend.
Medium-term Outlook:
If the price reaches TP1 (0.006481) and breaks below, it increases the probability of hitting TP2 (0.006251).
A bearish trend continuation could form, potentially leading to further downside levels.
Invalidation Scenario:
If the price closes above the stop-loss level (0.006895), the bearish setup is invalidated, and a bullish breakout could follow instead.
5. Conclusion & Trading Plan:
The rising wedge breakdown signals a shift from bullish to bearish market sentiment.
Traders should look for short entries after a confirmed breakdown or wait for a pullback before executing trades.
The risk-to-reward ratio makes this a strong high-probability trade setup.
Following the plan with strict stop-loss placement ensures risk is controlled while maximizing profit potential.
6. Summary & Key Takeaways:
✅ Pattern: Rising Wedge (Bearish Reversal)
✅ Breakout Direction: Downside
✅ Resistance Level: 0.006895
✅ Support Levels: 0.006650 (broken), 0.006481 (TP1), 0.006251 (TP2)
✅ Stop-Loss Placement: Above 0.006895
✅ Profit Targets: TP1 – 0.006481, TP2 – 0.006251
✅ Trade Bias: Bearish

PY/USD Analysis: Rising Wedge Bearish Reversal & Short SetupThis chart represents the JPY/USD (Japanese Yen vs. US Dollar) on a daily timeframe (1D), published on April 3, 2025, via TradingView. The price action and technical indicators suggest a bearish outlook based on the formation of a Rising Wedge Pattern, a classic reversal structure signaling potential price depreciation.
1. Chart Structure & Identified Patterns
A. Rising Wedge Formation (Bearish Reversal Pattern)
The price has been moving in an uptrend, forming higher highs (HH) and higher lows (HL).
The two converging black trendlines indicate a rising wedge, a pattern that typically precedes a downside breakout.
A rising wedge is considered a bearish signal, especially when formed after a strong rally.
B. Support and Resistance Levels
Resistance Zone (Highlighted in Beige, Upper Range)
This level represents a historically significant supply area where selling pressure is expected.
Price action shows multiple rejections at this level, indicating the presence of strong resistance.
The red downward arrow further confirms that this level is acting as a cap on price movement.
Support Zone (Highlighted in Beige, Lower Range)
This area previously served as a strong demand level, where buyers stepped in, reversing the price.
The green upward arrow suggests that it played a critical role in the prior bullish move.
C. Key Price Levels
All-Time High (ATH) Marked at ~0.007155
This represents the historical peak price, which serves as a potential long-term resistance.
Stop-Loss Placement (~0.006959)
This is placed above the resistance level to manage risk in case of a false breakout.
Target Level (~0.006178)
Based on the wedge height, this level is calculated as the measured move after a breakdown.
2. Price Action & Market Sentiment
A. Recent Bullish Move
The market has been in a strong uptrend since hitting the support zone.
This move was characterized by higher lows and higher highs, reinforcing bullish momentum.
However, momentum appears to be weakening as the price struggles to break through the resistance.
B. Confirmation of a Bearish Reversal
The price has touched the upper resistance zone multiple times but failed to break through.
The trendline breakdown (expected move) suggests sellers are stepping in.
A lower high formation is seen as an early warning of a reversal.
3. Trade Setup: Short Position Strategy
This setup aligns with the principles of technical analysis, utilizing the Rising Wedge as a bearish reversal pattern.
A. Entry Strategy
Sell Entry Trigger: Enter a short trade upon a confirmed breakdown below the lower trendline.
Retest Confirmation: Ideally, wait for a pullback to the broken trendline before shorting to avoid false signals.
B. Risk Management
Stop-Loss Placement: Above the resistance zone at 0.006959, to protect against an invalidation.
Take-Profit Target: Set at 0.006178, calculated based on the wedge’s height projection.
C. Reward-to-Risk Ratio (RRR)
RRR = 2:1 or higher
The target level offers a risk-reward ratio that justifies the trade setup.
4. Summary & Final Outlook
Bearish Signals:
✅ Rising Wedge Pattern – A strong reversal indicator.
✅ Lower Highs and Weak Momentum – Suggests selling pressure.
✅ Failure to Break Resistance – Indicates bullish exhaustion.
✅ Projected Target Based on Wedge – Price expected to reach 0.006178.
Neutral Considerations:
If price does not break the lower trendline, the pattern is not validated.
If a false breakdown occurs, prices may briefly recover before falling.
Bullish Invalidation:
If the price breaks above 0.006959 and sustains above resistance, the bearish setup is invalidated.
Final Verdict:
📉 Bearish Bias – The market setup favors a downside move upon a confirmed breakdown.
🎯 Target: 0.006178 (Key support level).
⚠️ Risk: If the price does not break lower, consolidation may occur before a clearer move.

JPY/USD: Bearish Triangle Pattern Breakout Towards TargetChart Pattern: Triangle Pattern
Pattern Description
Type: The chart identifies a Triangle Pattern, which is a type of consolidation pattern that can act as either a continuation or reversal pattern depending on the preceding trend and the breakout direction. Triangles are characterized by converging trendlines, indicating a period of indecision in the market as the price range narrows.
Specific Type: This appears to be a Symmetrical Triangle, as the upper and lower trendlines converge at a similar angle, suggesting neither buyers nor sellers have clear control during the consolidation phase.
Appearance on the Chart:
The Triangle Pattern is marked with two converging trendlines:
Upper Trendline (Resistance): Connects the lower highs, sloping downward.
Lower Trendline (Support): Connects the higher lows, sloping upward.
The pattern began forming around March 27, after a sharp downtrend, and continued until the breakout on April 2, 2025.
Breakout Direction:
Symmetrical Triangles can break out in either direction, but they often continue the preceding trend. In this case, the preceding trend was bearish (a sharp decline from 0.006720 to 0.006640), and the breakout is to the downside, confirming a bearish continuation.
The chart shows the price breaking below the lower trendline of the triangle around April 2, 2025, with a strong bearish candle, indicating a confirmed bearish breakout.
Key Levels and Trading Setup
1. Support Level
A horizontal support zone is marked around 0.006640 (approximately 0.00664–0.00665).
This level acted as a base during the triangle formation, with the price bouncing off this zone multiple times (e.g., on March 28 and March 31).
The price has now broken below this support, turning it into a resistance level on any potential retest.
2. Resistance Level
A resistance zone is marked around 0.006705 (approximately 0.00670–0.00671).
This level corresponds to a previous high within the triangle and aligns with the upper boundary of the triangle at the time of the breakout.
After the breakout, this resistance level is where the stop loss is placed, as a move back above this level would invalidate the bearish setup.
3. Target
The target for the breakout is projected at 0.006599 (approximately 0.00660).
This target is likely calculated by measuring the height of the triangle at its widest point (from the highest high to the lowest low within the pattern) and projecting that distance downward from the breakout point.
The chart indicates a potential move of -0.000604 (-0.96%), which aligns with the distance from the breakout level (around 0.006654) to the target (0.006599).
4. Stop Loss
A stop loss is suggested above the resistance level at 0.006705.
This placement ensures that if the breakout fails and the price moves back above the triangle’s lower trendline (now acting as resistance), the trade is exited with a manageable loss.
Trading Setup Summary
Entry:
The setup suggests entering a short (sell) position after the price breaks below the lower trendline of the Triangle Pattern, which occurred around April 2, 2025. The breakout is confirmed by a strong bearish candle closing below the trendline at approximately 0.006654.
Stop Loss:
Place a stop loss above the resistance level at 0.006705 to protect against a false breakout or reversal. The distance from the breakout level (0.006654) to the stop loss (0.006705) is 0.000051, representing the risk on the trade.
Take Profit/Target:
Aim for the target at 0.006599, which is the projected price objective based on the triangle’s height. The distance from the breakout level to the target is 0.000055, or a 0.96% move.
Risk-Reward Ratio:
The risk is 0.000051 (from 0.006654 to 0.006705), and the reward is 0.000055 (from 0.006654 to 0.006599), giving a risk-reward ratio of approximately 1:1.08 (0.000055 / 0.000051). While this ratio is slightly above 1:1, it’s on the lower side for a typical trading setup, so traders should ensure high confidence in the breakout.
Additional Observations
Price Action Context:
Before the triangle formed, the price experienced a sharp decline from 0.006720 (March 23) to 0.006640 (March 27), indicating a strong bearish trend.
The triangle represents a consolidation phase within this downtrend, and the downside breakout suggests a continuation of the bearish momentum.
Volume and Momentum:
The chart doesn’t display volume or momentum indicators (e.g., RSI, MACD). However, a typical confirmation of a triangle breakout would include:
An increase in volume on the breakout candle, indicating strong selling pressure.
Bearish momentum signals, such as an RSI below 50 or a bearish MACD crossover.
Traders might want to check these indicators for additional confirmation of the breakout’s strength.
Timeframe:
This is a 1-hour chart, so the setup is intended for short-term trading, with the target potentially being reached within a few hours to a day.
Market Context:
USD/JPY is influenced by factors like U.S. dollar strength, Japanese yen safe-haven demand, and interest rate differentials. A bearish move in USD/JPY could be driven by a stronger yen (e.g., due to risk-off sentiment) or a weaker dollar (e.g., due to dovish U.S. economic data).
Conclusion
The TradingView idea presents a bearish setup for USD/JPY based on a Symmetrical Triangle Pattern on the 1-hour chart. The price has broken below the triangle’s lower trendline, confirming a bearish continuation with a target of 0.006599. The setup includes a stop loss at 0.006705 to manage risk, offering a risk-reward ratio of approximately 1:1.08. Key levels to watch include the former support (now resistance) at 0.006640 and the resistance at 0.006705. Traders should consider additional confirmation from volume and momentum indicators, as well as broader market conditions, before executing the trade. Since this chart is from April 2, 2025, market conditions may have evolved, and I can assist with searching for more recent data if needed!

Triangle Breakout in JPY/USD – Bullish Move Ahead?This TradingView chart represents a detailed technical analysis setup for the Japanese Yen (JPY) against the U.S. Dollar (USD). The main focus of the chart is a symmetrical triangle pattern breakout, a common formation that signals potential price movement.
In this detailed breakdown, we will analyze the following aspects:
Technical Pattern: Symmetrical Triangle Formation
Support and Resistance Levels
Breakout Confirmation
Trading Setup Explanation
Risk Management Strategy
Market Expectations (Bullish & Bearish Scenarios)
Conclusion & Trading Plan
1. Technical Pattern: Symmetrical Triangle Formation
The chart showcases a symmetrical triangle, which is a continuation pattern that typically occurs in trending markets. It indicates a period of consolidation where buyers and sellers struggle for dominance, leading to an eventual breakout.
Characteristics of the Symmetrical Triangle in This Chart:
Converging Trendlines:
The upper trendline (resistance) is sloping downward, showing lower highs.
The lower trendline (support) is sloping upward, showing higher lows.
Apex Formation:
As the price moves closer to the triangle's apex, volatility decreases, creating a squeeze effect.
Breakout Possibility:
Once price reaches a critical point, a breakout is expected in either direction.
Why is This Pattern Important?
Symmetrical triangles suggest that the market is indecisive, but once a breakout occurs, it can trigger a strong price movement.
Traders wait for the breakout direction to confirm the trade before entering a position.
2. Key Support and Resistance Levels
Support and resistance levels are crucial for identifying potential entry, stop-loss, and target areas.
Resistance Level:
A horizontal resistance zone (highlighted in beige) is drawn at the top.
This zone represents historical price rejection levels, where sellers have previously stepped in.
A confirmed breakout above this level would indicate strong bullish momentum.
Support Level:
The lower support zone (marked in blue) acts as a buying interest area.
Price has bounced off this zone multiple times, confirming it as a strong support level.
A break below this zone would signal a bearish reversal.
Trendline Support:
The lower boundary of the symmetrical triangle also acts as dynamic support.
If price respects this trendline, it suggests bullish strength leading to a breakout.
3. Breakout Confirmation & Market Reaction
The most important part of the setup is the breakout, which occurs when the price successfully moves beyond the triangle's trendline resistance.
Key Observations from the Chart:
Breakout Zone:
The breakout occurs near the right edge of the triangle (circled in red).
The price breaks above the upper trendline, confirming a bullish breakout.
Confirmation Candle:
A bullish candle follows the breakout, confirming buying pressure.
Traders should wait for a retest of the trendline before entering.
Volume Consideration:
Strong breakout moves are typically accompanied by a rise in volume, increasing the likelihood of follow-through.
4. Trading Setup Explanation
This trade follows a trend-following breakout strategy, where traders capitalize on price momentum after confirmation.
Entry Point:
The ideal entry is just above the breakout candle.
Traders can also wait for a retest of the broken trendline before entering.
Stop Loss Placement:
The stop loss is placed slightly below the previous swing low at 0.006652.
This prevents excessive drawdowns in case of a false breakout.
Profit Target Calculation:
The profit target is set at 0.006795, which is calculated based on:
The height of the triangle formation projected from the breakout point.
The next major resistance level, aligning with historical price action.
5. Risk Management Strategy
Risk management is a critical component of any trading strategy. Here’s how it is applied in this setup:
Risk-to-Reward Ratio (RRR):
A good trade setup maintains an RRR of at least 2:1.
If the stop loss is 33 pips (0.000033) and the target is 112 pips (0.000112), the RRR is 3:1, making this a high-probability trade.
Position Sizing Consideration:
Risk per trade should be limited to 1-2% of the total account balance.
Leverage should be used cautiously, as breakouts can sometimes retest the breakout zone before continuing.
6. Market Expectations (Bullish & Bearish Scenarios)
Bullish Scenario (Successful Breakout):
✅ If price sustains above the breakout level, it will likely continue to rally toward the target at 0.006795.
✅ A strong bullish momentum candle would confirm further buying pressure.
✅ If volume supports the breakout, trend continuation is highly probable.
Bearish Scenario (False Breakout or Reversal):
❌ If price falls back inside the triangle, it indicates a false breakout.
❌ If price closes below 0.006652, bears take control, and price may drop further.
❌ A breakdown below the support level would shift the market sentiment bearish.
7. Conclusion & Trading Plan
This chart presents a classic symmetrical triangle breakout trade with a clear entry, stop-loss, and target strategy.
Summary of Trading Plan:
Component Details
Pattern Symmetrical Triangle
Breakout Direction Bullish
Entry Point Above the breakout confirmation candle
Stop Loss 0.006652 (below support)
Take Profit (Target) 0.006795
Risk-to-Reward Ratio Favorable (3:1)
Market Bias Bullish (if price sustains above breakout)
Final Considerations:
Always wait for confirmation before entering.
Monitor volume and price action for additional validation.
Stick to the risk management plan to minimize losses.
If executed correctly, this setup offers a high-probability trade with a strong risk-to-reward ratio, making it a profitable trading opportunity in the JPY/USD market.

JPY/USD 4H Chart Analysis – Head & Shoulders Breakdown & BearishThis detailed technical analysis covers a Head & Shoulders pattern formation on the 4-hour chart of JPY/USD, highlighting a potential bearish reversal setup. The pattern suggests a shift from an uptrend to a downtrend, supported by a trendline breakdown and key resistance & support levels.
1️⃣ Understanding the Chart Pattern: Head & Shoulders (H&S)
📉 What is the Head & Shoulders Pattern?
The Head & Shoulders (H&S) is a classic bearish reversal pattern that appears after a prolonged uptrend, signaling a shift in market sentiment from bullish to bearish. It consists of three main parts:
Left Shoulder: A peak followed by a retracement.
Head: A higher peak, indicating the last strong bullish attempt.
Right Shoulder: A lower peak, failing to reach the height of the head, showing weakening momentum.
Neckline: A crucial support level that connects the lows of the shoulders. A confirmed break below this neckline is the trigger for a bearish continuation.
📊 Breakdown of the Pattern in This Chart
Left Shoulder (First Peak): The price made a high and then pulled back.
Head (Higher Peak): The market made another higher high but failed to sustain it, indicating exhaustion.
Right Shoulder (Lower Peak): A weaker attempt to push higher, but price failed to break previous highs, confirming the loss of bullish strength.
Neckline Breakout: The dotted trendline shows the ascending support that was eventually broken, confirming bearish momentum.
2️⃣ Key Technical Levels & Market Structure
Understanding the important levels in the market is crucial for setting up an effective trade.
🟧 Resistance Zone (Supply Area)
The resistance level, marked in a beige box, is located around 0.006800.
Price was rejected multiple times from this zone, confirming strong selling pressure.
The head of the pattern was formed in this region before a sharp drop.
🔵 Support Level (Neckline & Demand Area)
The neckline of the Head & Shoulders pattern was acting as support before being broken.
This level was tested multiple times before the final breakdown.
Once broken, it turned into a resistance level, meaning price may pull back to this area before continuing downward.
📉 Trendline Breakout (Bearish Confirmation)
A dashed trendline was previously supporting the uptrend but was broken, confirming the bearish shift in market structure.
This signals a trend reversal and a possible extended move lower.
3️⃣ Trading Strategy & Execution
A well-planned entry, stop loss, and take-profit strategy is essential for managing risk effectively.
📌 Entry Strategy (Short Setup)
Ideal Entry: Look for price to pull back to the neckline (previous support turned resistance).
Confirmation: Watch for bearish candlestick patterns such as:
Bearish engulfing
Pin bar rejection
Shooting star
Lower highs forming near the neckline
A rejection in this zone confirms seller dominance and a high-probability short setup.
📌 Stop Loss Placement
The Stop Loss is placed above the right shoulder at 0.006725.
This ensures protection from false breakouts or unexpected bullish moves.
📌 Profit Target Projection
Take-Profit Target: The projected move suggests a target at 0.006493.
This aligns with previous structural support, increasing its significance.
The measured move for Head & Shoulders suggests that price could fall further after confirmation.
Risk-Reward Ratio
The Risk (Stop Loss): Around 50 pips.
The Reward (Profit Target): Around 180 pips.
This results in a Risk-Reward Ratio of approximately 1:3, making it an attractive trade.
4️⃣ Market Sentiment & Expected Price Movement
📉 Bearish Scenario (Most Likely)
Price retests the neckline but fails to break above it.
Sellers step in, rejecting the resistance level, leading to further downside.
Price targets the next major support at 0.006493, completing the Head & Shoulders move.
📈 Bullish Scenario (Alternative)
If price reclaims the neckline and moves back above 0.006725, the pattern is invalidated.
This could lead to a bullish continuation back toward previous highs.
In this case, traders should cut losses early and avoid forcing a short trade.
5️⃣ Risk Management & Best Practices
1️⃣ Position Sizing:
Risk only 1-2% of your account per trade to maintain long-term profitability.
2️⃣ Confirmation Before Entry:
Wait for price to reject the neckline resistance before entering short.
Avoid entering too early without clear bearish signs.
3️⃣ Monitor News & Fundamentals:
Major economic events, interest rate decisions, or central bank announcements could impact JPY/USD price action.
🔎 Final Conclusion: Bearish Outlook on JPY/USD
The Head & Shoulders breakdown signals a trend reversal from bullish to bearish.
The neckline breakout confirms seller control over the market.
The best short entry is on a pullback to previous support (now resistance).
Target at 0.006493, with a Stop Loss at 0.006725 ensures controlled risk.
📢 Trading Bias: Bearish 📉
💡 Watch for a retest & rejection before entering short.

JPY/USD Weekly Forecast – Falling Wedge Breakout & Bullish MoveChart Overview
This chart presents a technical analysis of the Japanese Yen (JPY) against the U.S. Dollar (USD) on a daily timeframe, published on TradingView. The setup is based on a Falling Wedge pattern, which has led to a bullish breakout, signaling a potential price rally. Let's break it down step by step.
1️⃣ Identifying the Pattern – Falling Wedge Formation
The primary pattern identified in the chart is a Falling Wedge, which is a well-known bullish reversal pattern.
Characteristics of the Falling Wedge in this Chart:
Two downward-sloping trendlines (black lines) forming a wedge shape.
Price makes lower highs and lower lows, but the distance between highs and lows gradually narrows.
The breakout occurs when price closes above the upper trendline, confirming a potential uptrend.
Key Observations:
✅ The pattern starts forming around September 2024 and continues until December 2024.
✅ A breakout occurs at the end of December 2024, confirming bullish momentum.
✅ After breaking out, the price retests the wedge's upper boundary, acting as new support before continuing upward.
2️⃣ Support & Resistance Zones – Key Price Levels
Support Level:
The support zone is marked in a beige rectangle at the bottom of the chart.
This is where buyers repeatedly stepped in, preventing further decline.
The price touched this area multiple times before reversing upwards, making it a strong demand zone.
Resistance Level:
The resistance zone is identified at the top of the chart (shaded beige area).
This level represents previous price peaks, where selling pressure was strong.
The price is expected to face some resistance when approaching this zone.
3️⃣ Trend Reversal Confirmation & Bullish Structure
After breaking out of the falling wedge, the price has started forming higher highs and higher lows, indicating an uptrend.
Key Trend Indicators:
✔ Curved blue dashed line suggests an upward trajectory, confirming a rounded bottom reversal.
✔ Price is following a trendline support, validating bullish sentiment.
✔ Momentum is strong, and buyers are in control after the breakout.
4️⃣ Trading Setup – Entry, Stop Loss & Take Profit
This analysis is structured into a trading plan with clear risk management.
📌 Entry Point (Buy Confirmation)
Entry is ideal on a retest of the breakout zone or a continuation of the bullish structure.
The recent higher low serves as a great point to confirm trend continuation.
📌 Stop-Loss Placement
Stop-loss is placed at 0.006465 (marked in blue), below the latest support.
This level ensures protection against false breakouts.
📌 Take Profit Target
The target is set at 0.007128, aligning with historical resistance.
If momentum remains strong, the price might push even higher.
5️⃣ Risk-to-Reward Ratio (RRR) & Trade Justification
Risk-to-Reward Analysis:
Stop-Loss: 0.006465 (below support)
Entry Price: Around 0.006671
Target Price: 0.007128
Risk-to-Reward Ratio: Approximately 1:2.5, meaning for every $1 risked, there's a $2.5 potential gain.
Trade Justification:
✔ Falling Wedge breakout is confirmed.
✔ Retest of broken resistance turned support gives an ideal entry.
✔ Bullish trend structure supports the upside move.
✔ Well-defined stop-loss and take-profit levels provide controlled risk exposure.
6️⃣ Final Thoughts & Conclusion
📌 This is a textbook bullish setup based on a Falling Wedge breakout. The combination of pattern breakout, trend structure, and strong support makes this a high-probability trade.
📌 Potential Risks to Watch:
If price fails to hold above stop-loss, it could indicate bullish weakness.
Major macroeconomic news or fundamental events can shift momentum.
📌 Overall Bias: ✅ Bullish towards the 0.007128 target, as long as the price remains above key support zones.

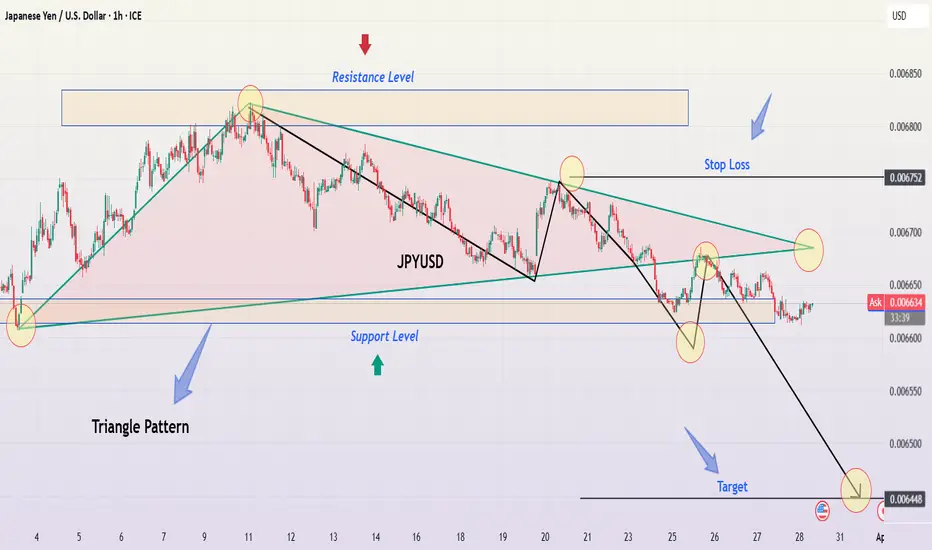
JPY/USD Descending Triangle Breakdown – Bearish Trading Setup📌 Overview: Understanding the Current Market Structure
This analysis focuses on the JPY/USD pair on the 1-hour timeframe, highlighting a well-defined descending triangle pattern, a classic bearish continuation setup. The price action indicates selling pressure increasing as lower highs form, while support remained relatively stable before ultimately breaking down.
This setup suggests a potential trend continuation to the downside, making it a compelling trade opportunity for short-sellers. Let's dive deeper into the technical breakdown, trading strategy, and market expectations.
📊 Technical Breakdown: Chart Pattern Analysis
1️⃣ The Descending Triangle Pattern: A Bearish Signal
The descending triangle is one of the most reliable continuation patterns in technical analysis, often leading to a breakdown when support is breached. This chart confirms the pattern through:
✅ Downward Sloping Resistance Line:
The price tested this level multiple times but was consistently rejected.
Lower highs indicate sellers are dominating and buyers are failing to push higher.
✅ Flat Support Level:
The price found strong support at a key horizontal level, bouncing off multiple times.
However, each bounce became weaker, signaling buyers losing strength.
✅ Breakout & Confirmation:
The final breakdown below support occurred with strong momentum.
The price has now turned previous support into resistance, a bearish confirmation.
🔎 Implication:
A descending triangle breakout to the downside often results in an extended downward move, aiming for the measured move target based on the triangle’s height.
2️⃣ Key Price Levels & Trading Zones
📌 🔴 Resistance Zone (Upper Triangle Boundary):
0.006700 – 0.006750
This level acted as a strong rejection zone, confirming lower highs.
It now serves as a resistance level after the breakdown.
📌 🟢 Support Level (Triangle Base):
This level previously held price from breaking lower multiple times.
However, with each bounce becoming weaker, it finally gave way.
Break & Close below this level confirms the bearish continuation.
📌 🎯 Target Projection (Based on Triangle Breakout):
0.006448 (Final Target) – This level aligns with historical price action and the triangle’s projected move.
📌 🚨 Stop Loss Placement:
Above the last swing high (~0.006752)
If price reclaims this zone, the bearish outlook becomes invalid.
📈 Price Action & Market Sentiment
3️⃣ Bearish Momentum & Breakdown Confirmation
✅ Lower Highs Indicate Weakness:
Buyers attempted multiple recoveries but were consistently rejected at lower levels.
This pattern suggests exhaustion in buying pressure.
✅ Breakout Candle Strength & Volume Confirmation:
The price broke support with strong momentum and increased volume, confirming sellers’ control.
A breakdown without volume is often a fakeout, but this chart shows clear momentum.
✅ Potential Retest Before Further Drop:
After a breakdown, price often retests the broken support before continuing lower.
A pullback to the resistance zone (~0.006650 - 0.006700) could offer an ideal short entry.
✅ Bearish Trend Confirmation:
The price remains below key resistance and continues forming lower lows.
The downtrend structure remains intact, reinforcing the bearish sentiment.
📉 Trading Strategy: How to Trade This Setup?
🔹 Entry Strategy:
Ideal Entry: Short after a pullback to broken support (~0.006650 - 0.006700).
Aggressive Entry: Short immediately on the breakdown if momentum remains strong.
🔹 Stop Loss Placement:
Place above last swing high (0.006752) to avoid being stopped out by noise.
Ensures protection against sudden bullish reversals or fakeouts.
🔹 Take Profit Targets:
✅ First Target: 0.006500 (Psychological level)
✅ Final Target: 0.006448 (Triangle measured move)
🔹 Risk Management:
Use a Risk-to-Reward ratio (RRR) of at least 1:2 for an optimal trade setup.
Never risk more than 2% of total capital per trade.
⚠️ Market Outlook & Key Watchpoints
📌 Scenario 1: Bearish Continuation (High Probability)
If price retests the broken support and faces rejection, expect further downside.
Target remains at 0.006448.
📌 Scenario 2: Fake Breakdown & Bullish Reversal (Low Probability)
If price closes above 0.006750, it invalidates the bearish setup.
In that case, a bullish move towards 0.006800+ is possible.
📢 Final Thoughts:
The bearish breakout is clear, but waiting for a proper pullback before entry is ideal.
Volume confirmation is crucial to avoid fakeouts.
If support turns into resistance, a high-probability short trade is set up.
🔹 What’s your take on this setup? Will JPY/USD reach its target? Drop your thoughts below! 🚀
#JPYUSD #ForexTrading #TechnicalAnalysis #PriceAction
JPY/USD Technical Analysis – Bullish Breakout from Falling WedgeIntroduction
The JPY/USD chart showcases a classic falling wedge pattern, a strong bullish reversal signal. This pattern is characterized by converging downward-sloping trendlines, indicating a weakening bearish momentum. Eventually, buyers stepped in, leading to a breakout to the upside. This analysis breaks down key elements, including support and resistance zones, trendlines, trading strategy, and risk management.
1. Breakdown of the Chart Pattern
A. The Falling Wedge Formation (Bullish Reversal Pattern)
A falling wedge is a bullish technical pattern that forms when the price consolidates within two downward-sloping trendlines that converge over time. This signals that selling pressure is decreasing and a reversal may be near.
Downtrend Structure: The price was previously in a consistent downtrend, making lower highs and lower lows, which formed the wedge.
Breakout Confirmation: Once the price broke above the upper trendline, the pattern was confirmed, indicating the start of a bullish move.
Retest Possibility: Often, after a breakout, the price retests the upper trendline before continuing higher. If it holds, it strengthens the bullish outlook.
B. Key Levels Identified in the Chart
1. Support Zone (Buying Area)
The price found strong support in the 0.006291 – 0.006500 region.
Buyers stepped in, preventing the price from dropping further.
This support level coincides with the bottom of the wedge, further validating its importance.
2. Resistance Zone (Profit Target)
The 0.007100 – 0.007200 area is a major resistance level where sellers have previously dominated.
If the price reaches this level and consolidates, traders will look for either a breakout or a rejection.
A break above 0.007200 would indicate further bullish continuation.
3. Trendlines & Curve Formation
A curved trendline in the chart suggests a gradual transition from bearish to bullish momentum.
The dotted ascending trendline now acts as dynamic support, helping the price sustain its bullish move.
2. Trading Strategy & Risk Management
A. Entry Strategies
Traders have two primary ways to enter this trade:
Aggressive Entry:
Enter immediately after the breakout of the wedge.
Higher risk but captures early momentum.
Conservative Entry:
Wait for a pullback to the trendline before entering.
Lower risk as it confirms trend continuation.
B. Take Profit Targets
Primary Target: 0.007117 (Resistance level from previous highs).
Extended Target: 0.007200 (Next significant resistance).
C. Stop Loss Placement
Below the recent swing low at 0.006291 to protect against false breakouts.
Ensures a favorable risk-to-reward ratio.
3. Market Sentiment & Confirmation Signals
✅ Bullish Confirmation
Breakout from the falling wedge
Price holding above the trendline
Higher highs and higher lows formation
Increased buying volume
⚠️ Bearish Risks & Invalidations
A break below the trendline would indicate weak momentum.
If the price fails to hold support, it could reverse downward.
Low volume on the breakout could signal a fake breakout.
4. Final Thoughts
This setup provides a high-probability trading opportunity following the breakout from a falling wedge pattern. The risk-to-reward ratio is favorable, making it an ideal setup for trend-following traders. However, patience is key—waiting for a successful retest before entering can minimize risks. If the price maintains momentum, we could see a rally toward the 0.007100 – 0.007200 resistance zone in the coming weeks. 🚀

JPY/USD 4H Chart Analysis – Head & Shoulders BreakdownThis JPY/USD 4-hour chart showcases a Head & Shoulders (H&S) pattern, a well-known bearish reversal pattern signaling a potential downtrend after an extended bullish run. The breakdown of the neckline support and the trendline breakout are key confirmations of a shift in momentum, making this a high-probability trading setup.
📌 1️⃣ Understanding the Head & Shoulders Pattern
The Head & Shoulders pattern is a classic reversal structure that forms after a prolonged uptrend. It consists of three peaks:
Left Shoulder: The first peak forms as buyers push the price higher, followed by a pullback.
Head: The price rallies again, making a higher peak, but sellers start to gain strength, causing another pullback.
Right Shoulder: A lower high is formed as buying pressure weakens, signaling exhaustion of the uptrend.
This pattern is significant because it suggests that bullish momentum is fading and that a potential trend reversal is underway.
📌 2️⃣ Trendline Breakout – Bearish Confirmation
Before the formation of the Head & Shoulders, the market was in a strong uptrend, supported by a rising trendline (dashed black line).
The price respected this trendline multiple times, acting as dynamic support.
However, after the right shoulder formation, the price broke below the trendline, indicating that selling pressure is increasing.
A trendline breakout after a reversal pattern strengthens the bearish case, increasing the likelihood of further downside movement.
📌 3️⃣ Key Resistance & Support Levels
Understanding the key price levels is essential for determining trade entries, stop-loss placements, and target zones.
📍 Resistance Zone (Stop-Loss Area):
0.006776 is the recent high and a key resistance level where sellers previously stepped in.
If the price reclaims this level, the bearish thesis could be invalidated, making it a logical place to set a stop-loss.
This level also aligns with the Head of the pattern, further reinforcing it as a strong supply zone.
📍 Support Level (Neckline Zone):
The neckline (horizontal support zone) was previously holding as support but has now been broken.
If the price pulls back to this area and rejects it, it could serve as a strong entry point for short trades.
A confirmed retest of the neckline would validate the breakdown, increasing the likelihood of a further decline.
📍 Bearish Target (Profit-Taking Zone):
The price is projected to decline toward 0.006457, which is derived by measuring the height of the Head & Shoulders pattern and projecting it downward.
This level also coincides with historical support, making it a strong take-profit area.
If bearish momentum continues, further downside targets may come into play.
📌 4️⃣ Trading Plan – Execution Strategy
This setup provides a clear structure for planning a high-probability short trade.
✅ Entry Strategy:
Option 1 (Aggressive Entry): Enter a short trade immediately after the breakdown of the neckline.
Option 2 (Conservative Entry): Wait for a retest of the broken neckline as resistance before entering a short position.
🚀 Stop-Loss Placement:
Above 0.006776 (recent resistance & Head of the pattern).
Ensures protection from a potential false breakout.
🎯 Take-Profit Strategy:
First target: 0.006457 (measured move of the pattern).
Extended target: Lower psychological support if momentum continues downward.
📌 5️⃣ Market Sentiment & Additional Considerations
While this technical setup suggests a bearish outlook, traders should also consider:
🔸 Fundamental Factors: Economic data releases, interest rate decisions, and geopolitical events can impact market sentiment.
🔸 Volume Confirmation: A high-volume breakout strengthens the bearish bias, whereas weak volume may indicate a potential fake-out.
🔸 RSI & Momentum Indicators: Checking if the RSI is in overbought territory or showing bearish divergence can provide further confidence in the setup.
🔸 Psychological Levels: Traders should watch for price reactions near key round numbers, as these often act as support/resistance.
📌 6️⃣ Conclusion – Why This Setup is High Probability
This JPY/USD 4H chart presents a well-defined Head & Shoulders pattern, a classic reversal setup that indicates a shift from bullish to bearish momentum. The trendline breakout and neckline breach reinforce the bearish bias, making this a high-probability short trade opportunity.
💡 Key Takeaways:
✅ A confirmed trendline break + H&S pattern indicates a bearish reversal.
✅ Watch for a neckline retest as a potential short entry.
✅ Bearish target: 0.006457 with stop-loss above 0.006776.
✅ Consider fundamental factors & market sentiment for additional confirmation.
🔽 Overall Bias: Bearish 📉
#JPYUSD #ForexTrading #HeadAndShoulders #PriceAction #TradingSetup #TrendReversal

JPY/USD Head & Shoulders Breakdown – Full Professional Analysis1. Introduction to the Chart Pattern
The JPY/USD chart on the 1-hour (H1) timeframe displays a well-defined Head & Shoulders (H&S) pattern, which is a well-known bearish reversal pattern in technical analysis. This pattern signals the potential end of the previous uptrend and the beginning of a downward move.
A Head & Shoulders pattern consists of three main components:
Left Shoulder: The price rallies to a peak, then retraces.
Head: The price rises higher than the left shoulder, marking the highest point before declining.
Right Shoulder: A lower peak compared to the head, indicating weakening bullish strength.
Neckline: The horizontal support level that, once broken, confirms the bearish trend.
2. Key Levels & Market Structure
🔹 Resistance Level (Supply Zone)
The blue box at the top represents the resistance area, where price action was repeatedly rejected.
This indicates strong selling pressure at this level, preventing further bullish momentum.
🔹 Support Level (Neckline)
The horizontal blue line acts as the support level or neckline of the H&S pattern.
Price has tested this area multiple times, confirming it as a crucial level for trend continuation or reversal.
🔹 Trend Line (Dynamic Support)
The black dashed trend line represents the previous uptrend, which provided support before being violated.
The break of this trend line suggests a weakening bullish structure and increased chances of a bearish move.
3. Breakdown of the Head & Shoulders Pattern
Initial Uptrend:
The market was in a strong uptrend before forming the Head & Shoulders pattern.
Buyers pushed the price higher, making higher highs and higher lows.
Formation of Left Shoulder:
Price reached a peak and then retraced, forming the left shoulder as sellers entered the market.
Formation of the Head:
A strong rally followed, breaking the left shoulder’s peak and reaching a new high, forming the head.
However, buyers started losing momentum, leading to another retracement.
Formation of Right Shoulder:
The price made another attempt to move upward but failed to surpass the head’s high, forming the right shoulder.
This signaled a reduction in bullish strength and potential trend exhaustion.
Neckline Breakdown (Bearish Confirmation):
The price dropped below the neckline (support level), confirming a bearish reversal.
This is the official entry signal for traders looking for a short setup.
4. Expected Market Behavior & Trading Setup
📉 Bearish Confirmation Steps:
Neckline Retest: The price might retest the broken neckline before continuing downward.
Bearish Candlestick Patterns: Look for rejection signals like bearish engulfing or shooting star formations.
Volume Increase on Breakdown: Strong selling pressure confirms the trend continuation.
🎯 Potential Take Profit Levels:
1️⃣ Target 1 (TP1): 0.006492 – This is a short-term support level, where the price might pause before further decline.
2️⃣ Target 2 (TP2): 0.006430 – A stronger support zone, where sellers may take profits.
🚨 Stop Loss Placement:
A stop-loss should be placed above the right shoulder to protect against false breakouts.
This ensures a favorable risk-to-reward ratio.
5. Risk Management & Market Conditions
✅ Entry Strategy: Wait for a retest of the neckline for a higher probability short trade.
✅ Risk-to-Reward Ratio: Ideally, aim for 1:2 or 1:3 to ensure profitability.
✅ Market Catalysts: Be cautious of fundamental news events, as they can cause unexpected volatility.
6. Conclusion: Bearish Outlook for JPY/USD
🔸 The Head & Shoulders pattern breakdown suggests a strong bearish trend reversal.
🔸 If the neckline holds as resistance, a short trade offers a high-probability setup.
🔸 Price may reach TP1 first, then potentially extend to TP2 if selling pressure persists.
📢 Final Verdict: Bearish trend confirmed; watch for short opportunities on retest.
📊 TradingView Tags:
#JPYUSD #HeadAndShoulders #ForexTrading #TechnicalAnalysis #BearishBreakout #ShortTrade

JPY/USD Technical Analysis - Head & Shoulder Chart Bearish Move1️⃣ Chart Type & Timeframe:
Market: Japanese Yen (JPY) / U.S. Dollar (USD)
Timeframe: 1-hour chart (H1)
Platform: TradingView
This is an intraday chart used by traders to identify short-term price action and trend reversals.
2️⃣ Identifying the Key Chart Pattern – Head & Shoulders
The dominant pattern on this chart is the Head & Shoulders (H&S), a well-known bearish reversal signal that forms after an uptrend. Let’s break it down:
A. Formation of the Pattern
Left Shoulder: The price forms a peak, then retraces down to a support level.
Head: A higher peak is formed, followed by another decline, indicating buyers are losing control.
Right Shoulder: The price attempts another rise but fails to reach the previous high, showing bearish momentum is increasing.
B. Neckline & Trendline Support
The neckline acts as a key support level. A break below it confirms the bearish move.
The trendline, which has been supporting price action for a while, is also at risk of breaking.
3️⃣ Key Support & Resistance Levels
Resistance Level (0.006750 - 0.006819):
This is the previous high area where sellers are active. A stop-loss is placed above this level.
Support Level (0.006567 - 0.006468):
Key demand zones where buyers may step in. These are the take profit (TP) levels.
4️⃣ Price Action & Expected Movement
📉 Bearish Outlook – A potential breakdown from the neckline and trendline would confirm further downside.
If price breaks the trendline, a pullback to retest resistance is expected before dropping further.
Take Profit (TP) 1: 0.006567 – Minor support, possible bounce.
Take Profit (TP) 2: 0.006468 – Stronger support, deeper correction possible.
🚨 Stop Loss: Above 0.006819, just beyond the right shoulder and all-time high (ATH).
5️⃣ Trading Strategy & Execution
💡 Entry Strategy:
Sell Breakout Entry: Short the market when the neckline/trendline is broken with strong volume.
Retest Confirmation: Wait for a pullback to the broken trendline and enter when price rejects it.
📌 Risk Management:
Risk-to-Reward Ratio: 1:2 or higher for an optimal setup.
Use trailing stop-loss to secure profits if TP1 is hit.
6️⃣ Market Psychology & Smart Money Behavior
The Head & Shoulders pattern reflects buyer exhaustion and increased seller strength.
Smart money often enters after the breakdown when weak hands get stopped out.
Conclusion: Trade with Confidence!
This chart presents a high-probability bearish trading opportunity based on a textbook Head & Shoulders formation, support/resistance dynamics, and trendline analysis. A disciplined approach with risk management will ensure better execution.
📉 Final Verdict: Bearish Breakdown Expected – Sell the Retest!
🔥 Tags for TradingView Idea:
#JPYUSD #ForexTrading #HeadAndShoulders #TechnicalAnalysis #BearishReversal #SmartMoney #PriceAction #RiskManagement #TradingSetup #TrendlineBreak

JPY/USD Trading Setup – Falling Wedge Breakout & Bullish MoveThe JPY/USD 1-hour chart is displaying a well-defined falling wedge pattern, which is typically a bullish reversal setup. This pattern forms as price action moves within converging trendlines, indicating that selling pressure is gradually weakening. The breakout from this pattern signals a potential trend reversal, and the price may be heading toward key resistance zones and an eventual bullish target.
This analysis will break down the chart structure, market psychology, key levels, and a trading setup to help traders make an informed decision.
1. Understanding the Falling Wedge Pattern
The falling wedge is a common price action pattern characterized by:
🔹 Lower highs and lower lows forming within two downward-sloping trendlines.
🔹 Decreasing volume, indicating that sellers are losing momentum.
🔹 A breakout above the upper trendline, confirming a shift in trend and signaling the start of bullish momentum.
Market Psychology Behind the Wedge Pattern:
📉 During the wedge formation, the market is in a downtrend, and sellers are in control. However, with each new lower low, the price finds strong support, and buyers start stepping in.
📊 As the wedge narrows, the downward momentum weakens, and sellers struggle to push the price lower. Eventually, demand exceeds supply, leading to a breakout to the upside, which is exactly what we see on this chart.
2. Key Levels & Market Structure
🔹 Support Zone & Reversal Area:
The support zone between 0.006660 - 0.006680 acted as a strong demand area, preventing further downside.
This is also labeled as a reversal area, meaning buyers were aggressive in this zone.
The final touch at this support led to a strong bounce, initiating the breakout.
🔹 Resistance Level:
The price is now approaching a key resistance area at 0.006780 - 0.006800, which previously acted as a supply zone.
A break and retest of this level would further confirm bullish momentum.
🔹 All-Time High (ATH) & Target Level:
The ATH region is marked on the chart as a historical resistance level where price faced strong selling pressure before.
If the current breakout holds, price action could aim for the 0.006851 target level, completing the measured move from the wedge pattern.
3. Trading Strategy & Execution Plan
📈 Entry Strategy:
There are two main ways to enter this trade:
1️⃣ Aggressive Entry: Enter immediately after the breakout above the falling wedge.
2️⃣ Conservative Entry: Wait for a breakout AND retest of the previous resistance turned support (0.006780 zone) before entering long.
🔻 Stop-Loss Placement:
To manage risk, traders should consider placing stop-loss orders:
Below the previous support zone (0.006660) to minimize downside risk.
Alternatively, below the wedge breakout point if using a tight stop-loss.
🎯 Take-Profit Targets:
1️⃣ First Target: 0.006780 (near-term resistance level).
2️⃣ Final Target: 0.006851 (based on wedge breakout projection).
4. Confirmation & Risk Management
🔎 Key Confirmation Factors for a Strong Breakout:
✅ Price breaks above the falling wedge with strong bullish candles.
✅ Volume increases, showing strong buying interest.
✅ RSI or other momentum indicators confirm bullish divergence.
⚠️ Potential Risks to Consider:
False Breakout: If price falls back inside the wedge, this could invalidate the bullish setup.
Rejection at Resistance: If buyers fail to push price above the 0.006780 resistance, it could lead to another consolidation.
5. Final Thoughts & Trading Outlook
📌 This JPY/USD chart presents a high-probability bullish setup due to the breakout from a falling wedge pattern.
📌 The breakout, strong support zone, and bullish price action indicate further upside potential.
📌 Risk management is key—waiting for confirmation can increase the probability of success.
💡 Final Verdict: Bullish Bias – Watching for Retest & Continuation to Target! 🚀

JPY/USD Breakout from Falling Channel – Bullish Trading SetupOverview of the Chart:
The Japanese Yen (JPY) against the U.S. Dollar (USD) 1-hour chart showcases a well-defined market structure, transitioning from a downtrend within a falling channel to a breakout with bullish momentum. The chart highlights critical support and resistance levels, a confirmed breakout, and a forecasted price movement that could indicate further bullish continuation.
This analysis will break down the chart patterns, technical indicators, and potential trade setups, providing a professional outlook on price action behavior.
Technical Breakdown of the Chart
1. Falling Channel Pattern – Downtrend Phase
The price had been trading within a descending channel, marked by two parallel trendlines (blue lines), indicating a controlled downtrend.
A falling channel is a bullish reversal pattern, as it signals that bearish momentum is weakening.
Within the channel, price action consistently created lower highs and lower lows, adhering to the structure of the pattern.
The red dashed trendline inside the channel acted as a dynamic resistance, rejecting price movements multiple times before the breakout.
📌 Key Observation: The falling channel pattern suggests accumulation, where selling pressure gradually diminishes, paving the way for a bullish reversal.
2. Support Zone & Bullish Breakout
The price eventually reached a strong horizontal support level (highlighted blue zone at the bottom), which acted as a critical demand area.
This support level had previously led to strong rebounds, making it a significant zone for potential reversals.
Bullish breakout confirmation:
A strong bullish candle closed above the upper boundary of the channel, breaking the trendline resistance.
The breakout suggests a shift in market structure from a downtrend to an uptrend, as buyers regained control.
The price has now moved above the previous resistance, confirming the bullish momentum.
📌 Key Takeaway: The breakout is a strong signal that sellers have lost control, and a potential bullish trend could emerge.
3. Resistance Zone – Key Barrier for Buyers
The next area of interest is the resistance level (highlighted in a blue rectangular zone).
This level has historically acted as a strong supply zone, where price previously struggled to break through.
If the price manages to sustain above this level, it would confirm bullish continuation toward higher price targets.
📌 Technical View: If buyers break past this resistance, it could lead to a strong bullish rally, reinforcing the new uptrend.
4. Target Projection & Forecasted Price Movement
The chart outlines a forecasted bullish path using a zigzag projection (black lines). Here’s the expected price action:
Short-Term Movement:
Price might face temporary resistance near the blue resistance zone.
A minor pullback or consolidation in this area is expected before further movement.
Retest of Support:
If price pulls back, it could retest the broken channel resistance or the support zone.
A successful retest and bounce would validate the strength of the breakout.
Bullish Continuation:
If the resistance zone is broken, price is likely to continue toward the target level of 0.006842, a previous swing high.
This level acts as the final upside target based on historical resistance levels.
📌 Key Insight: The market structure suggests that price will follow a higher-high, higher-low pattern, which is characteristic of an uptrend.

JPY/USD – Bullish Breakout After Falling Wedge!Let's take a deep dive into the JPY/USD price action and technical setup on the daily chart. The market has presented us with a falling wedge breakout, a strong bullish reversal signal. This pattern indicates a potential shift from the previous downtrend into an uptrend.
1️⃣ Falling Wedge Pattern – Bullish Reversal Signal
The falling wedge is a classic bullish reversal pattern. It forms when price action makes lower highs and lower lows within two converging trendlines. The key characteristic of this pattern is the decreasing selling pressure, leading to a breakout to the upside.
We observed a clear breakout from the wedge, indicating bullish momentum.
Buyers have stepped in strongly, pushing prices above the resistance zone.
This signals a potential trend reversal from bearish to bullish.
2️⃣ Breakout Confirmation & Key Levels
Once the price broke above the wedge, it faced a crucial resistance zone (marked in blue on the chart). After breaking this level, it has now turned into support—a strong technical confirmation.
Resistance Turned Support: The previous resistance is now acting as support, giving further confidence in the bullish move.
Retest Expected: After breakouts, the price often comes back to retest support before continuing higher. If it holds, it’s a good entry opportunity.
3️⃣ Entry, Stop Loss & Take Profit Targets
Based on the technical setup, here’s how we can approach this trade:
🔹 Entry: Ideal entry is around the current support zone after a successful retest.
🔹 Stop Loss: Placed below the support level at 0.006574 to minimize risk.
🔹 Take Profit (TP): The target price is set at 0.007126, aligning with the previous swing high.
4️⃣ Trade Outlook & Expected Movement
If the price holds above support, we expect a bullish continuation towards the target.
A minor pullback is possible before the next move higher.
If the price breaks below the support zone, it may invalidate the bullish setup.
📌 Final Thoughts
This setup is a high-probability bullish trade, backed by the falling wedge breakout and retest of a key level. However, always manage risk properly and wait for confirmation before entering the trade.
What do you think? Do you see further upside, or is this a false breakout? Drop your thoughts below! 👇
#JPYUSD #ForexTrading #TechnicalAnalysis #TradingView #BullishBreakout #ChartPatterns

USDJPY | Yen Futures Weekly FOREX Forecast: Feb 3-7thThis forecast is for the upcoming week, Feb 3 - 7th.
The Yen has been week for an extended amount of time, underperforming against the USD. But the tide might be changing, this NFP week. As the USD is reacting to a HTF selling zone over the last couple of weeks, the Yen is finding buyers during that same time. This could continue for the near term.
Enjoy!
May profits be upon you.
Leave any questions or comments in the comment section.
I appreciate any feedback from my viewers!
Like and/or subscribe if you want more accurate analysis.
Thank you so much!
Disclaimer:
I do not provide personal investment advice and I am not a qualified licensed investment advisor.
All information found here, including any ideas, opinions, views, predictions, forecasts, commentaries, suggestions, expressed or implied herein, are for informational, entertainment or educational purposes only and should not be construed as personal investment advice. While the information provided is believed to be accurate, it may include errors or inaccuracies.
I will not and cannot be held liable for any actions you take as a result of anything you read here.
Conduct your own due diligence, or consult a licensed financial advisor or broker before making any and all investment decisions. Any investments, trades, speculations, or decisions made on the basis of any information found on this channel, expressed or implied herein, are committed at your own risk, financial or otherwise.

Usdjpy ahead to 147.65Jpyusd ahead to 147.65, by my math, at least, maybe a little down more to make a divergence to go up again, but this is all about day ind3x, about dollar power, be careful, with and without the election day, I'm just selling and do nothing (seeing what happens) until election day
Have a good trading, everyone.
