JSWENERGY

JSW Energy trying to gain some energy and momentum.JSW Energy Ltd. engages in the business of power generation. It operates through the following business segments: Power Generation, Power Transmission, and Power Trading. The company was founded by Om Prakash Jindal on March 10, 1994 and is headquartered in Mumbai, India.
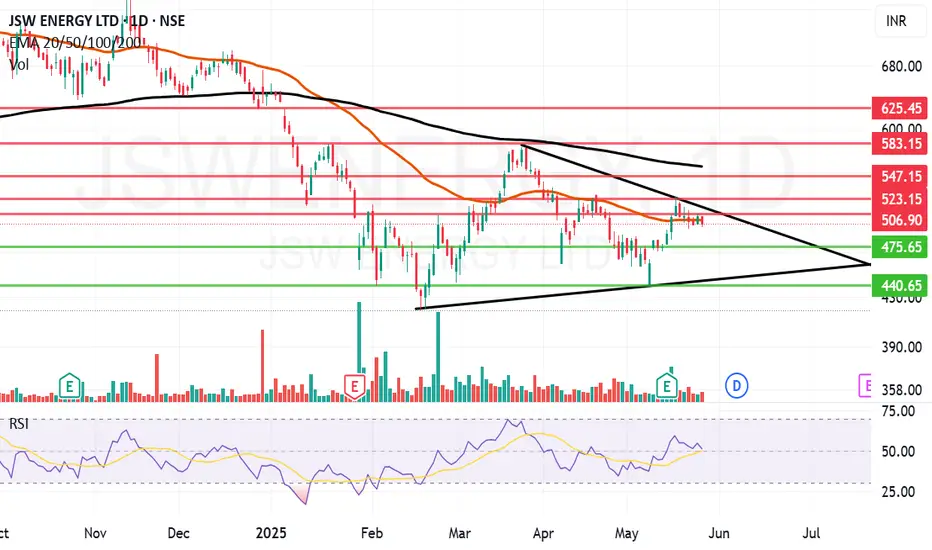
JSW Energy Ltd. Closing price is 497.4. The positive aspects of the company are Annual Net Profits improving for last 2 years, Consistent Highest Return Stocks over Five Years and MFs increased their shareholding last quarter. The Negative aspects of the company are high Valuation (P.E. = 45.2), Stocks Underperforming their Industry Price Change in the Quarter, Increasing Trend in Non-Core Income, Companies with Increasing Debt, Promoter decreasing their shareholding and Companies with high market cap, lower public shareholding.
Entry can be taken after closing above 507 Historical Resistance in the stock will be 528, 547 and 567. PEAK Historic Resistance in the stock will be 583 and 625. Stop loss in the stock should be maintained at Closing below 475 or 440 depending upon your risk taking ability.
Disclaimer: The above information is provided for educational purpose, analysis and paper trading only. Please don't treat this as a buy or sell recommendation for the stock or index. The Techno-Funda analysis is based on data that is more than 3 months old. Supports and Resistances are determined by historic past peaks and Valley in the chart. Many other indicators and patterns like EMA, RSI, MACD, Volumes, Fibonacci, parallel channel etc. use historic data which is 3 months or older cyclical points. There is no guarantee they will work in future as markets are highly volatile and swings in prices are also due to macro and micro factors based on actions taken by the company as well as region and global events. Equity investment is subject to risks. I or my clients or family members might have positions in the stocks that we mention in our educational posts. We will not be responsible for any Profit or loss that may occur due to any financial decision taken based on any data provided in this message. Do consult your investment advisor before taking any financial decisions. Stop losses should be an important part of any investment in equity.
JSWENERGY : at ease support zoneJSW Energy Ltd. (JSWENERGY)
Key Levels and Zones :
Current Price: ₹625.80 (-₹10.70, -1.68%)
Support and Buying Zones:
Extended Retracement Zone: ₹596.60 - ₹619.60
Wave C (Primary) Completion Zone: ₹594 - ₹610
Liquidity Sweep Zone: ₹553 - ₹565
Targets:
First Swing Target: ₹747.00
Second Target Zone: ₹825 - ₹851
Stop Loss: ₹540.00 (on failure of Wave C and extended retracement zone)
Chart Analysis :
Wave Patterns: The daily chart shows Elliott Wave patterns (Waves A, B, and C).
Wave C Completion Zone: ₹594 to ₹610 suggests a potential bullish reversal.
Change of Character (ChOCH): A shift in market sentiment is observed, indicating a likely trend change.
Future Price Projections :
Bullish Scenario:
If Wave C completes successfully, the price may rally towards the first swing target at ₹747.00 and the second target zone between ₹825 and ₹851.
Bearish Scenario:
Failure to hold the Wave C support zone could result in a drop to the stop-loss level around ₹540.00.
Conclusion :
The daily chart of JSW Energy highlights critical support and resistance levels. Traders can monitor these zones for strategic entry and exit opportunities, ensuring a favorable risk-reward ratio.
Disclaimer: This analysis is for educational purposes only and does not constitute financial advice. Always conduct your analysis or consult a financial advisor before making investment decisions.
#JSWEnergy #TradingPlan #ElliottWave #TechnicalAnalysis #StockMarket

JSW Energy looking Energetic JSW Energy Ltd. engages in the business of power generation. It operates through the following business segments: Power Generation, Power Transmission, and Power Trading.
JSW Energy Ltd. CMP is 688.95. The Positive aspects of the company are Company with decreasing Promoter pledge, High Volume, High Gain, Top Gainers and High Momentum Scores. The Negative aspects of the company are extremely high Valuation (P.E. = 61.5), Companies with Increasing Debt, Increasing Trend in Non-Core Income, High promoter stock pledges.
Entry can be taken after closing above 701 Targets in the stock will be 719, 738 and 756. The long-term target in the stock will be 773, 792 and 809. Stop loss in the stock should be maintained at Closing below 642 or 582 depending on your risk taking ability.
Disclaimer: The above information is provided for educational purpose, analysis and paper trading only. Please don't treat this as a buy or sell recommendation for the stock. We do not guarantee any success in highly volatile market or otherwise. Stock market investment is subject to market risks which include global and regional risks. We will not be responsible for any Profit or loss that may occur due to any financial decision taken based on any data provided in this message.

Jsw Energy ltd waiting for breakout (MS)Waiting for breakout
if they break the trendline and point c of the upper side then it goes to rocket
target ==>> 900
entry ==>> breakout of the trendline
SL == 680
This chart is only for educational purpose wait and watch

Double Moving Averages Crossover Swing Trade📊 Script: JINDALSTEL
📊 Nifty50 Stock: NO
📊 Sector: Steel
📊 Industry: Steel - Sponge Iron
⏱️ C.M.P 📑💰- 849
🟢 Target 🎯🏆 - 890
⚠️ Stoploss ☠️🚫 - 825
📊 Script: VTL
📊 Nifty50 Stock: NO
📊 Sector: Textiles
📊 Industry: Textiles - Cotton/Blended
⏱️ C.M.P 📑💰- 442
🟢 Target 🎯🏆 - 472
⚠️ Stoploss ☠️🚫 - 425
📊 Script: JSWENERGY
📊 Nifty50 Stock: NO
📊 Sector: Power Generation & Distribution
📊 Industry: Power Generation And Supply
⏱️ C.M.P 📑💰- 528
🟢 Target 🎯🏆 - 561
⚠️ Stoploss ☠️🚫 - 511
📊 Script: NYKAA
📊 Nifty50 Stock: NO
📊 Sector: E-Commerce/App based Aggregator
📊 Industry: Trading
⏱️ C.M.P 📑💰- 161
🟢 Target 🎯🏆 - 173
⚠️ Stoploss ☠️🚫 - 155
📊 Script: SUNPHARMA
📊 Nifty50 Stock: YES
📊 Sector: Pharmaceuticals
📊 Industry: Pharmaceuticals - Indian - Bulk Drugs
⏱️ C.M.P 📑💰- 1620
🟢 Target 🎯🏆 - 1692
⚠️ Stoploss ☠️🚫 - 1590
⚠️ Important: Always maintain your Risk & Reward Ratio.
✅Like and follow to never miss a new idea!✅
Disclaimer: I am not SEBI Registered Advisor. My posts are purely for training and educational purposes.
Eat🍜 Sleep😴 TradingView📈 Repeat 🔁
Happy learning with trading. Cheers!🥂

JSW breakout stock JSW has given a fresh breakout with volume on weekly chart.
levels marked over the chart.
Trade is invalid below the 455
targeting the levels of 552

JSWENERGY will break 700 days resistance 🤥Will it break high level support 📌 to reach new high in powe sector
Or it get rejected to white 🐻❄️ line 📌 below box 😂 huge crash
Let's watch 👀 stay with me 😉 i will update it 😜
Boost 🚀 post so u get updated on post when I am updating everything

JSWENERGYNSE:JSWENERGY
One Can Enter Now !
Or Wait for Retest of the Trendline (BO) !
Or wait For better R:R ratio !
Note :
1.One Can Go long with a Strict SL below the Trendline or Swing Low.
2. R:R ratio should be 1 :2 minimum
3. Plan as per your RISK appetite and Money Management.
Disclaimer : You are responsible for your Profits and loss, Shared for Educational purpose

JSW steel - long"JSW Steel has broken its all-time high today, ranging between 816 and 770. If you can get this share at any price within this range, you can consider investing in it, as it is expected to provide excellent returns in the near future."

JSW Energy breaking out?JSW Energy approaching trendline. Weekly RSI closed above 60 for the first time after Sep 2022. Will it breakout of the pattern?

jsw energy buy @ 274 target 274.30, 279 ascending triangle jsw energy buy @ 274 target 274.30, 279
ascending triangle breakout
risk reward 1
sl@253.80

JSW ENERGY- Daily Timeframe-Bullish patternNSE:JSWENERGY
From March-2023 Stock is taking rejection from bottom trendline and on the upper side sellers are trying to sell it around 275-277 levels (resistance zone).
However, the swing lows are shifting up side (Higher lows) which is a sign of strength, sellers are not able to drag it below previous swing.
Currently it has taken support on the trendline 5th time and it’s near its rejection zone.
Stock has good potential to go upside in upcoming weeks.
This is only for educational purpose, please manage your risk accordingly.

Jsw energyHey traders JSW is looking good If it gives breakout in any side we can take entry
support and resistance are on trendline

JSW ENERGYStrong Buy JSW ENERGY Closing Above 360 in Weekly Timeframe and SL is 325. Targets is Big in weekly timeframe. 1st target is 500 and 2nd target is 650.

JSWENERGY Positional up side viewNSE:JSWENERGY has done breakout and closed above its major resistance of 325.
My view is to take entry at level of 328 and hold it till target of 368.
My stoploss will be 308. Will exit from trade if price trade below level of 308.
Note: This is my personal analysis, only for learning.
Thanks.

JSW ENERGY target price levelThis stock is trading near the resistance level. the first resistance level is 345, this resistance level will break, and the target price is 395

Jsw energyjsw energy 1 day chart there is strong resistance at 365 and it is moving upside with a trendline

JSW Energy BreakoutThe stock has broken out and retested, therefore may undergo a reversal rally. Trade is supported by brokerage calls and Supports Nearby.
Risk Reward Ratio - 2:1
SL is placed below support zone & the lower trendline. The target is placed near resistance.

JSWENERGYThis stock is entraring banchmark index and sectorel index out parforme range.
Very upside movement in shortly.
All technical indicators are positive.


Fast pace return alerts!!!Stock which gives exponential return in previous month, consolidation happen and now consolidation process is almost complete, squeeze momentum indicator suggest that stock is now going in squeeze and probability of bounce from the current level, and now the Stock have high probability of going upward, hold until no bearish Candle is visible on heikin ashi, or any trand reverse sign in your trading
Stoploss-230
Warning- I am not a sebi registered advisor, I am giving my view on current trand, take the trand at your own risk and follow the stop-loss strictly

JSWENERGY LONG INTRADAY 14 JUN,2021Dear trader,
If u look at the chart of JSWENERGY (analysis based intraday only) the JSWENERGY Buy at 153.30 and
Target at 159
Best Buy at 152.
Our Best Buy is based on high quality research and when the instrument reaches this level , it’s a jackpot trade.
Best Buy level might be executed or might not be executed.
The chart clearly indicates Bullish Trend you can also see the candle stick patters for more indepth analysis.
In Intraday most important thing is to enter and exit points.
Our signals are based on analytics, algorithms, mathematical derivatives.
Always be a responsible trader, kindly trade only when you have maximum opportunity in the market with minimum risk and with keynotes like data, analysis and proper strategies.
Kindly message us for strategies and analysis
