Jswenergyanalysis

JSW Energy trying to gain some energy and momentum.JSW Energy Ltd. engages in the business of power generation. It operates through the following business segments: Power Generation, Power Transmission, and Power Trading. The company was founded by Om Prakash Jindal on March 10, 1994 and is headquartered in Mumbai, India.
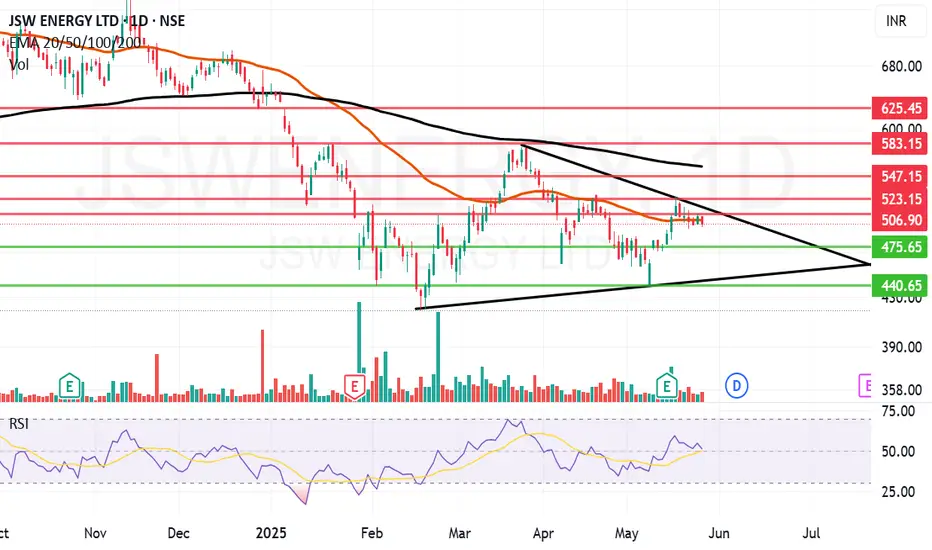
JSW Energy Ltd. Closing price is 497.4. The positive aspects of the company are Annual Net Profits improving for last 2 years, Consistent Highest Return Stocks over Five Years and MFs increased their shareholding last quarter. The Negative aspects of the company are high Valuation (P.E. = 45.2), Stocks Underperforming their Industry Price Change in the Quarter, Increasing Trend in Non-Core Income, Companies with Increasing Debt, Promoter decreasing their shareholding and Companies with high market cap, lower public shareholding.
Entry can be taken after closing above 507 Historical Resistance in the stock will be 528, 547 and 567. PEAK Historic Resistance in the stock will be 583 and 625. Stop loss in the stock should be maintained at Closing below 475 or 440 depending upon your risk taking ability.
Disclaimer: The above information is provided for educational purpose, analysis and paper trading only. Please don't treat this as a buy or sell recommendation for the stock or index. The Techno-Funda analysis is based on data that is more than 3 months old. Supports and Resistances are determined by historic past peaks and Valley in the chart. Many other indicators and patterns like EMA, RSI, MACD, Volumes, Fibonacci, parallel channel etc. use historic data which is 3 months or older cyclical points. There is no guarantee they will work in future as markets are highly volatile and swings in prices are also due to macro and micro factors based on actions taken by the company as well as region and global events. Equity investment is subject to risks. I or my clients or family members might have positions in the stocks that we mention in our educational posts. We will not be responsible for any Profit or loss that may occur due to any financial decision taken based on any data provided in this message. Do consult your investment advisor before taking any financial decisions. Stop losses should be an important part of any investment in equity.
JSWENERGY : at ease support zoneJSW Energy Ltd. (JSWENERGY)
Key Levels and Zones :
Current Price: ₹625.80 (-₹10.70, -1.68%)
Support and Buying Zones:
Extended Retracement Zone: ₹596.60 - ₹619.60
Wave C (Primary) Completion Zone: ₹594 - ₹610
Liquidity Sweep Zone: ₹553 - ₹565
Targets:
First Swing Target: ₹747.00
Second Target Zone: ₹825 - ₹851
Stop Loss: ₹540.00 (on failure of Wave C and extended retracement zone)
Chart Analysis :
Wave Patterns: The daily chart shows Elliott Wave patterns (Waves A, B, and C).
Wave C Completion Zone: ₹594 to ₹610 suggests a potential bullish reversal.
Change of Character (ChOCH): A shift in market sentiment is observed, indicating a likely trend change.
Future Price Projections :
Bullish Scenario:
If Wave C completes successfully, the price may rally towards the first swing target at ₹747.00 and the second target zone between ₹825 and ₹851.
Bearish Scenario:
Failure to hold the Wave C support zone could result in a drop to the stop-loss level around ₹540.00.
Conclusion :
The daily chart of JSW Energy highlights critical support and resistance levels. Traders can monitor these zones for strategic entry and exit opportunities, ensuring a favorable risk-reward ratio.
Disclaimer: This analysis is for educational purposes only and does not constitute financial advice. Always conduct your analysis or consult a financial advisor before making investment decisions.
#JSWEnergy #TradingPlan #ElliottWave #TechnicalAnalysis #StockMarket

JSW breakout stock JSW has given a fresh breakout with volume on weekly chart.
levels marked over the chart.
Trade is invalid below the 455
targeting the levels of 552

JSWENERGY Positional up side viewNSE:JSWENERGY has done breakout and closed above its major resistance of 325.
My view is to take entry at level of 328 and hold it till target of 368.
My stoploss will be 308. Will exit from trade if price trade below level of 308.
Note: This is my personal analysis, only for learning.
Thanks.

JSW ENERGY- DAILY TIME FRAME LONG SETUPThe Structure looks good to us, waiting for this instrument to correct and then give us these opportunities as shown on this instrument (Price Chart).
Note: its my view only and its for educational purpose only. only who has got knowledge about this strategy, will understand what to be done on this setup. its purely based on my technical analysis only (strategies). we don't focus on the short term moves, we look for only for Bullish or Bearish Impulsive moves on the setups after a good price action is formed as per the strategy. we never get into corrective moves. because it will test our patience and also it will be a bullish or a bearish trap. and try trade the big moves.
we do not get into bullish or bearish traps. we anticipate and get into only big bullish or bearish moves (Impulsive moves).
Just ride the bullish or bearish impulsive move. Learn & Know the Complete Market Cycle.
buy low and sell high concept. buy at cheaper price and sell at expensive price.
Keep it simple, keep it Unique.
please keep your comments useful & respectful.
Thanks for your support....
