#JTO/USDT Forming Bullish Wave #JTO
The price is moving within a descending channel on the 1-hour frame, adhering well to it, and is on its way to breaking it strongly upwards and retesting it.
We have a bounce from the lower boundary of the descending channel. This support is at 1.73.
We have a downtrend on the RSI indicator that is about to be broken and retested, supporting the upside.
There is a major support area in green at 1.65, which represents a strong basis for the upside.
Don't forget a simple thing: ease and capital.
When you reach the first target, save some money and then change your stop-loss order to an entry order.
For inquiries, please leave a comment.
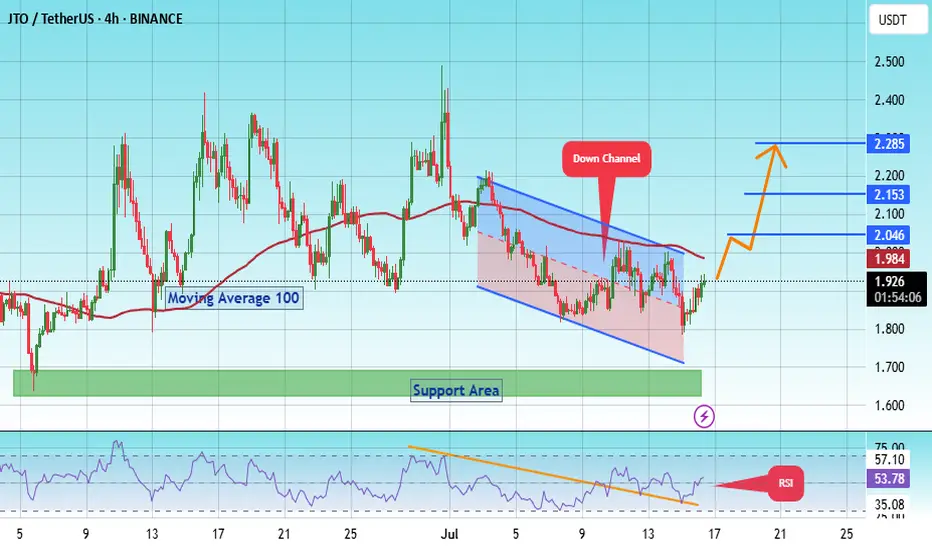
We have a trend to hold above the 100 Moving Average.
Entry price: 1.92.
First target: 2.046.
Second target: 2.15.
Third target: 2.28.
Don't forget a simple thing: ease and capital.
When you reach the first target, save some money and then change your stop-loss order to an entry order.
For inquiries, please leave a comment.
Thank you.
Jtobtc
#JTO/USDT#JTO
The price is moving within a descending channel on the 1-hour frame, adhering well to it, and is heading toward a strong breakout and retest.
We are experiencing a rebound from the lower boundary of the descending channel, which is support at 2.08.
We are experiencing a downtrend on the RSI indicator that is about to be broken and retested, supporting the upward trend.
We are heading toward stability above the 100 Moving Average.
Entry price: 2.136
First target: 2.22
Second target: 2.32
Third target: 2.40

JTO : Price at a critical point: Falling or rising?Hello friends
Given the long-term range that this currency has made, the price has now reached the bottom of the range, which is very sensitive, and this currency also has a token release, which can be a warning.
In case of a drop, we have identified important supports for you, so that you can buy with risk and capital management.
*Trade safely with us*

JTOUSDT Forming Bullish BreakoutJTOUSDT is showing a promising bullish setup as it trades within a clear accumulation zone, suggesting that a major breakout could be on the horizon. The chart highlights strong support where price has bounced multiple times, forming a solid base for a potential upward move. With good volume confirming renewed buying interest, the stage looks set for an expected gain of 50% to 60%+ if momentum continues to build. This level of price action is attracting the attention of smart money investors who are positioning early for the next leg up.
The recent price behavior indicates that JTOUSDT is approaching a decisive breakout level. The market structure shows that sellers are losing control, while buyers are stepping in aggressively around key demand zones. As the broader crypto market sentiment improves, coins like JTO that have established a clear support zone can benefit from additional capital inflow, amplifying the breakout potential. Traders should watch for a strong daily close above the resistance area to confirm the trend reversal.
Technical traders are eyeing JTOUSDT as a strong contender for mid-term gains due to its favorable risk-to-reward ratio. With liquidity building up and higher lows forming, the setup aligns well with classic breakout trading strategies. The projected upside, if confirmed, aligns with similar moves seen in altcoins following consolidation phases, which makes this trade idea even more compelling.
Keep monitoring trading volume and candlestick patterns closely for the next few sessions. A confirmed move above the resistance could lead to a rapid price expansion, rewarding patient traders. Managing risk with clear stop-loss levels below the support zone will be key to maximizing profit potential while protecting capital.
✅ Show your support by hitting the like button and
✅ Leaving a comment below! (What is You opinion about this Coin)
Your feedback and engagement keep me inspired to share more insightful market analysis with you!

#JTO/USDT#JTO
The price is moving within a descending channel on the 1-hour frame and is expected to break and continue upward.
We have a trend to stabilize above the 100 moving average once again.
We have a downtrend on the RSI indicator that supports the upward move with a breakout.
We have a support area at the lower limit of the channel at 1.95, acting as strong support from which the price can rebound.
Entry price: 2.00
First target: 2.057
Second target: 2.11
Third target: 2.19

JTOUSDT Forming Bullish WaveJTOUSDT is currently shaping a promising bullish wave pattern, signaling potential continuation of an upward trend in the coming days or weeks. This wave formation is often associated with renewed buying interest and signals that price action is building strong momentum for another leg higher. Coupled with a steady increase in trading volume, the technical structure suggests that the asset may soon experience a substantial breakout. Based on historical wave behavior and key support/resistance levels, an expected gain of 50% to 60% appears realistic.
Market interest around JTO has been growing, with investors closely watching its price behavior as it consolidates above recent lows. This consolidation phase is often a prelude to significant rallies, especially when backed by solid wave structure and volume confirmation. As more liquidity enters the market, JTOUSDT is positioned to attract both swing traders and long-term holders seeking medium-risk, high-reward opportunities.
From a technical perspective, the coin is forming higher lows while testing critical resistance zones. If it manages to clear those levels with conviction, price targets could range between the upper Fibonacci extensions and prior distribution zones. The growing market chatter and improving sentiment around the JTO project further support the bullish thesis.
Keep an eye on upcoming market catalysts and macro trends, as they could amplify the bullish momentum already forming on the JTOUSDT chart. With a disciplined approach, this could become one of the standout performers in the mid-cap altcoin segment in the near term.
✅ Show your support by hitting the like button and
✅ Leaving a comment below! (What is You opinion about this Coin)
Your feedback and engagement keep me inspired to share more insightful market analysis with you!

JTOUSDT Forming Symmetrical TriangleJTOUSDT has recently broken out of a well-defined symmetrical triangle pattern, signaling a potential bullish continuation. The breakout is backed by solid volume, indicating strong interest from market participants and confirming the breakout’s legitimacy. This technical setup often precedes a significant price rally, and with investor sentiment improving across altcoin markets, JTOUSDT could be set for a 60% to 70%+ move in the coming sessions.
The chart reveals that JTOUSDT has respected both trendlines over a prolonged period, forming a clear base and building momentum. Now that it has breached the resistance line, there is little overhead supply in the immediate region, which allows room for price expansion. This kind of breakout is typically seen in the early stages of a bullish cycle, often driven by new inflows and strong community backing.
Fundamentally, the project behind JTO continues to gain visibility, with increasing mentions across crypto forums and social media, suggesting that retail and institutional interest is growing. The token's liquidity is improving, and the breakout could attract momentum traders who were waiting for confirmation. If market sentiment remains favorable, the upside could be realized quicker than expected.
Traders and investors should monitor for a retest of the breakout level or continuation candles for a potential entry point. Given the confluence of technical strength and increasing attention on the project, JTOUSDT stands as a promising candidate for short-to-mid-term bullish opportunities.
✅ Show your support by hitting the like button and
✅ Leaving a comment below! (What is You opinion about this Coin)
Your feedback and engagement keep me inspired to share more insightful market analysis with you!

JTO Buy/Long Setup (1D)It appears that JTO is in a bearish pattern on the higher timeframe, but it shows a bullish structure on the lower timeframes and could move to the upside.
The trigger line has been broken, and we have a bullish CH (Change of Character) on the chart.
We are looking for buy/long positions around the SWAP zone.
A daily candle closing below the invalidation level would invalidate this outlook.
For risk management, please don't forget stop loss and capital management
When we reach the first target, save some profit and then change the stop to entry
Comment if you have any questions
Thank You

#JTO/USDT#JTO
The price is moving within a descending channel on the 1-hour frame, adhering well to it, and is heading for a strong breakout and retest.
We are seeing a bounce from the lower boundary of the descending channel, which is support at 1.57.
We have a downtrend on the RSI indicator that is about to break and retest, supporting the upward trend.
We are looking for stability above the 100 moving average.
Entry price: 1.60
First target: 1.64
Second target: 1.70
Third target: 1.76

JTO analysis (12H)It is one of the altcoins that does not have a clean chart but has a defined range for Sell and Buy.
The larger pattern on the chart appears to be a Diametric, and the price now seems to have entered wave F of this pattern.
In the red-circled area, we are looking for sell/short setups, while in the green zone, we are looking for buy/long positions.
For risk management, please don't forget stop loss and capital management
Comment if you have any questions
Thank You

#JTO/USDT#JTO
The price is moving in a descending channel on the 1-hour frame and is adhering to it well and is heading to break it strongly upwards and retest it
We have a bounce from the lower limit of the descending channel, this support is at a price of 2.45
We have a downtrend on the RSI indicator that is about to break and retest, which supports the rise
We have a trend to stabilize above the moving average 100
Entry price 2.67
First target 2.78
Second target 3.18
Third target 3.5

#JTO/USDT#JTO
The price is moving in a descending channel on the 1-hour frame and is expected to continue upwards
We have a trend to stabilize above the moving average 100 again
We have a descending trend on the RSI indicator that supports the rise by breaking it upwards
We have a support area at the lower limit of the channel at a price of 2.20
Entry price 2.48
First target 2.62
Second target 2.80
Third target 2.98

#JTO/USDT#JTO
The price is moving in a descending channel on the 12-hour frame and is sticking to it well
We have a bounce from the lower limit of the descending channel and we are now touching this support at a price of 1.85
We have an upward trend on the RSI indicator that is about to be broken, which supports the rise
We have a trend to stabilize above the moving average 100
Entry price 2.34
First target 2.66
Second target 2.92
Third target 3.20

JTO setup if BTC does not crash in MarchI do like this setup for JTO, kind a rounding bottoming pattern with lot of volume. Buying 3 bags in total. If market give us a chance buy lower, it would be gift. Waiting for breakout and price discovery mode.
If you have any questions please let me know.
ALWAYS USE STOPLOSS AND MANAGE YOUR RISK
NOT A FINANCIAL ADVICE

#JTO/USDT#JTO
The price is moving within a bearish channel pattern on the 4-hour frame, which is a strong retracement pattern
We have a bounce from a major support area in green at 1.60
We have a tendency to stabilize above the Moving Average 100
We have a downtrend on the RSI indicator that supports the rise and gives greater momentum, upon which the price is based higher at the discount
Entry price is 1.60
First goal 2.22
The second goal is 2.55
Third goal 2.94

JTO buy setupThe price is fluctuating in a range.
First, the liquidity pool at the top of the chart was swept, and now the liquidity pool at the bottom of the candles is expected to sweep and then move upwards.
The targets are clear on the chart.
Closing a candle below the invalidation level will violate the analysis
Note that the financial market is risky, so:
Do not enter any position without confirmation and trigger.
Do not enter a position without setting a stop.
Do not enter a position without capital management.
When we reach the first TP, save some profit and try to move the stop continuously in the direction of your profit.
If you have any comments please post them, comments will help us improve our performance
Thanks

JTO ANALYSIS (4H)It seems that the price is in a large range, which is moving from the upper part to the lower part of this range.
The green range is a support range.
The price can move from this range to the targets.
The targets are clear on the picture.
Closing a daily candle below the invalidation level will violate the analysis
For risk management, please don't forget stop loss and capital management
When we reach the first target, save some profit and then change the stop to entry
Comment if you have any questions
Thank You

#JTO/USDT#JTO
The price is moving in a bearish channel on a 4-hour frame and is holding it strongly and is about to break it upward
We have a bounce from the green support area at 3.60
We have a tendency to stabilize above the Moving Average 100
We have a downtrend on the RSI that is about to break higher
Entry price is 3.75
First goal 4.33
Second goal 4.66
The third goal is 5.00

JTO ,Will we grow before the 59% correction?A very important zone (4.8 - 5.3) $ has formed a resistance level in the past and is now ripe for a breakout.
There are a few scenarios that could play out:
Breakout of this zone (4.8 - 5.3) $ followed by a pullback and move towards the first target zone (8.4 - 9)$.
Or hit the area ($4.8-5.3) and then we can correct
Keep in mind that as long as we are above the uptrend line, this currency will be in an uptrend.
And after breaking out of the main zone (4.8 - 5.3) dollars, we can consider the final target (12.5 - 13.5) dollars based on Fibonacci.
Of course, there is still a lot of time before the final target.
This is an analysis and not financial advice. Please do your own research before trading.

JTO Looks Bullish#JTOUSDT (6H) analysis
It seems that an A wave that lasted 80 days and is an asymmetric diametric has ended and now we have entered a bullish B wave.
By maintaining the green range, it can move towards the targets.
Closing a candlestick below the invalidation level will violate the analysis
For risk management, please don't forget stop loss and capital management
When we reach the first target, save some profit and then change the stop to entry
Comment if you have any questions
Thank You

JTO NEW INCREASE VOLUMEThank you for reading this update.
Depending on our study we see that JTO has a good chance of volume increase.
This updates depending on day trade, And the market should confirm with time the right market way.

JTO could go up after the PullbackJTO could go up after the Pullback
🔵Entry Zone 2.5972 - 2.7311
🔴SL 2.4674
🟢TP1 2.9864
🟢TP2 3.4212
🟢TP3 4.1808
Risk Warning
Trading Forex, CFDs, Crypto, Futures, and Stocks involve a risk of loss. Please consider carefully if such trading is appropriate for you. Past performance is not indicative of future results.
If you liked our ideas, please support us with your likes 👍 and comments.

#JTO/USDT#JTO
The price is moving in a downward channel and we are about to break it higher
On the 4-hour frame, we have clear upward momentum after some correction occurred
Current price 2.08
The first goal is 2.39
The second goal is 2.60
Third goal 2.86
