JUP/USDT – Massive Breakout Brewing? Falling Wedge Reversal🧠 Detailed Technical Analysis:
Jupiter (JUP) is currently forming a classic bullish reversal pattern – the Falling Wedge – after months of consistent downward pressure. Since December 2024, JUP has been trending inside a narrowing range of lower highs and lower lows, and it's now approaching a potential breakout zone.
📊 Pattern in Focus: Falling Wedge – A Powerful Bullish Reversal Setup
The Falling Wedge consists of a converging downtrend with declining volatility.
This pattern typically signals a loss of bearish momentum and often precedes a sharp upside breakout.
If confirmed, a breakout can lead to a strong bullish impulse wave with significant gains.
🔍 Key Levels to Watch:
✅ Major Support Zones:
$0.3018 – Historical low and critical defense level
$0.4453 – $0.4883 – Current consolidation base
🚀 Key Resistance Targets (Post-Breakout):
$0.6089 – First resistance after breakout
$0.7213 – Mid-level resistance
$0.8075 – Key breakout zone before bullish expansion
$1.1158 – $1.3701 – Primary medium-term targets
$1.4400 – All-time high and psychological resistance
🔼 Bullish Scenario (High Probability Setup):
If JUP breaks above the falling wedge resistance and clears $0.4883:
✅ A bullish rally could target $0.6089, followed by $0.7213 and $0.8075
✅ If strong momentum follows, JUP might extend gains towards $1.1158 – $1.3701
✅ Watch for breakout confirmation with high volume and potential retest of the breakout zone
🔽 Bearish Scenario (Risk to Consider):
If price gets rejected and breaks below $0.4453:
❌ Downside may resume toward $0.3600 or even retest $0.3018
❌ This could either lead to a prolonged downtrend or form a double bottom base for a future reversal
💡 Conclusion & Strategy:
JUP is at a critical technical juncture. The Falling Wedge formation is one of the most reliable bullish reversal signals.
This setup offers a great risk-reward opportunity for traders watching for a confirmed breakout.
📌 Breakout = Golden Opportunity
📌 Breakdown = Be Cautious & Reassess
Aggressive traders may look to accumulate near $0.44–$0.48 with tight stop-losses.
Conservative traders should wait for a breakout + retest for confirmation before entering.
#JUP #JUPUSDT #CryptoBreakout #FallingWedge #TechnicalAnalysis #AltcoinSetup #CryptoChart #BullishSetup#AltcoinWatch #SwingTradeSetup #CryptoStrategy
JUPUSD

#JUP/USDT#JUP
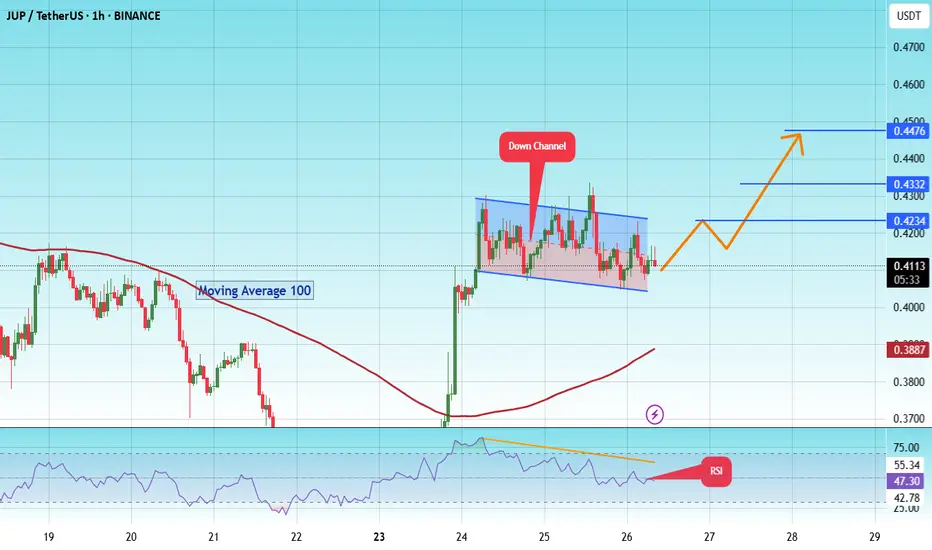
The price is moving within a descending channel on the 1-hour frame and is expected to break and continue upward.
We have a trend to stabilize above the 100 moving average once again.
We have a downtrend on the RSI indicator, which supports the upward move by breaking it upward.
We have a support area at the lower limit of the channel at 0.4065, acting as strong support from which the price can rebound.
Entry price: 0.4113
First target: 0.4234
Second target: 0.4332
Third target: 0.4477
Jupiter JUP price analysisThe price of OKX:JUPUSDT did not live up to the “multifaceted promises” of marketers and disappointed us...
So we will get rid of #Jup from our portfolio in the designated area.
May all the gods, headed by Zeus, help #Jupiter rises from its knees and cross the $0.80 mark at least for a while
There is nothing more to add, with such dynamics, it will be very difficult to "scrape up" #JUP to at least $1...
_____________________
Did you like our analysis? Leave a comment, like, and follow to get more

JUPUSDT 1D AnalysisJUP ~ 1D Analysis
#JUP Buy gradually after successfully breaking through this resistance line with a short-term target of at least 10%+ from here.

JUP Looks Bullish (4H)From the point where we placed the green arrow on the chart, it appears that the bullish phase of JUP has started in a swing structure.
This phase is a diagonal (Diametric), and it currently seems that wave G is forming. This wave is a bullish wave.
As long as the green box is maintained, the price can move toward the red box.
The closing of a daily candle below the invalidation level will invalidate this analysis.
invalidation level: 0.4322
For risk management, please don't forget stop loss and capital management
Comment if you have any questions
Thank You

JUPUSDT 2DJUP ~ 2D Analysis
#JUP Buy gradually from here with a short -term target of at least 15%+. This is a very good support to start buying again.

JUPUSDT: Weekly Outlook & Key Levels for JupiterHey everyone! 🌟
Let’s take a look at this weekly cryptocurrency price chart together. Here's what stands out:
We’re looking at two possible scenarios:
Primary Scenario: The price might bounce back from the first support level, marked with a solid yellow arrow.
Secondary Scenario: If it doesn’t, the next potential rebound is from the lower support level, shown with a dashed yellow arrow.
Keep an eye on the numbers highlighted—$0.4310 and $0.3798. These are key price levels that could guide future movements. It’s also essential to monitor liquidity, candlestick patterns, and trading volumes. A strong confirmation, like a favorable candlestick formation and sufficient volume, could signal a rebound.
However, if the price dips below these critical levels, it might shift the perspective. Staying vigilant is key.
Always remember, this is just an observation. Do your own research, stay informed, and keep learning. The journey in the crypto world is as much about growth as it is about numbers! 📚📈✨

JUPUSDT 2DJUP ~ 2D Analysis
#JUP Buy gradually from here with a minimum target of 15%+. This is a very good support block for now.

#JUP/USDT#JUP
The price is moving in a descending channel on the hourly frame
And it is sticking to it well
We have a bounce from the lower limit of the descending channel and we are now touching this support at a price of 0.7000
We have a downtrend on the RSI indicator that is about to be broken, which supports the rise
We have a trend to stabilize above the moving average 100
Entry price 0.870
First target 1.00
Second target 1.10
Third target 1.22

Public trade #17 - #JUP price analysis ( Jupiter )Recently, the #JUP coin has been on various “interest lists” a lot.
So we will share our OKX:JUPUSDT chart
✅ We will try to bribe #Jupiter for ourselves both in the investment's portfolio, for participation in airdrops, and in copytrading for speculation - as close as possible to the price of $0.75-0.80
✅ And after that, it will be possible to hold at least $4.50-5 per LSE:JUP
_____________________
Did you like our analysis? Leave a comment, like, and follow to get more

JUPUSDT 2DJUP ~ 2D
#JUP So far it still maintains this support block,. If you still have Conviction on this coin, buy it in stages from here with a minimum target of 20%++

Jupiter on Solana: Future Bet or Bursting Bubble?In a world where innovation is currency, the Jupiter on Solana project looks like a golden nugget against the desert backdrop. It's not just another crypto project, it's a heck of a massive solution that makes you wonder if traditional financial instruments are worth all your attention.
Let's start with the facts - Jupiter, is a decentralized exchange aggregator that not only connects liquidity, but does so with such efficiency that you start to question whether we even need centralized exchanges. See, Jupiter's trading volume has reached $1.5 billion, surpassing even 1inch, showing its dominance in the Solana space.
Now let's talk about speed and scalability. This thing - Jupiter - processes transactions at a pace that makes you feel like you're in the 21st century instead of the era of waiting for wire transfers. We're talking thousands of transactions per second, which makes Solana and Jupiter not just a player, but a leader in the DeFi game.
And don't forget the community. Jupiter has attracted over 955,000 accounts to its airdrop, which shows not only popularity but also trust in the platform. It's like when you find a company that not only promises but actually gives a return to its investors.
If we look at the charts, we can see that Jupiter is showing a long accumulation. According to my Fibonacci grid, I expect Jupiter to test the area at the $5.4 level. If Jupiter breaks through this level, we could see an even more significant rise, which would signal a new round of interest and possibly the start of a mainstream adaptation.
Horban Brothers,
Alex Kostenich

JUP SOL looks super dumpy possibly going for ATL in SOLbetter hold SOL than JUP based on where this is going
if horizontal HTF support line breaks down, JUP will dump to negative price discovery

JUPUSDT 2DJUP ~ 2D
#JUP So far it continues to maintain this support block,. If you still have Conviction on this coin,. Buy gradually within this support block,. with a minimum target of 20%++

JUP - 500%JUP - I trust the growth potential of this coin. It has potential, it has marketcap, volumes will come and I see it going up with at least 300% gain.

Jupiter JUP price - the most interesting is yet to come!The last time we were published an idea for #JUP 6 months ago, where we predicted a price drop from $1.30 to $0.67-0.68 and recommended placing pending limit orders there 👇
Those who listened should be happy with their profits now.
🧑🚀 But in general, if we analyze the price chart of the #Jupiter token, we can assume that the most interesting things are yet to come, because it seems that the coin has been actively accumulating for the last 4 months.
🔼 So, we can try to take a long OKX:JUPUSDT in the range of $0.81-0.89 with a medium-term growth prospect of at least +120%.
_____________________
Did you like our analysis? Leave a comment, like, and follow to get more


Building Swing Spot for JUPBuilding Swing Spot for JUP
Buy zone: 0.85-0.83, DCA 0.71 if necessary
Invalidation: D chart clean break below 0.71
TP: 0.96, 1.2, 1.8
Reason:
Narratives:
- SOL memecoins are getting a lot of interest, DEX like JUP and RAY are in the spotlight
Technical:
- Expecting a breakout from the daily trend
- Prices consolidate in the golden pocket zone from the current range (0.85-0.83)
- Stoch comes into mid-range and ready to cross up

JUPUSDTLSE:JUP ~ 1D
#JUP If you ask us, when will the price of LSE:JUP increase. you should look at this chart. You can see this decreasing pattern in the 1D Time frame. The bulls will return if this pattern is successfully broken.
The best strategy for now, Buy gradually inside this pattern. or wait for this pattern to be successfully broken and you can start buying afterwards.

JUP target 1.84h time frame
-
Entry: $0.89
TP: $1.8
SL: $0.646
RR: 3.73
-
(1) Going to break out the triangle pattern
(2) Ideal breakout will make HH in future and trigger a new pump wave
(3) Target for fib extension is set between 0.886~1, which is $1.8
(4) Stop loss once going below $0.646

JUPUSDT Breaks Trend Line: Ready for a Major Upswing?JUPUSDT has hit support multiple times and has now successfully broken its trend line, setting the stage for a significant upmove following a brief retracement. As a fundamentally strong project, JUP presents a promising opportunity with the potential for a 2x return from current levels.
Keep a close watch on price action, and remember to implement your stop-loss strategy to manage risk effectively. This could be the start of an exciting rally—don’t miss out!
JUPUSDT Currently trading at $0.92
Buy level: Above $0.92
Stop loss: Below $0.77
TP1: $1
TP2: $1.2
TP3: $1.5
TP4: $1.85
Max Leverage 3x
Follow Our Tradingview Account for More Technical Analysis Updates, | Like, Share and Comment Your thoughts

Jupiter on course to new ATHs in the near futureThere's many signs that suggest a major trend reversal:
1) Double bottom
2) Previous resistance line acted as support for the previous 2 lows, extremely precisely as well
3) Lower 0.618 St. Deviation Band of the all time VWAP acted as a support again
4) Bullish divergence on volume weighted RSI 4H
5) Price broke through the resistance line and just got retested, this also aligns with the 0.236 Fib extension level
Fundamentals are great as well. Nearly half the volume on Solana comes from the Jupiter aggregator. JUP is one of the most held tokens on the network. The team is very active with updates and fixes. A 30% supply burn is planned.
TP targets are the 1.618 of the Fib extension (which happens to be just above ATH) and $2.
I think JUP has the potential to go much higher, but there's likely to be a pullback if these levels are reached, which would be an opportunity to re-enter.
If we go down from here it remains bullish as long as price doesn't go below the first green zone, if it does I would expect a further drop to the second zone.

JUP looks bearish (12H)From where we put the red arrow on the chart, it looks like a correction pattern has started.
According to the price and time rules, it seems that this pattern is a diametric.
It seems that the d wave of this diametric is over now.
The targets are marked on the chart.
Closing a daily candle above the invalidation level will violate the analysis.
For risk management, please don't forget stop loss and capital management
When we reach the first target, save some profit and then change the stop to entry
Comment if you have any questions
Thank You
