KASUSDT IDEA - KASPA IDEA#KASUSDT #KASUSD #KASPA
NO Comment!
⚠️ Disclaimer: The viewpoints shared represent my individual outlook on the market, based on publicly accessible information and historical data. While a portion of these opinions is influenced by my actual trades, others are not. It's important to note that I am not a financial advisor, and I do not assume any responsibility for the decisions you make in your trading activities.
✅ Feel free to share your inquiries or suggestions in the comments. I am more than willing to assess and analyze any cryptocurrency, forex currency pair, or stock index that piques your interest, so, Please don't hesitate to ask or mention the specific currency chart you'd like me to review.
KASUSDT

KAS LONG SETUPHi, dear traders. how are you ? Today we have a viewpoint to BUY/LONG the KAS symbol.
By protecting the green zone, it can move up and defeat the previous peak.
For risk management, please don't forget stop loss and capital management
When we reach the first target, save some profit and then change the stop to entry
Comment if you have any questions
Thank You

KASPA --- BREAKING OUT!Should be a nice trade to the upside
enjoy!
and fulfil our 20c (or close to 20c --- could be front ran) target

Kaspa Update | KASUSDT UpdateKUCOIN:KASUSDT CRYPTO:KASUSD
Hello, dear traders!
Ah, well, well...
Our price chart's been playing hard to get with that stubborn $0.1500 resistance, giving it a go three times, no less! But alas, here comes the downturn.
Buyers, feeling a bit let down by the lack of perpetual growth, are wrapping up their trades, and wouldn't you know it, the bears decide to join the party. We're looking at a drop, folks.
Now, down to the 0.500 Fibonacci Ratio, we're in for a price slide. After a little breather, expect the downtrend to strut its stuff all the way down to the $0.1000 level.
✅ Wishing you all the luck in the trading arena. May the charts be ever in your favor. ✅
⚠️ Disclaimer: The viewpoints shared represent my individual outlook on the market, based on publicly accessible information and historical data. While a portion of these opinions is influenced by my actual trades, others are not. It's important to note that I am not a financial advisor, and I do not assume any responsibility for the decisions you make in your trading activities.
✅ Feel free to share your inquiries or suggestions in the comments. I am more than willing to assess and analyze any cryptocurrency, forex currency pair, or stock index that piques your interest, so, Please don't hesitate to ask or mention the specific currency chart you'd like me to review.

KAS NEW VOLUME INCREASEThank you for reading this update.
Depending on our study we see that KAS has a good chance of volume increase.
This updates depending on day trade, And the market should confirm with time the right market way.
#Nottradingadvice

KASUSDT | KASPA IdeaKUCOIN:KASUSDT MEXC:KASUSDT Kaspa vs Tether
No comment!
⚠️ Disclaimer: The viewpoints shared below represent my individual outlook on the market, based on publicly accessible information and historical data. While a portion of these opinions is influenced by my actual trades, others are not. It's important to note that I am not a financial advisor, and I do not assume any responsibility for the decisions you make in your trading activities.
✅ Please don't hesitate to contact me with any inquiries or suggestions. I am more than willing to evaluate and analyze any currency pair or index that captures your attention.

🚨 **KASUSD Alert: Caution Advised!** 📉🔍- **Current Scenario:** KASUSD is exhibiting notably high levels, potentially signaling an imminent dump.
- **Strategic Approach:** Consider using this coin for scalping, but exercise extreme caution.
- **Risk Management Tips:** Utilize low leverage and limit exposure to funds to navigate potential volatility.
Stay updated with Bitxer for the latest on new coins and market dynamics. Stay cautious, stay informed! 🌐💡📉

KAS USDT By HesamUNT ( New Update )hey traders
we had an ascending triangle around 0.0539999 and we got this move
Now im looking for short entry around 0.122270 which confirmed by dynamic lvl
as u can see theres a bull flag in this chart, we can take the fresh support as a potential support area in first n second touches, and then we can expect another range market between fresh support and classical lvl till break up/down confirmation in daily TF
Also Classical lvl confirmed by Ichi and SenkouA as a potential support area
what u think about KAS ?
is this over ?
share ur chart and leave a comment

Kaspa – Short Term correction on LTFI am uploading early to give you time to consider and prepare.
KAS fulfilled Miller’s (2020) three M.S Principles of a bullish to bearish reversal:
1. The market fails to create a higher high.
2. Price makes a LL (price breaks the X line)
3. Price makes another LH in which B > E.
Final confirmation is only if KAS makes another LL.
I consider this a healthy correction within a bullish trend. As long as Kaspa stays above 0.041, it is bullish on the daily TF. Ideally it won’t retrace lower than 0.062.
Risk Level:
High Risk.
Reasons:
1. Counter trend trade.
2. R: R: to first TP less than 1:3.
3. Final confirmation only if KAS makes another LL.
Trade Idea:
Entry: 0.0833
SL: 0.091
Target: 0.053
TP: 0.066 0.0533
R: R: 1:2.2 to first TP
If you don’t have a position, you can use the demand zone and TPs to accumulate.

KASPA USDT: Breakout Watch and ZonesHello dear traders! If you like my graphics, please use Like button 💙💛.
📊 MEXC:KASUSDT Update:
The next move hinges on the breakout direction. Watch closely:
Bearish Perspective: Keep an eye on the 0.044 level. If it crosses below, a selling wave might persist, breaking the Rising Wedge support line.
Bullish Perspective: Look out for the 0.056 level. If broken, it signals a potential upward surge, breaking the Rising Wedge resistance (as in late March).
Bull Targets:
Target 1: 0.067
Target 2: 0.072
Target 3: 0.076
Target 4: 0.081
Bear Targets:
Target 1: 0.031
Target 2: 0.020
Target 3: 0.014
Stay alert for these critical levels! 🚀💹

KASPA vs USDT - KASUSDT IdeaKUCOIN:KASUSDT MEXC:KASUSDT
⚠️ Disclaimer: The following insights reflect my personal perspective on the market, relying on publicly available information and historical data. While some opinions stem from my actual trades, others do not. I am not a financial advisor, and I bear no responsibility for your trading choices.
✅ Feel free to reach me out with any questions or recommendations. I am more than willing to assess and analyze any currency pair or index that piques your interest.

KASPA, KASUSDT IdeaKUCOIN:KASUSDT MEXC:KASUSDT
⚠️ Disclaimer: The following insights reflect my personal perspective on the market, relying on publicly available information and historical data. While some opinions stem from my actual trades, others do not. I am not a financial advisor, and I bear no responsibility for your trading choices.
✅ Feel free to reach me out with any questions or recommendations. I am more than willing to assess and analyze any currency pair or index that piques your interest.

Kaspa- Inverse Head and Shoulders BreakoutKaspa formed an Inverse Head and Shoulders. Today (Nov. 4th) it broke above the neckline to form a new ATH.
The immediate target is 6.6 cents. However, we are at price discovery and the potential is much higher.
My advice: Don’t buy the breakout; buy the retest.
Trade idea:
Entry: 0.053 (neckline)
SL: 0.049 (Right shoulder and local support).
Target: 0.066
R: R: 1:2.93
Best Wishes

KASPA very bearish..After my VERY SUCCESFUL prediction about Kaspa, im back again.
Kaspa is entering bearish period. As you can see with the latest breakout to ATH (0,054) Volume was even lower than previous times, which is absolutely bearish. After the breakout, KASPA immediatly dumped to 0,043, which is another bearish sign. It seems whales just wanted to exit and needed a little bit liquidity (which they are not getting).
Beside of this, You see Kaspa has made DOUBLE TOP, this is one of the most bearish patterns, I dont see Kaspa going any higher and i expect a huge dump towards at least 0,025.
BE CAREFUL.
My PREVIOUS prediction about Kaspa was PERFECT:
MEXC:KASUSDT KUCOIN:KASUSDT CRYPTO:KASUSD COINEX:KASUSDT

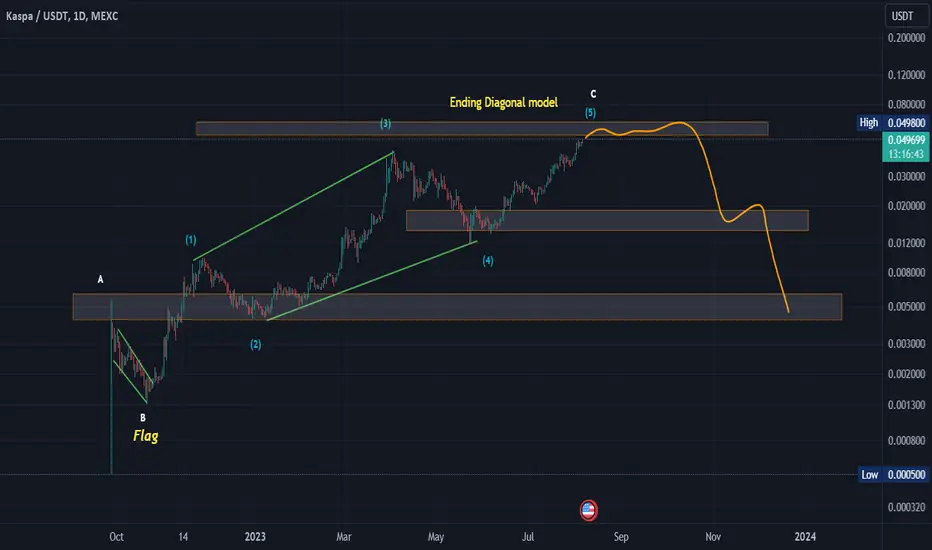
The ascent is almost finishedFrom the general shape and Elliott rules, a B-wave flag was formed, including the five-wave Ending Diagonal model. It is close to the end of the ascent, to begin the draining phase, and then descend to the shaded areas below.
KASUSDT Ascending Triangle BreakoutKASUSDT Daily is about to break out of a nice ascending triangle pattern. A fairly new crypto so no overhead resistance. Also breakout coincides with a market cap of around 1 billion.

KAS MIGHT FALL : Bearish Divergence 📉 It's crucial to approach trading with a discerning eye. The KAS token has recently formed a significant rising wedge pattern, a bearish indicator, and to add to the complexity, it's showing signs of a bearish divergence. This double whammy serves as a warning to traders to exercise caution. 📊🚫
The Rising Wedge Pattern:
Rising wedges are typically bearish patterns, suggesting a potential price decrease. However, the crypto world is known for its unpredictability, so it's wise to be cautious. 📉🐻
Bearish Divergence:
Adding to the intrigue is the presence of a bearish divergence, where price forms higher highs while the corresponding oscillator (like RSI) creates lower highs. This phenomenon signals potential weakening in buying momentum. 📈📉
A Word of Caution:
It's crucial for traders to tread carefully when considering positions on KAS:
Risk Management: Employ rigorous risk management strategies, such as stop-loss orders, to safeguard your investments.
Thorough Research: Always conduct thorough research into the fundamentals and recent news related to KAS to make informed decisions.
Patient Entry: Should you consider short positions, exercise patience and wait for a confirmation of the bearish trend. This might involve a retest of the wedge border.
Conclusion:
The cryptocurrency market is known for its unique characteristics, and patterns can be informative, but they don't always guarantee outcomes.
Market dynamics, liquidity, and unpredictable events can influence prices, and traders should remain vigilant and adapt their strategies accordingly.
While the rising wedge and bearish divergence are worth noting, they are not the sole determinants of market movements. Trade wisely, and always be prepared for the unexpected.
Happy trading,
📉
❗️Get my 3 crypto trading indicators for FREE! Link below🔑

Kas/Usdt (Bearish Behavior) Confluences to short:
1. Breaking out of the rising Bear Flag (watching)
2. Head and Shoulder pattern (confirmed)
3. Bearish Divergence on WEEKLY (confirmed)
4. Closing and retesting below 50 days EMA (watching)
Will be updating you guys on step by step process, stay tuned.
NOTE: DON'T SHORT IT YET, WAIT FOR ALL THE CONFIRMATION. TRADE AT YOUR OWN RISK.

KASUSDT Elliott Waves Analysis (time to fall)Hello friends.
Please support my work by clicking the LIKE button👍(If you liked). Also i will appreciate for ur activity. Thank you!
Everything on the chart.
Entry: market and higher
Targets: 0.3 - 0.2 - 0.13
after first target reached move ur stop to breakeven
Stop: (depending of ur risk). ALWAYS follow ur RM .
risk is justified
Good luck everyone!
Follow me on TRADINGView, if you don't want to miss my next analysis or signals.
It's not financial advice.
Dont Forget, always make your own research before to trade my ideas!
Open to any questions and suggestions

Is Kaspa close to an imminent correction?This is not an investment advice but a humble idea of a potential crypto enthusiast.
Kaspa has represented a real exception within the current market conditions that have been experienced for some weeks now.
Kaspa has made a new ATH, something that for the holders is a success and for Short futures traders a misfortune.
However, not everything seems to be following the same path. The RSI is showing a real monstrous bearish divergence since weeks ago. And with this new ATH, things don't seem to be getting any better.
This points to a healthy (I might even say necessary) correction. Although, for this to happen, we must first fall below its trend line.
After the breakout, a pullback should be made near the dynamic support and continue with the correction.
If, consequently, the critical support is broken, there will be 2 important zones left to start an accumulation phase. Such areas are potential for the next bull market.
Buy zone 1: $0.024 - $0.022
Buy zone 2: $0.014 - $0.013
Managing purchases and following the plan is paramount to your financial success. Do your own research and decide your future.
----------------------------------------------------------
In this small space, I thank those who have seen my ideas and have given their support!

Ascending Triangle on KAS - BULLISHLooks like there's potential for KAS to form an ascending triangle here.
Could fill out the entire shape shown in this chart, or break out sooner than later.
My bias is that it doesn't get filled out completely, but we'll see...

How High Can Kaspa Go?ATM, it looks like Kaspa is on the verge of a breakout and a new ATH.
First, a word of caution. You should be bearish at resistance. If you want to trade this as a breakout trade, wait for confirmation. Meaning that you should wait for a S/R flip.
Regardless, the question is, if Kaspa does break out, ho high can it go?
To try and answer the question I will use the following tools:
1. The RSI as a momentum indicator.
2. Classical charting.
3. The Echo indicator by Lux Algo.
First, let’s have a look at the RSI:
• Weekly RSI is at 67. Bullish and not yet oversold. No bearish Div.
• Daily RSI is at 70. Hot, but it could go a lot higher before a pullback. No bearish Div.
• 4H RSI is at 72. Hot, but it too could go a lot higher. However, on the 4H we do have a
bearish divergence. Pay attention to that because it could lead to a pullback.
My conclusion is that there is almost no bearish momentum. Kaspa is bullish and far from being exhausted.
Classical Charting:
On the daily TF, it looks as if Kaspa is forming a cup and handle with a target of 7 cents.
There is additional confluence for this breakout from previous bullish patterns that you can see in the linked ideas.
Echo indicator by Lux Algo:
I changed the settings on the Echo indicator on the evaluation window and forecast window to 100.
Note that if I was using the default settings, the indicator’s prediction is a pullback to the 3.5 cents area. A possibility that is still very much on the table!
However, I examined the modified settings against my expectations for Bitcoin and other assets, and IMO, this is the most accurate.
According to the Echo indicator, Kaspa could go as high as 8.3 cents.
Please use risk management and remember that we are at resistance.
NFA.
What do you think? Please share in the comments.
Best Wishes.

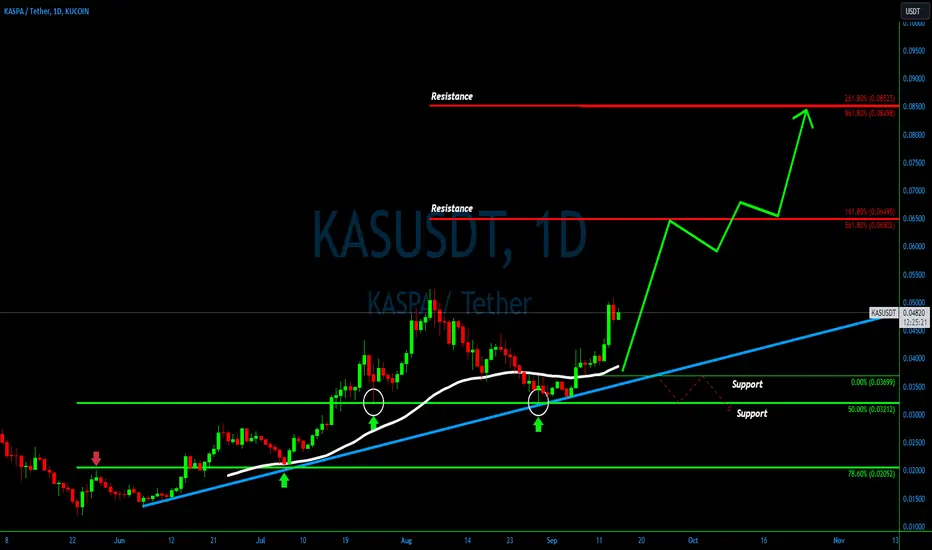
Charting the Path - KASUSDT Uptrend Story💎#KASUSDT has recently delivered an impressive performance, marking an almost 60% price surge since the month's commencement. This upward trajectory initiated following a bounce from the 50% Fibonacci support level at $0.032. Simultaneously, we observed a decisive rejection of the long-term uptrend trendline. These two pivotal events propelled the price upward, breaching the 50 Exponential Moving Average on the daily chart.
💎This price action underscores the credibility of a robust uptrend, significantly enhancing the likelihood of further growth. Consequently, #KASPA is poised to set its sights on one of the double Fibonacci resistance levels, situated at either $0.065 or $0.085.
💎However, prudent traders, or Paradisers as we like to call them, remain vigilant for opportune buying moments amidst the ascent. They avoid chasing the asset at its peak. Simultaneously, it's imperative to prepare for the scenario in which the price breaks below the recent support at $0.036. Such an occurrence would cast doubt on the continuation of the uptrend.
💎In light of these factors, implementing a sound money management strategy alongside clearly defined support and resistance levels is imperative for a well-rounded approach to trading.