KAVA giving off good vibes.KAVA is giving off some very good vibes in the way that it was bounced off this retest of this break out on the lower time frame here.
Looking for price to travel towards the 2.00 mark. Would be taking profit here, and then waiting for consolidation for any re-entry. (Or you might want to use any swing highs on lower time frame as re-entry/good places to wait for a long, if we do hit that overhead resistance).
Kava

Short KAVAKAVA lost its trendlines for both price and RSI.
It'll continue to fall after retesting the trendlines, very likely.

KAVA KAVA/USDT forming Rising Wedge Pattern on 1h Timeframe now broke Support Zone and waiting for 1.530$

KAVAUSD Approaching the 1D MA50. Attention.Kava (KAVAUSD) has been trading within a Bearish Megaphone since the August 30 2021 High. The recent short-term rally in the form of a Channel Up is close to a 1D MA50 (blue trend-line) test. A candle closing above it should be a bullish break-out call towards the 1D MA200 (orange trend-line).
The pattern however so far resembles the sequence of January 24 - February 06. The RSI sequences prior are also identical. That pattern got rejected on the 1D MA50 and after trading sideways below it, it finally targeted the 1D MA200 when it broke. The strategy here should be to buy on the pull-back or if the 1D MA50 breaks (candle closing above) first.
--------------------------------------------------------------------------------------------------------
Please like, subscribe and share your ideas and charts with the community!
--------------------------------------------------------------------------------------------------------

KAVA Long-Term (635%+ Potential To All-Time High)KAVA (KAVABTC) peaked hitting an All-Time High back in August 2020.
A strong correction followed and the market bottom low was set 4 months later on December 2020...
After Dec. 2020, we have a long-term consolidation phase with higher highs and higher lows. You can see this depicted on the chart.
The current low was set May 2022, together with the rest of the market, with a hammer candlestick which signals reversal when coming at support.
We have 255% potential short/mid-term.
We have over 650% potential to the ATH and even more long-term.
This is not financial advice.
Namaste.

#Kava🔴Short
❇️Entry : 1.760~1.751
Max lev 3~5x
Targets : 1.728 / 1.698 / 1.669
🛑Don't risk more than 3% of capital.

#KAVA 4H LONG🔰 Spot & Futures
#kava/usdt
Buy : 1.580 cmp - 1.525 safe - 1.440 mart
Sell : 1.746 - 1.915 - 2.090 - 2.240 - 2.425 - 2.710 - 2.955 - 3.200
Stop : 1.360 (Daily Clsoe) DC -8%

WOOHello everyone. In these days market is very boring at least for me. Btw I guess we can wait and set alarm for taking position.
Have a profitable day
Mike Mardani ;)


KAVA in reaccumulation$KAVA 4h chart , things we can see:
- Asymetrical V shave recovery that lead to an ascending channel (can be considered as accumulation)
- RSI + MACD neutral
- Waves slightly positive
- Fib trace shows us the possible Liquidity check area before springing upwards
- $2.90 is the upper limit inside the range. Need to close 4h above that level in order to think that we will leave the range bullish
Bias: Neutral/Slightly bullish


KAVA - Daily trendline breakdown is one of my favoritesReasons to take short
⭐️ BTC looks bearish
⭐️ Updating historical lows
⭐️ 5th touch
⭐️ Volume at top
⭐️ Level is visible on daily timeframe
⭐️ Level is 22 days old
⭐️ 40 ATR
Will enter when price squeezes to the leverl on 5m timeframe, the base will form and the strip will get faster.
If you don't understand the previous sentence, just use swing stop-loss 3-5%
Fix profit by parts:
1% - 1/3
2% - 1/3, stoploss to breakeven
What's left, hold to the maximum
What do you think of this idea? What is your opinion? Share it in the comments📄🖌
If you like the idea, please give it a like. This is the best "Thank you!" for the author 😊
P.S. Always do your own analysis before a trade. Put a stop loss. Fix profit in parts. Withdraw profits in fiat and reward yourself and your loved ones

KAVA Full of news 👍👍👍👍There is a lot of news about this currency code these days. On the other hand, the bitcoin decline process is coming to an end and this currency code can give good profits to its shareholders.
Your constant friend Manouchehr Azar from Iran

KAVAUSDT - SETUPKAVAUSDT price moved aggresively in previous hour as Bulls trying to break the falling trendline. But there is a resistance ahead, if aggressive volume come at resistance we could see an upward surge up to next resistance level. Keep Accumulating

Kava - Nice short opportunityReasons to take short
⭐️ BTC is bearish
⭐️ Trend bearish
⭐️ Level is 7d old
⭐️ Level is visible on multiple timeframes
⭐️ In the end of formation
⭐️ Slowly squeezing to the level
⭐️ Volume at top
⭐️ 4th touch
⭐️ Under VWAP
Will enter when price squeezes to the level on lower timeframes, the base will form and the strip will get faster.
If you don't understand the previous sentence, just use swing stop-loss 3-5%
Fix profit by parts:
1% - 1/3
2% - 1/3, stoploss to breakeven
What's left, hold to the maximum
What do you think of this idea? What is your opinion? Share it in the comments📄🖌
If you like the idea, please give it a like. This is the best "Thank you!" for the author 😊
P.S. Always do your own analysis before a trade. Put a stop loss. Fix profit in parts. Withdraw profits in fiat and reward yourself and your loved ones

Kava movement this is a principle : each asset have its own plan !
Kava is moving up in opposite direction of other asset if you want to know why you have to ask kava market makers .
i have the first target for 4.148 $ for this asset . and i think it will have ATH about 17 JUl 2023 .its soon for predicting the target but my estimate is about 14 $

KAVA/USD Daily Cautiously BullishKAVA/USD Daily cautiously bullish. *Since 05/12/22 KAVA/USD has gone up 116% so a little bit of resistance here at the top of the descending channel is to be expected.* Recommended ratio: 65% KAVA, 35% cash. Price is currently testing $2.72 resistance and is on the verge of testing the upper trendline of the descending channel from August 2021 at ~$2.95 as resistance. Volume remains very high after printing a record high on 05/12/22 and has been fairly balanced between buyers and sellers over the past week. Parabolic SAR flips bearish at $1.50, this margin is mildly bearish. RSI is currently trending up slightly at 45 after finally breaking out above 38.31 resistance (It had been testing it since 05/15/22); the next resistance is the uptrend line from December 2021 at ~53 (which could potentially coincide with 56.84 resistance). Stochastic currently remains bullish at 99 after going nearly straight up from max bottom on 05/12/22; it's on the verge of testing max top where it can coast in the "autobahn zone" for a while. MACD crossed over bullish in yesterday's session and is currently testing -0.44 resistance; if it can break above it then the next resistance would be at -0.18. ADX is currently trending down at 28 as Price continues to go up, this is mildly bearish; if ADX can bounce here as Price continues to rise then it would help confirm that this is a reversal and not a retracement. If Price is able to break out above the upper trendline of the descending channel from August 2021 (~$2.95) then the next likely target would be a test of $3.31 resistance. However, if Price is rejected here (at either $2.72 resistance or the upper trendline of the descending channel), it will likely test the $2 level as support and may fall as low as the lower trendline of the descending channel at ~$1. Mental Stop Loss: (one close below) $2.19.

KAVA is slowly breaking outI'm not sure how if this can go up too much, after all the last two 4h candles and last 3 daily candles had a lowering volume, however that's a breakout. This might stop right here or touch the resistance up there.
My thought is that it's stopping right here and is about to retrace.
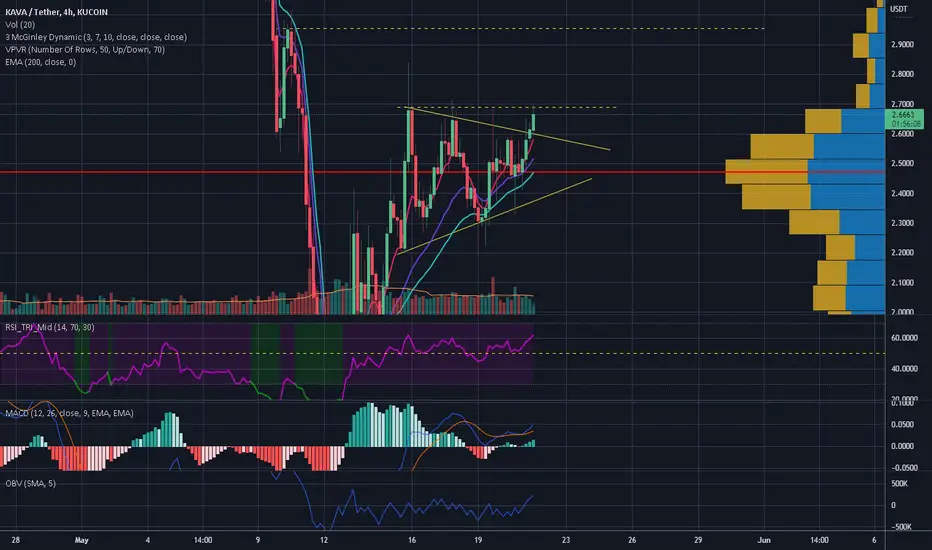
KAVA/USDT BUYING SETUPKAVA look's like make a ascending triangle we can setup entry after breakout or when retest to resistance become support , big buy volume on resistance at the time EMA 20 golden cross with EMA 50 so potential breakout
MACD showing bullish crossover
Buy zone : 2.65 - 2.5
Target : 2.786 - 2.966 - 3.282 - 3.503
Stop : 2.4

KAVA Events along the Trendline KAVAUSD experiences same parallel downtrends with curiously similar bottom pattern followed by a sharp low on the trend line
This is happening currently, the only difference being a lower low being created instead of a higher low in the prior two situations
In the prior two situations price rose in both situations following these structural patterns


Will KAVA reach $12 in this cycle ?My EMA 50D & MA 230D crossover is happening. In the past, this crossover took place two times and triggered amazing rallies every time.
KAVA price is in an ascending broadening wedge. This promisses a potential new ATH of $12.
What do you think?
All comments for this guess and FA news on KAVA are welcomed. Thanks in advance!

🔵 FIL usdt is still in the channel 🔵🟦 FILusdt
⏰ Time Frame : 1W
🔵 I said before second senario.
you can see the price is under the midline of channel.and channel range is valid still.
we have a support on 10.00 $
I have shown the resistances.
📣 This Analyze its just A compelete overview of Fileusdt process.
🌼 I sent an analyze of File on Daily timeframe.
And I want to post a close-up analysis
📛 Please follow the market trend and decide to buy or sell.
⚠️ (This isn't a signal for buy or sell)
⚠️ The chart is in log mode
#️⃣ May / 01 / 2022
👸 Analyzed by : Parisa_Alipoor
