Kava

KAVA Price Targets and Stop LossKAVA/USDT
Entry Range: $5.10 - 5.40
Take Profit 1: $5.80
Take Profit 2: $6.50
Take Profit 3: $7.02
Stop Loss: $4.70

🌐 Good Candle in ENS usdt 🌐🌐 ENS usdt
⏰ Time Frame : 1D
🔵 A good candle is created. We have to wait for it to close, and probably have a correction and then make a decision for position.
All supports and resistances market are in the chart.
📛 Please follow the market trend and decide to buy or sell.
⚠️ (This isn't a signal for buy or sell)
⚠️ The chart is in log mode
#️⃣ April / 27 / 2022
👸 Analyzed by : Parisa_Alipoor

KAVAUSDT - bearishLikely going down into the Y wave, as the next wave of a huge corrective pattern (a double zigzag)
Wave X is a flat pattern. Expect a 3-waves move down

Kava is gonna blow!Trend lines and projected targets included on the chart. Just thoughts, DYOR as always! c

KAVA test strong resistance KAVA / USDT
KAVA was one of few greens during red market in last days
Right now it’s testing very strong resistance :
–A Close above resistance will open all the way up to 7$ and 9$
–If strong rejection here, i see 3$ again
Lets see what MM will decide before opening a trade
Best of wishes

KAVAUSDT - Daily chartThe price has reached a strong support area based on two Fibonacci.
Susceptible to negative divergence.
You also express your opinion in the comment.
Thanks a lot.

KAVA, short-term long/buy strategyKAVA, 4h level operation:
Direction: Buy & Go Long
Good entry price: under 5.18
Stop loss price: below 0.057
Take Profit Price: 5.82

KAVA / USDTJust wait for the confirmation to make it short or long
we are facing the resistance as I draw you on the chart
Keep eye on the chart and Check BTC movement at the same time
This is not financial advice
USE STOP LOSS

#KAVA Ready for ATH ?In Daily TF, Kava is inside the rising channel.
Bulls success to break the falling Trendline.
Expecting massive pump in the coming weeks.
Send IT!

KAVAUSDT - SETUPKAVAUSDT price is breaking up with a strong volume and momentum. Bulls will make sure to close above if any upside move is on the cards. So wait for the upcoming and trade accordingly.

kavausdt 1d daily resistane trend line is broken now we see HH and going up if you take a long positoin do make sure to put your stoploss trand carefully

BITCOIN 6H TA: Can Support again?In the previous one-hour Bitcoin analysis, the trend line we had drawn was maintained, and with the impact of resistance, a downtrend was formed and the market fell and reached the support range again. We currently have significant support for trend line dynamics in the 6-hour timeframe, which increases support expectations.
In Price Action Classic, a descending structure is broken and a peak is created above the previous peak, and if a lower valley is not formed, expect an upward trend.
Its not Buy or Sell SIGNAL
DYOR
BY : Mohamad Teriz - @AtonicShark

Gnarly Long KAVAA pretty gnarly trade suggestion and not the cleanest with stop-loss placement.
We are above the cloud on the 1 hour and also higher time frames like the 12 hour. (along with the lagging strand). Almost looking for a continuation of the prevailing up trend.
In terms of stop-limit placement, it might be a bit of grin and bare it. Only smaller positions. The gains could be as equally big as the losses though.
A sensible trailing stop-limit could be the Parabolic SAR on the 1hour.

$KAVA Longggcurrently the strongest holding coin.
Pump is highly expected. Making a strong bull flag
Cheers,
nav

KAVAUSD Supported by the 1D MA50/ aiming at $11.50Kava (KAVAUSD) is having a strong bounce on the 1D time-frame, with the 1D MA50 (blue trend-line) supporting. This is similar to January - March 2021 bullish leg that made a Higher High on the long-term Channel Up.
The Fibonacci retracement levels within the Channel Up play a critical part as you see. The last Higher Low was made on the 0.786 level and since March 28 the price has been trading within the 0.5 and 0.618 level.
As long as the 1D MA50 supports, the price action will form a Golden Cross. The medium-term target on that is the 1.236 extension around $11.50.
*Note: The MACD on the 1W time-frame is already on a Bullish Cross. Always a sign leading to a rally.
--------------------------------------------------------------------------------------------------------
** Please support this idea with your likes and comments, it is the best way to keep it relevant and support me. **
--------------------------------------------------------------------------------------------------------

KAVAUSDT 6H TA: PRZ zone As we can see in the chart, the price jumped upwards when it hit the prz area, and we expect to correct the $ 5.5 area when it hits. So it is suggested to save profit. And re-enter if the $ 5.5 range is broken above. We expect a drop to $ 4.2 if corrected.
Its not Buy or Sell SIGNAL
DYOR
BY : Mohamad Teriz - @AtonicShark

KAVA/USDT about to breakout-TA
Kava / usdt after successful retest is not Dumping in this bad market. Tps are given Hopefully it will hit those
-FA
kava/usdt mainnet launch on may 05 and many other events in may aswell

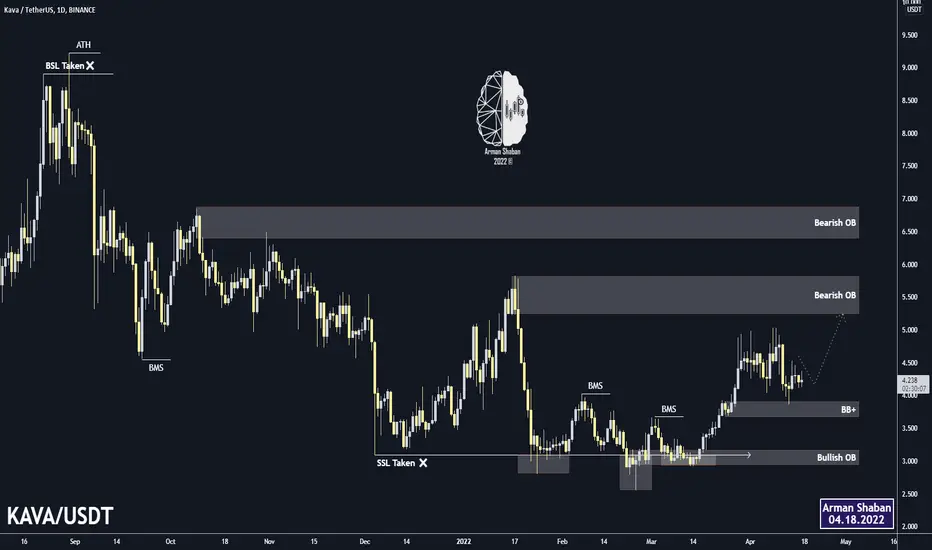
KAVA : Daily TA : 04.18.22 (IO)Technical analysis of #KAVA 's chart and its appealing ranges . Let's take a look at some of the high-potential cryptocurrencies in the market for investment, as you can see all the supports, resistances, targets, etc. are marked on the chart. Pay special attention to the specified levels that i mentioned in the chart . I think everything is obvious in the chart , but just in case if you had any questions pls feel free to ask .
Follow us for more analysis & Feel free to ask any questions you have, we are here to help.
⚠️ This Analysis will be updated ...
👤 Arman Shaban : @ArmanShabanTrading
📅 04.18.2022
⚠️(DYOR)
❤️ If you apperciate my work , Please like and comment , It Keeps me motivated to do better ❤️
KAVA.USDT (Y21.P5.E1).Macro TargetHi Traders,
I'm doing a series of posts looking for the new price discovery top based on structure, fib and previous history.
Kava has no history except the recent all time high.
With the assumption BTC is also going to do ATH, we will forecast in this perspective.
I have 2 models, standard and parabolic. Parabolic model requires certain events to happen before its valid, too early at this point.
The first is the parabolic model as the main post with the 1st as the main target.
The standard is below.
All the best,
S.SAri

KAVAUSDT TECHNICAL ANALYSIS Risk/Reward Ratio is 1.6 and the candle open close above to down trendline. Meaning the candles already leave from triangle. We have received multiple signals from our robo advisor @EngineeringRobo as well. We may earn approximately 11% if candle stay above to up trend-line.
Let’s follow our chart closely and do not forget to follow me as well.
“NFA”

KAVA Price Targets and Stop LossKAVA/USDT
Entry Range: $4.50 - 4.80
Take Profit 1: $5.10
Take Profit 2: $5. 65
Take Profit 3: $6.50
Stop Loss: $4.00

CARDANO on important SupportAccording to the chart, we are in the important range of static support and dynamic trend line support. We look forward to supporting this area again. If this range is broken down, the downtrend will intensify.
Its not Buy or Sell SIGNAL
DYOR
BY : Mohamad Teriz - @AtonicShark
