KAVAUSDT - Wait until timing for entryBINANCE:KAVAUSDT
4H trend chart
-
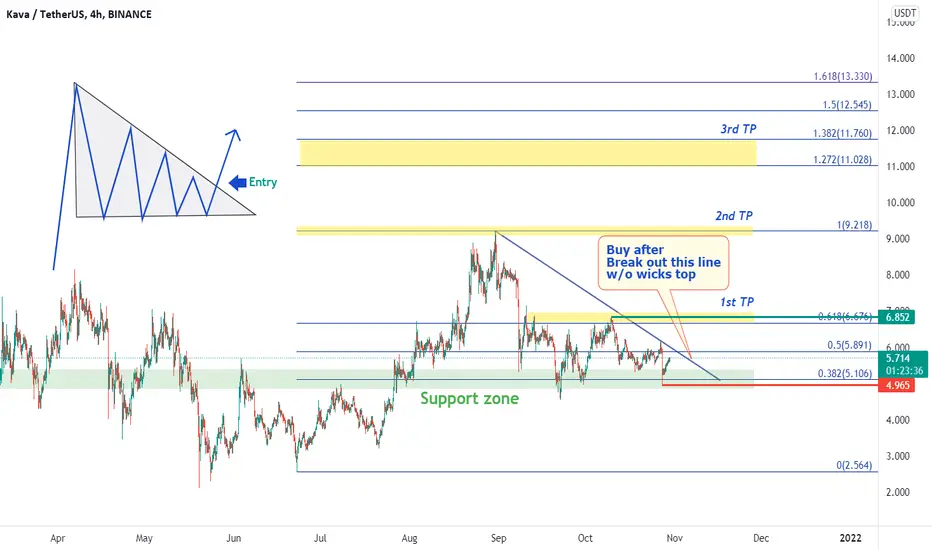
KAVA is consolidating as a triangle since 8/21
This triangle is formed with a downtrend line and support zone.
If price can break out the downtrend line, trading strategy as below.
-
Profit Targets:
a) 6.852----Green horizontal ray
b) 9.218----Fib(1)
c) 11.028~11.760----Fib(1.272~1.382)
Stop losses:
a) 4.9658-----Red horizontal ray
-
If you like this analysis, smash the "like button" and leave a comment below to share your thoughts
or let me know what crypto you want to see!
Trading is a reflection of yourself. Learn more daily and be ready for every opportunity.
Have a nice trading!
Kava
kavausdtHello friends.
Please support my work by clicking the LIKE button(If you liked).Thank you!
Everything on the chart.
risk is justified
Good luck everyone
Follow me on TRADINGView, if you don't want to miss my next analysis or signals.
It's not financial advice.
Dont Forget, always make your own research before to trade my ideas!
Will be very APPRECIATE FOR UR DONAT/coins :)
Open to your questions or suggestions(Looking for investors!).

KAVAUSDT Might Create an All-Time HighBINANCE:KAVAUSDT
PPPDirhams.
Disclaimer: This is just my idea. Am not liable for the end results if adapted by anyone. Trade cautiously as there are chances that you will lose your investment..

KAVA DESCENDING TRIANGLEKAVA is just at the end of a DESCENDING TRIANGLE which is normally a CONTINUATION pattern or BEARISH PATTERN.
DAILY TF we are breaking to the upside, but if it does not complete it is a FAKE OUT and we will see a RETRACMENT.
If it completes we have the targets as follows.
ENTRY 5.7-6.0
TARGET 1 $6.5
TARGET 2 $7.1
TARGET 3 $7.5
TARGET 4 $8.2
TARGET 5 $9.50 ATH
STOP LOSS $4.5 SPOT
STOP LOSS $5.4-5.6 3X LEVERAGE
NOT FINANCIAL ADVICE!

KAVA USDTMy view about KAVA
1. KAVA is moving in bullish trend
2. KAVA have a potential forming IHnS which is right shoulder can be falling wedge
3. MACD have a bullish reguler divergence. which is it can be a potential reversal if MACD can be golden cross.
You can spec buy, and avg up if it breakout from falling wedge. manage your own Money Management
cheers,
-NFA_

kava we can see soon to 10-12$Current trend of kava
I am bullish right now and soon we can see breakout

KAVA/USDT ANALYSIS Important SupportCurrently KAVA/USDT trading at its Important trendline support. 🤞HOPE it Holds the support
CMP - $5.7
If it breaks than we will see our next support at $5.


The triangle under the neckline KAVAIn KAVAUSDT 4h
It could not break out the neckline and became a triangle pattern.
If triangle pattern and be breaken out and the double bottom also can be confirmation .
Let's setup the plan
TP1:7.017
TP2:7.230
TP3:7.686
TP4:8.426
SL:6.078

KAVA - is preparing to skyrocket 👀🚀There was a strong rise in the bitcoin chart yesterday. Bitcoin is now in consolidation, if this continues most altcoins will rise. KAVA is in an accumulation, if the price is pushing towards a key level, that would be a good signal for a breakout and continued growth.
Write in the comments all your questions and instruments analysis of which you want to see.
Friends, push the like button, write a comment, and share with your mates - that would be the best THANK YOU.
P.S. I personally will open entry if the price will show it according to my strategy.
Always make your analysis before a trade.

There is a potential double bottom in KAVA 4h In KAVAUSDT 4h
It broke out the downtrend and went down after tested the neckline .
If it can go up and higher than 1(6.490)
TP1:7.017
TP2:7.230
TP3:8.426
SL:5.913

KAVA targetshello
we are having a downtrend pattern , as you can see two LL and LH is formed , the target is in the chart and the stop-loss is breaking the white area
not financial advice

KAVA targetshello
this is my short position for KAVA you can see my stop loss and my 3 targets
not financial advice

KAVA USDT BUY 10% OF YOUR FUND#KAVA USDT Update:
$KAVA currently trading at $5.323
And $5.490 is the next resistance.
So what now..?
KAVA is touching the long-time trend line so we expect a good pump in the chart(65% PROFIT---60days ), MACD and TSI show that the power of buyers is increasing.
If KAVA breaks the 4.093$ support level then KAVA is entered in a bearish zone.
SIGNAL:
spot market
risk /reward ratio: 3.96
Buy and sell step by step
entry prices: (5.323$____5.037$____4.688$____4.475$)
targets: (5.490$____5.831 $_____5.095$____6.95$____6.254$____6.995$____8.799$)
SL:4.093$
Must follow me for the latest crypto real-time updates.
good luck :)

🔥 KAVA Massive Wedge Pattern: 1-Year AnalyzedOver the course of a year, KAVA has produced a massive wedge pattern.
With the most recent reversal of the crypto market, KAVA has bounced off the support area.
In the coming weeks, I'm expecting KAVA to make a push towards the top of the wedge. be aware that the wedge is a bearish wedge pattern, so the expectation is that a bearish break out will occur at some point in the future. Keep a close eye on the market to determine where we're going in the near future.
Happy trading!

KAVA - is preparing to skyrocket 👀🚀Bitcoin continues its rise, with most altcoins in accumulation. One such altcoin is KAVA.
KAVA is squeezing near the key $6.4 level. Additionally, the price is forming higher lows, which is a good signal for growth. If the price breaks through the $6.4 level and tests it as support, this would be a good buying opportunity.
Profit-taking area marked above.
Write in the comments all your questions and instruments analysis of which you want to see.
Friends, push the like button, write a comment, and share with your mates - that would be the best THANK YOU.
P.S. I personally will open entry if the price will show it according to my strategy.
Always make your analysis before a trade

KAVA / USDT BullishKAVA has made symmetric triangle on 4h chart, which it is ready to break. Next profit target is $7.14

kava usdtKava Labs expands crypto-native financial product portfolio to allow retail & institutional users to efficiently trade, earn & maximize yields.

KAVAUSDT LONGKAVA LONG PLEASE LIKE
KAVA CAN MAKE NEW ATHS.
ENJOY
kava is a strong coin and it have a powerful ascending trend. there is a support and it ll bounce back from here. u can buy it

kava trend analyse(daily chart)many people are looking for right moment to buy kava at right price price so when does the right moment come?
its quite simple just let the candles break out to blue zone and rsi rest at dash line then u can enter at right moment obviously after the huge movement kava needs some rest.
"not suggested to sell or buy"

KAVA/BTCI think KAVA is ready for breakout!
Targets are mentioned in the chart.
Please do not get greedy.
If you liked my idea, follow me for more.
KAVA USDT PUMPING Quick Analysis Longkava is making Cup and handle on 1hr chart we can see Kava bullish

KAVA *MAINNET LAUNCH* IS COMING...The KAVA mainnet will be launched on August 3. Check it out:
coinmarketcal.com
-------------------------------
If we lose the 7.73 support, reaching the bottom of the channel will be expectable.
