Kava

EMPTY YOUR MIND: PSYCHOLOGY OF A TRADERWe have always believed that the business of Cryptocurrency Trading thrives on 3 things – Intelligence, Psychology and Information.
If all humans had the same level of IQ and everyone was emotionally zero (i.e. had similar psychological traits) and if the flow of information to everyone was equal, then what purpose would the Crypto markets serve?
None whatsoever. In fact, it would become the most boring fixed income scheme you could invest in.
Nevertheless, of these three traits, human psychology has the maximum impact on the movement of Crypto prices in the short-medium term.
It is the psychology of a trader to overcome biases and human emotions like greed and fear and envy and desire that sets him apart from the others.
Mostly, a trader just reacts and makes a lot of money if he can correctly predict the behavior of others.
In order to succeed long term you must first understand your self and the relationship between yourself and the market.
Your emotions, thoughts, and perception of the market, and how these relate to actions taken in the market place.
If you do not believe these are directly connected with your actions and therefore performance, you will likely struggle to maintain a consistent performance.
Rather than viewing your emotions as an enemy, learn to use them to your advantage.
Learn to understand the circle or cycle between you and the market.

KAVAUSDT AnalysisEngineeringRobo and I are Bearish about KAVA at the moment
Holding KAVA is not advisable at the moment as 3 out of 4 EngineeringRobo signals are present and Risk/Reward ratio is below 2.
If you are interested in buying KAVA your options are:
- Buy when at least 2 of 4 EngineeringRobo Buy signals are present with R/R ratio 2 or more.
- Buy if candles break above the 2.197 resistance level, turning it to the support level
- Buy at the 0.798 support level.
- You can buy if the candles coming from above touch the uptrend line
If buying with EngineeringRobo buy signals, pay close attention to EngineeringRobo sell signals.
If you are interested in using EngineeringRobo, DM me!

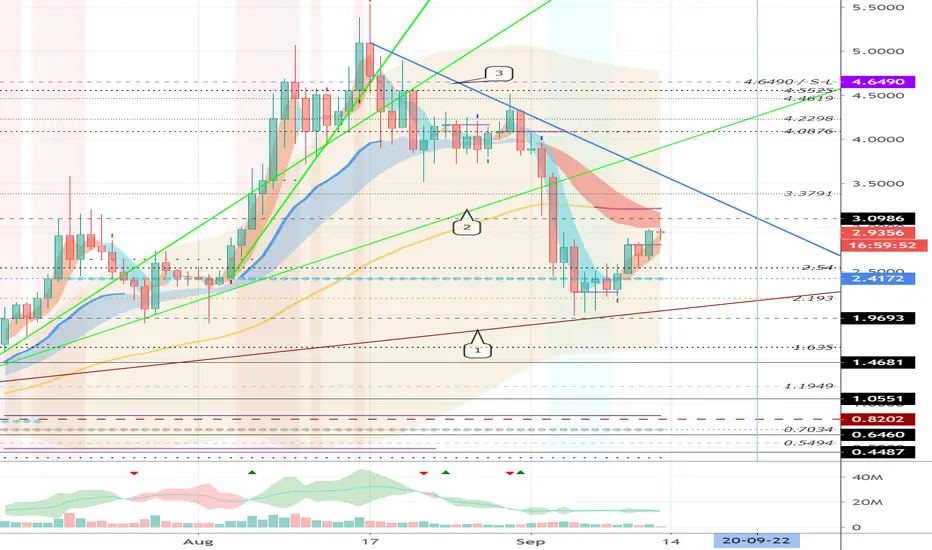
Kava.io (KAVA) - October 1Hello?
Dear traders, nice to meet you.
"Like" is a huge force for me.
By "following" you can always get new information quickly.
Thank you for always supporting me.
-------------------------------------------------- -----
Make sure you can get support at point 2.4172.
If you get support at 2.4172 and keep the price above 2.54 while breaking the downtrend line (3), you're likely to touch the 3.0986 point.
If it falls from the uptrend line (1), it is a short-term stop loss
It is important to see if it deviates from the downtrend line (3).
-------------------------------------------------- -------------------------------------------
I think it is a period of volatility from September 21st to October 1st.
Therefore, I think careful trading is necessary.
About October 28, when maximum volatility is expected to occur, is about a month left.
The most important thing is to generate money, so I think it's time to trade to earn money.
** Check support, resistance, and abbreviation points.
** Support or resistance is based on the closing price of the 1D chart.
** All explanations are for reference only and do not guarantee profit or loss on investment.
Explanation of abbreviations displayed on the chart
R: A point or section of resistance that requires a response to preserve profits
S-L: Stop-Loss point or section
S: A point or segment that can be bought for generating profit as a support point or segment
(Short-term Stop Loss can be said to be a point where profits and losses can be preserved or additionally entered through installment trading. You must trade from a short-term investment perspective.)

KAVA - Punch Up Soon?KAVA has been one of my favourite crypto's in terms of profit.. It has very consistent moves and once it starts going it tends to finish the move.
Inclusion in a few liquidity pools means lots of demand right now.
Price is low ATM great time to snap it up.
Heading to bullish on the MACD 1D, may turn bearish on the 4H.
Stoch isn't in over bought yet on 1D, near over sold on 4H. Short term gains incoming?
Volume is low ATM. If the market pumps continue this will start soonish.
Below the red EMA's on both charts. I should make that EMA green, because it's basically the money line.
Might be able to catch a bounce based on 4H, but best plan would be don't bet the house on it and plan to reload a smaller initial long if it bounces. Bottom support rather unlikely to break, but set an SL below it just in case. Nothing is certain
TP's
#1 - 0.00022 (EMA on 4 HR)
#2 - 0.000237 (EMA 100 on 1D + fib level)
#3 - 0.000282 (fib level + previous spike)
SL: 10% max from here. I don't see it going past the bottom.
Be safe, good luck. This is not financial advice.

KAVA - good R2R trade if resistance line breaks (LONG)KAVA has a very good R2R trade idea. Currently they are 3 main patterns which mix in different timeframes.
1) In 1D KAVA is in big H&S pattern and "blue" line in chart is the resistance zone. IF this breaks will be the best scenario.
2) On 4 HRs frame we have a good trendline which holds the current move from 24th. If this holds in next few days will be good indicator
3) Again on 4 HRs we have resistance line which mix very well with 1D H&S pattern. I want to see this breaks
Trade will be like:
Entry: After break and retrace to H&S resistance line
Exit: 2.1+ (even higher if BTC holds)
SL: ~1.82
Overall 2:1 R2R

KAVA: ShortWait for the support to be broken and buy at the retest.
Please hit LIKE if you find this idea useful!

KAVAUSDTConfirmations for my decisions are double bottom, breakout from resistance trendline and a pennant pattern.
Take advantage with proper risk management.

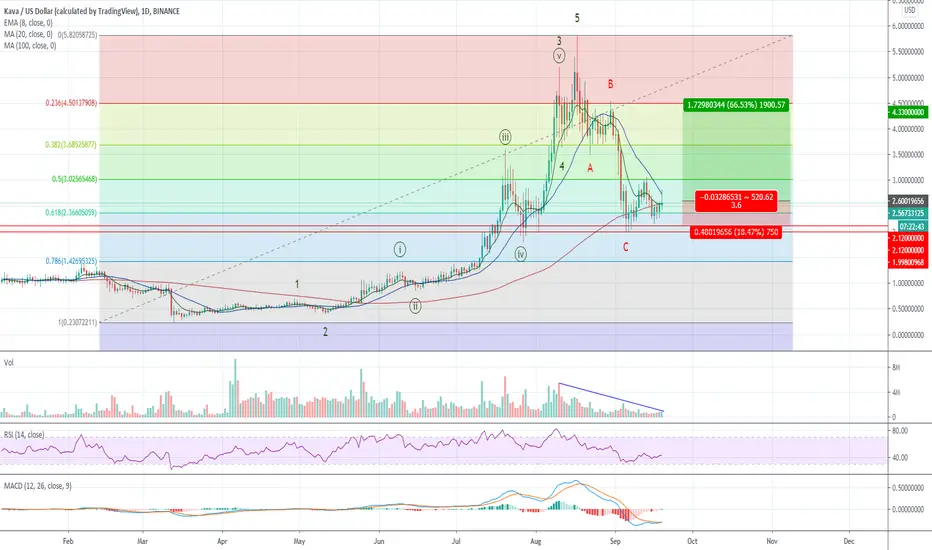
KAVA Bouncing at SupportBINANCE:KAVAUSD
Kava is bouncing at the $2 USD support level, near the 61.8% Fibonacci Retracement Level, MACD is just starting to give a buy signal, RSI is ticking higher. The previous decline from the $5.82 USD level was with decreasing volume, and this seems like a good place to go long.
In Elliott Wave Terms, we had a 5-wave move to the upside, followed by a 3 wave decline to a level a little beyond the 61.8% level, which is typical.
The Earn campaign for Kava is currently live, coinmarketcap.com
So, the trade is to go long here at $2.60 USD with stop at $2.12 USD and a price target of $4.33 USD, which should give us a risk-reward ratio of 3.6 to 1, which is pretty good.
Not a recommendation, just what I’m doing.
Good Luck to You
KAVA - head and shoulders or coiling to jump higher?KAVA - head and shoulders or coiling to jump higher?
When BTC goes up the ALTS Exit -
KAVA has a head and shoulders pattern
which usually mean its going down
unless it become a reverse head and
shoulders but time will tell.
not financial advice

KAVA.BTC (Y20.P4.E1).Next stage.Macro structure TAHi All,
Keeping this short as there are many to reviewed:
Came across this which showed simplicity as well.
Although I posted in on the 8 hrly chart, refer to the daily for means of trading as the Daily chart gives a more accurate trading perspective >
Note we are on the bottom of the B.Band > extended hence I see it moving towards the mean of the BB and the daily RSI supports this with the wedge formation, all occurring at 2 main fib levels.
If you haven't entered already, try to look at the 1 hrly time frame to seek that right entry level using the Daily RSI as a guide for the boundaries;
If it breaks the RSI trend line, then its likely to go up.
I have it pulling back as per the daily RSI for completing point E of a wedge.
Regards,
S.SAri

Kava.io (KAVA) - September 13 Hello?
Dear traders, nice to meet you.
"Like" is a huge force for me.
By "following" you can always get new information quickly.
Thank you for always supporting me.
-------------------------------------------------- -----
It remains to be seen if it can rise above the 3.0986 point.
If you break the downtrend line (3) around September 22 and get support above the 3.0986 point, I think there is a high possibility of further gains.
If you fall from the uptrend line (1), I think you need to trade to preserve profit and loss.
If it declines and gets support again in the 2.4172-2.54 section, the flow described above is valid.
-------------------------------------------------- -------------------------------------------
** Check support, resistance, and abbreviation points.
** Support or resistance is based on the closing price of the 1D chart.
** All explanations are for reference only and do not guarantee profit or loss on investment.
Explanation of abbreviations displayed on the chart
R: A point or section of resistance that requires a response to preserve profits
S-L: Stop-Loss point or section
S: A point or segment that can be bought for generating profit as a support point or segment
(Short-term Stop Loss can be said to be a point where profits and losses can be preserved or additionally entered through installment trading. You must trade from a short-term investment perspective.)

KAVA is very close to perform a 10% move!Just a quick analysis on KAVA.
- EMA's uptrend
- RSI above 60
- Third buying wave in a row
- In resistance area
Overall looks good, I am in since 2.7501, looking for around 10%, I will see how it acts in the TP level of $3.06.
TP1 below $3.06
TP2 below $3.315
This should go well!
Tibor

KAVA/BTCKava testing the top of the ascending channel. In confluence with the bottom of the falling wedge. Message me for more deets.

KAVA to double digits!This chart is just an example of this strategy, go try this out with your shitcoins!
This is simple buy startegy for bull markets (1D,USD charts).
Buy opportunities are based off RSI and EMA200 close only.
1. When a shitcoin crosses over EMA200 properly, and bull market is starting, its time to start using this strategy!
2. This asset now needs to stay above EMA200.
3. Put a horizontal line at both 50 and 60 RSI, when RSI hits around that level, u start u looking for buys. When RSI hits 50 or lower, its a good buy opp. Riskier buys are around 60-51 RSI.
4. EMA200 hits are your other good buy opp if the price drops back that far.
Sometimes the price may dip below EMA for a few days, so do not panic if it does! U should start to worry only if the price is over than a week under this magic line, or the price tests it as resistance on a daily when under.
After the accumulation range is broken u usually don't get EMA touches anymore, but when u look at RSI u can still get a few good entries before moon and lambos.
buy boxes:
green: good buy (50 or lower RSI, even better if touching EMA)
yellow: buy with more risk (60 to 51 RSI, trade gets riskier when price is far from EMA)

Just siting back and enjoying the show for KAVA
I post the image twice because I'm still getting used to this interface. I digress...
Kava is getting ready to make a big move. SO LONG AS BITCOIN DOES NOT DROP , I'm expecting quite the show. $Kava to a new high of about $7.50 and here is why. It's payday around the globe. In places like Spain, India and other countries the norrm is getting paid only once a month on the first. Kava is only readily available for purchase outside of the US for reasons unbeknownst to me. Nonetheless, we see these big moves lasting about 7 days around the first of each month, as highlighted in the chart. We are just 2 days away from the 1st of September, so buckle up. Just imagine when this hits Binance.US or Coinbase or Crypto.com or any other exchange that Americans have easy access to. Plus! Congress will be back in session and with election day coming near those stimulus checks are bound to his the hands of everyday crypto enthusiast...

KAVA about to PUMPmacd showing signs of reversal/uptrend continuation.
touched and tested resistance now turned support levels of the last impulse climb.


KAVA Bullish Trend cross MA 20 & 50 + increase Ema + Trend Line
The KAVA is the one of the best investment coin.

Yes, short term downtrend is exhausted. Kava has been moving fast, make corrections opportunities.
Depending on what bitcoin does we will be back on the path to see new ATH, making preview resistances support on the way.
Ps: Announcements coming in the end of the month.
+
ideia for swing trades opportunities on the MKRBTC/KAVABTC Ratio

Waiting close above 35886KAVABTC needs to close above 35886 on 8h chart to start new wave. Targets are 39161 and 40220 according to Istanbul indicator.
The above references an opinion and is for information purposes only. It is not intended to be investment advice.

LEND + YFI + CRV | Levels for DeFi Yield Farming Tokens 🌾🚜🐄💬 Any cross-section of DeFi will look good due to yield farmer FOMO. However, some serious projects like LENDUSDT, YFIUSDT, CRVUSDT look especially good to us from both a TA and FA standpoint.
Yield farmers can utilize LEND's AAVE platform to farm Curve's yCRV using YFI Vaults. Meanwhile, while Curve's current chart looks a bit like how do you say 💩, the underlying Curve technology is interesting, and thus at least some of those farming yields may want to be aware of support and resistance levels not only for LEND and YFI, but for Curve as well (even if only to maximize gains from yields).
Hit that 👍 button to show support for the content!
Help the community grow by giving us a follow 🐣
-----
LENDUSDT
Support:
S1: The S/R Flip range is where the most bullish of bulls will hope to find support. There is no rule that says LEND needs to consolidate more or test lower support before running. This DeFi gem is hot and could keep moving.
S2: Sure S1 is nice, but for a healthy uptrend there is no better support for bulls than the S2 S/R and orderblock range. This range would offer just the right amount of consolidation and could even result in a move right off the trend line.
S3: A quick wick down to the S/R and orderblock cluster if S2 doesn't hold also makes sense. We lose bullish market structure below this, so look for S3 to save us if things get shakey.
YFIUSDT
Support:
S1: There is only one logical place to look for support for YFI, that is this orderblock cluster at the bottom of the consolidation range. Not like other support can't be found, but one doesn't want to see too much retracement after such a run.
Resistance:
R1: The S/R flip at the previous swing high is our first resistance point.
R2: If the bulls can take R1, then the orderblock range at the previous high is our last point of resistance before YFI's price starts putting BTC to shame.
CRVUSDT
Support:
S1: People are farming CRV and dumping it, striping VC Curve holders of their natural resource (value). That said, bears better hope the farmers can dump below the S1 orderblock range, because there is some solid support there and the more it is tested and holds, the more it looks like a potential bottom.
Resistance:
R1: Everyone is likely to take profits at the orderblock at the previous high, so watch for resistance here.
R2: A break above R1 means an uptrend could be in the works, it would be wise to look for a pullback at the S/R flip range here and consolidation on R1.
-----
Summary:
People are rushing into LEND and YFI to farm coins like CRV. As long as that gambit is playing out, we should see the current trends continue. Given that, we want to look for entries in LEND and YFI at support and cautiously dump our CRV crops at resistance. That said, Curve has some potential as an FA play, so it may be worth watching for how it reacts at support and resistance before fully dismissing it.
Resources:
defiprime.com
✨ Drop a comment letting us know what you think of this down below! ✨
