KAVAUSDT ❌ Bullish Continuation OR Bearish Correction (Multi TF)💬 Between the cryptocurrency exchange Kraken adding KAVA, the ongoing DeFi boom, and the recent series of higher highs on higher timeframes leading up to this point, KAVA's chart is looking bullish. Our goal here is to look for a pullback before price moves up again. With that in mind, let's take a look at some levels.
Hit that 👍 button to show support for the content!
Help the community grow by giving us a follow 🐣
-----
Support:
S1: S1 is a great support level to look at if all we get is a small pullback before moving up. You can see how price reacted to the S/R level (blue line) right under S1. We might see a shallow pullback similar to that at S1, with price then breaking past the recent highs before selling back on that top range to test it as support (as illustrated by the upper abc and note).
S2: If S1 doesn't hold, we could perhaps see a bearish correction rather than quick consolidation before a run. This path would be confirmed with for example by a rejection off of S1 after a test of the S2 orderblock cluster. The S2 level held on the way up, so we do expect a reaction here regardless.
Resistance:
The previous range highs are the first and only point of resistance for KAVA bulls. Any additional resistance would have to be created by falling price action (for example if we get that bearish correction noted in the support section).
Multi Time frame: :
The multi-timeframe S/R and orderblock cluster and main price pivot point, as visualized on the 4-hour and brought onto the 30-minute chart, is a logical support given the amount of activity seen here. If we do get that bearish correction, this is the level that must hold for KAVA to remain bullish. Anything below this level is a very bad look for the bulls, the progress made after conquering such a substantial range such as the one highlighted on the 4h-hour would all be given back.
-----
Summary:
KAVA is hot right now, could be some time before it gets hotter given its new listing and the DeFi craze. No matter how hot something gets though, price is always going to pull back eventually. The goal here is to buy that pullback with the assumption that the bulls aren't going to give up too much ground. With that in mind, caution is in order if you see that bearish correction plays out. What makes sense here is being focused on new highs above S1 and using caution otherwise.
Resources:
www.coindesk.com
✨ Drop a comment asking for an update, we do NEW setups every day! ✨
Kava

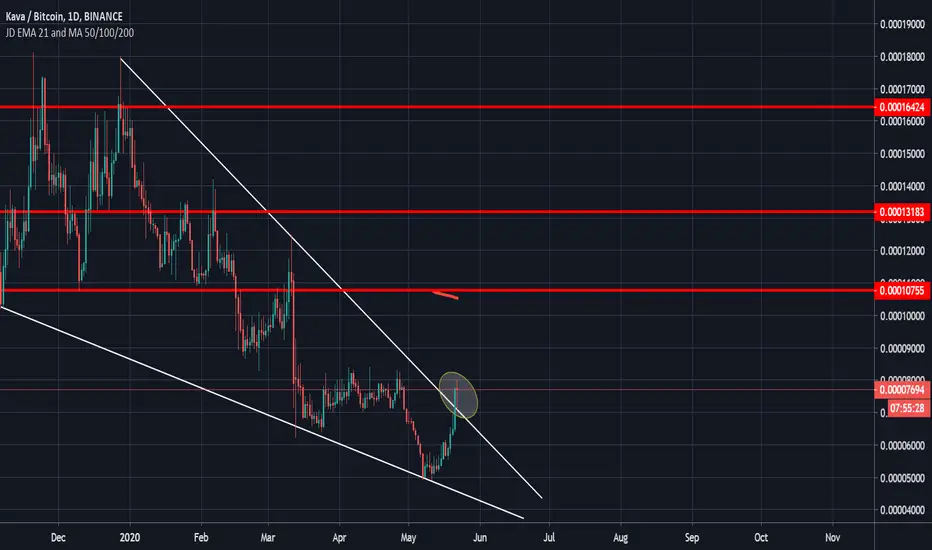
KAVA / BTC in A Price DiscoveryKava is trying to get out of a falling wedge for period of time although it has broken out a strong resistance and now it is currently in search of a market price. We will see what is going to happen.

KAVA/USD broke significant resistance, moon incomingThe Kava price action of this week is extremely bullish. Kava has no further resistances. From now on, Kava could tremendously increase in price.

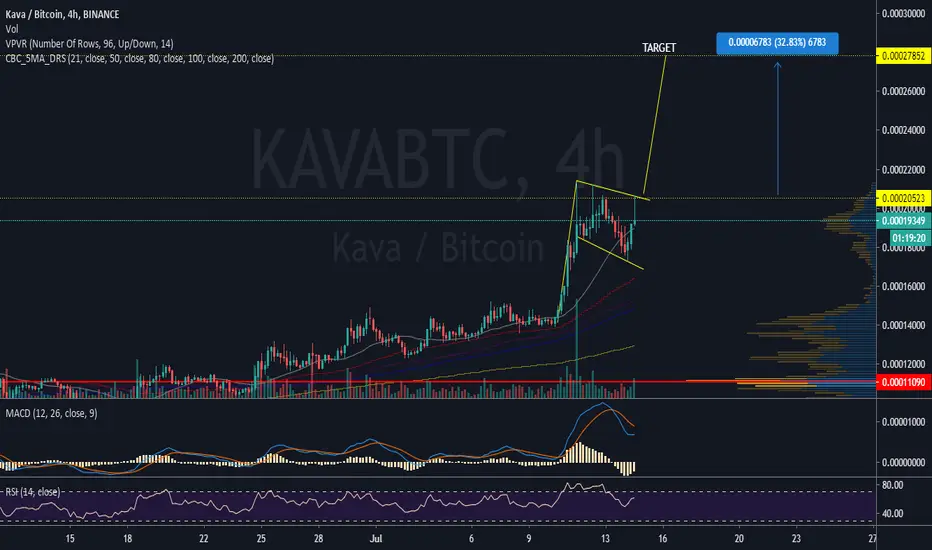
$KAVA, Flipped ~13.5k sats level & now is pushing up...$KAVA
Flipped ~13.5k sats level & now is pushing up, volume is not there but its still... (careful)
If continuation happens, it may retest ATH BTC levels over the next days...
100% up since latest Buy signal on the daily..
#KAVA

KAVA.BTC (Y20.P3.E1).StalkingHi All,
Kava is another Defi compliant product. It continues on its upwards trend with the possibility of new macrostructure new highs.
Its holding above the 0.0001407 sato or $1.288 USDT mark and as long as it holds above the current uptrend structure I would not be bearish on it.
The caveat, as long as Bitcoin can hold up, we can see KAVA continue into price discovery.
Please give me a like or tick for this post.
Regards,
S.Sari
Daily KAVA.BTC chart, has a bearish div. however as we know, if it makes new highs, the div. is negated.
KAVA/USDT Chart, 12 HRLY

DeFi Index (COMP, KNC, LEND, MKR, KAVA, LRC, REN, REP, BNT, SNX)DeFi coins is hyping around crypto and here is TA for them.
On FTX we can see the DeFi Index based on charts of COMP, KNC, LEND, MKR, KAVA, LRC, REN, REP, BNT, SNX and ZRX (each coin is weighted equally). It can be traded at FTX with up to 100x leverage.
So on the price i marked all triangle shapes and found Giant Wedge
It already breaking out from it and possible will make sideways inside the triangle. Best way to avoid trading here and try to fix position in the Sell Zone. Or wait for the buy opportunity in the Support zone.
Thanks for your attention,
stay tuned
This is Artem Crypto

Bullish Accumulation Pattern after ressistance breakout on KAVA Hello, Traders.
KAVA breakout a bullish accumulation pattern above the resistance level (now support).
The Williams Alligator trend following Strategy shows us a bullish Trend on the daily chart since May.
The Willians Alligator is an indicator developed by Bill Williams. an early pioneer of market psychology
Its use is to identify a trend including the direction of it and filter the good signs or bad signs of ruins, preventing the market break that can cause damage.
The indicator consists of 3 moving averages shifted towards the future:
- Alligators Jaw (blue line): the smoothed moving average of 13 periods displaced 8 bars in the future.
- Alligator's teeth (red line): the smoothed moving average of 8 periods shifted 5 bars in the future.
- Alligator's Lips (green line): the smoothed moving average of 5 periods shifted 3 bars in the future.
TREND FORMING: The lips of the Alligator, the green line, is the fastest moving average and will be the first one a trader will want to monitor. You want to see the green line cross both of the slower moving averages. This is a sign that the Alligator is waking up.
When the “mouth” opens it is Buy or Sell indication and when the mouth is closed it is a take profit indication.
Push The like Button and Follow us on TradingView.

KAVA ascending triangle breakoutSimple setup, triangle breakout. SL below breakout candle - crossing it would invalidate the setup. Resistance levels highlighted in the chart.
Also, kumo breakout on June 4, cloud's top retest on June 17th. Undeniably bullish trend, and now there's a decent setup to get in.

KAVA breakout of resistance trend line KAVA breakout of resistance trend line. Potential target after breakout resistance at 0.00012.
Strong supprot at 0.00009785.
Disclaimer: THIS IS NOT FINANCIAL ADVICE. All the information shared here is for learning and entertainment purposes only.

LONG - KAVA - Trading OpportunityAfter BINANCE:KAVABTC first breakout from the daily cloud, it is now retesting the flat top of it,
while at the same creating a bullish divergence, targeting previous highs and next resistance as target.
Entry: 0.00009730
Target 1: 0.00011340
Target 2: 0.00012111
Target 3: 0.00013232
SL: 0.00009058
CryptoCue is not providing investment advice and is not taking subscribers’ personal circumstances into consideration when discussing investments. Investment involves a high degree of risk and should be considered only by persons who can afford to sustain a loss of their entire position.
CryptoCue is not registered, licensed or authorized to provide investment advice and is simply providing an opinion, which is given without any liability or reliance whatsoever. The information contained here is not an offer or solicitation or recommendation or advice to buy, hold, or sell any security. CryptoCue makes no representation as to the completeness, accuracy or timeliness of the material provided and all information and opinions provided by CryptoCue are subject to change without notice and provided on a non-reliance basis and without acceptance of any liability or responsibility whatsoever or howsoever arising. You hereby irrevocably and unconditionally waive, release and discharge: (a) any and all accrued rights and/or benefits you may have against CryptoCue in respect of any opinion expressed or information conveyed by CryptoCue at any time; (b) any and all Claims you may have against CryptoCue arising out of any opinion expressed or information conveyed by CryptoCue at any time; (c) CryptoCue from all and any claims (whether actual or contingent and whether as an employee, office holder or in any other capacity whatsoever) including, without limitation, Claims you may have against CryptoCue arising out of any opinion expressed or information conveyed by CryptoCue at any time. ("Claims" shall include any action, proceeding, claim, demand, judgment or judgment sum of whatsoever nature or howsoever arising.) You hereby agree to indemnify and hold harmless CryptoCue in respect of any and all Losses paid, discharged, sustained or incurred by CryptoCue in the event of bringing any Claim against CryptoCue. (“Losses” shall include any and all liabilities, costs, expenses, damages, fines, impositions or losses (including but not limited to any direct, indirect or consequential losses, loss of profit, loss of earnings , loss of reputation and all interest, penalties and legal costs (calculated on a full indemnity basis) and all other reasonable professional costs and expenses and any associated value-added tax) of whatsoever nature and/or judgment sums (including interest thereon).


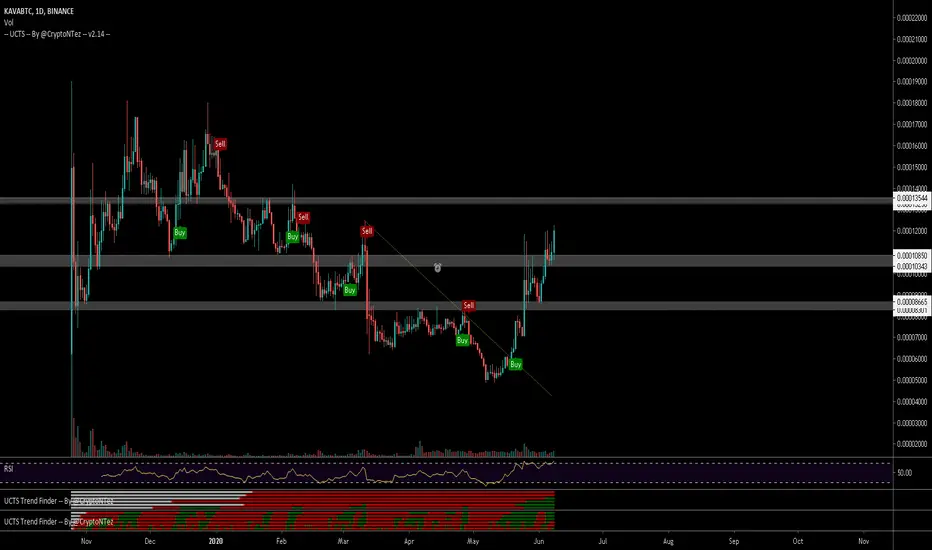
$KAVA, Flipping ~10.8k sats level into support$KAVA
Flipping ~10.8k sats level into support as UCTS is showing buy signals across 1-4D charts
Volume slowly starting to rise again...
Continuation should lead to a ~13.5k sats target (~20%)
Aim for entry as close as possible to support level
#KAVA
Kava Usdt Short Term Work For 2$The descending wedge fractal that I had been waiting for a long time was formed. My target is 1,5$ ~ 2$ for now. it is definitely not investment advice. is my personal work. Good luck to everyone.

Kava has breakout the level of 50 EMA - price is on ascending triangle ( black line ) since 16th march
- it struggle to pass EMA 20 zone almost 10 days
- Next 4 days after price jump over EMA 50 which is confirmed breakout to climb further
- short term resistance is at 0.70 ( %16 profit target )
- price is already in ichimoku cloud and near resistance zone is at 0.76
What do you think ?
- NOTE: This is not a financial advise, please trade with your own decision
Regards


KAVA/BTC. Great profit. 130 \ 155%Great profit. 130 \ 155%
The surest way to work now on the market is to work in the channel
Everyone perfectly understands the situation on the market: the dominance of BTC is growing noticeably, and it follows from this that people are getting out of the position regarding altcoins
therefore we trade against the dollar or USDT


KAVA/BTC (MONTHLY), CYPHER PATTERN LEG UP, 120 PERCENT MOVE UPBullish Div on daily with rsi and the nice harmonic setup. I AM NOT A FINANCIAL ADVISER, DO YOUR OWN RESEARCH!
