CRV ADAM AND EVEIn this chart, BINANCE:CRVUSDT is forming a cup and handle pattern from an intraday perspective. The pattern is suggesting a bullish move for the coin from its past downtrend movements. I'll provide more updates on this thread below. Happy trading!
Kava

KAVA/USDT KAVA is now in the process of retracing back on demand💎 KAVA has notably captured the market's attention, and its current position indicates a pivotal moment in its market trajectory. KAVA is now in the process of retracing back to the demand area for a retesting phase.
💎 Despite this, the overall trend for KAVA remains bullish, suggesting that there's a strong possibility of a price bounce from this demand area, potentially propelling KAVA towards continued upward movement with a target of reaching a strong resistance area.
💎 However, should KAVA struggle to rebound during this retesting phase in the demand area, there's a risk that it might lose this crucial support or even break below it. Such a development could signal a shift in KAVA's market trend from bullish to bearish, potentially leading to a descent toward a key support area.
💎 This support area serves as the last line of defense for KAVA's bullish trend. A breakdown of this support level would be a significant bearish indicator, suggesting a possible move towards a stronger support area.

KAVAUSDT 1DGuys, keep your eyes on this currency,
KAVA has done a good floor construction and made a higher floor than the previous floor, also the cloud of Ichi has broken one day.
I expect the price to grow up to the indicated area (0.94) Then the price reaction to this level should be re-examined
Its main resistance, which is dynamic, is at 0.95, and static support is at 0.7. If he can break the resistance, we can expect very good moves from him. It is almost 9% away from this price to its main resistance.....

KAVA to 1.26 or even 2.8?0.73 was a crucial zone, Kava was able to close to candle above it which is huge sign to go up. Last week's candle was bit worrying but couldn't close the candle below the crucial zone. And this week's candle looks promising. I will be taking profits at those green lines.

KAVA will explode soonIt looks like a large bullish triangle is being completed.
If KAVA maintains the green range, it can move towards the targets. I specified the targets. Fixing 1 daily candle below the green range will violate the analysis.
For risk management, please don't forget stop loss and capital management
Comment if you have any questions
Thank You

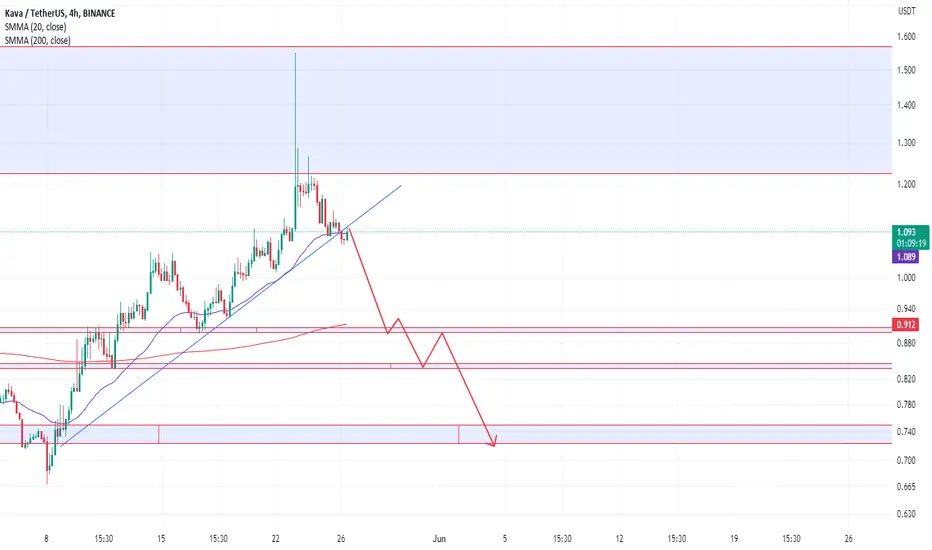
#KAVAIt is moving in a short-term downward channel after the recent drop in the one-hour timeframe. If he is able to break this channel, he can try again to the previously built supply area after the pullback.

KAVA/USDT Potential Bull Journey Ahead? 👀🚀KAVA Analysis 💎 Paradisers, shift your attention to KAVAUSDT, which currently presents a promising setup in the demand zone, further strengthened by a recent Market Structure Shift (MSS). This situation indicates a high potential for an upward movement.
💎 When examining Kava's pattern, KAVA tends to break above its descending trendline, indicating bullish momentum. It's approaching a significant Bearish Order Block (OB) challenge, with continued momentum above the EMA100 suggesting potential supply targets at $1.07 and $1.2.
💎 However, given the volatile nature of the crypto market, it's essential for KAVA traders to remain prepared for various scenarios. Should the anticipated bullish surge fall short, a pivot to a rebound strategy from the support level of $0.759 will be crucial.
💎 A decline below this support level would call for a shift in strategy, highlighting the need to re-evaluate the bullish stance and adapt trading strategies to the changing market landscape.
💎 Stay alert and tactically astute, Paradisers. Your ParadiseTeam is committed to providing you with the insights and guidance needed to make informed trading decisions in these dynamic market conditions.

KAVA / USDT - BullishShow some strong signs:
1: Fake breakout at 0.712 level
2: 200 moving average breakout
if continue uptrend and break previous high
Target
1.1.072
2.1.2
3.1.5

KAVA target 1.54h time frame
-
KAVA is creating a potential long-term double bottom structure. Currently making a cup and handles pattern in lower time frame, this CH provide us a reasonable setting for SL. Also, if KAVA maintain the pumping momentum, there are three targets as below. Risk to reward is great, even only reach the first target.
-
TP: 1~1.05 / 1.17 / 1.5
SL: 0.725

KAVA/USDT Anticipating a Bullish Reversal? 👀 🚀KAVA 💎 Paradisers, focus on #KAVAUSDT as it shows promising signs of a bullish reversal. After encountering resistance in the supply zone, the asset is now poised for a potential upward continuation from its current demand zone.
💎 Reflecting on #KAVA recent performance, we've observed a decisive break above the $.708 supply level, leading to an upward trajectory. However, it faced resistance at a higher supply level. Current trends suggest a retest of the demand zone, which, if successful, could confirm a bullish double bottom pattern, indicating a strong potential for further bullish movement. KAVA is targeting supply levels at $.865, with the ambition to reach even higher at $1.057.
💎 Experienced traders know that such scenarios require nuanced timing and strategic entry points. It's vital to identify the most favorable moments for entering the market, while also avoiding the pitfalls of buying at the peak.
💎should KAVA break below the critical demand level of $.694, it may signal a significant bearish shift, necessitating a reassessment of the bullish outlook.
💎In this dynamic and evolving market, disciplined strategy and informed decision-making are key. Developing a robust trading strategy that incorporates effective money management and a deep understanding of support and resistance levels is crucial for achieving sustainable trading success. 🌴💰

KAVAKAVA must flip .91c then it will confirm my wave 3. Because the rest of the crypto markets are very bullish, their are many lagging 2021 coin and also 2017 coins. I think they will catch up soon.

KAVA/USDT Break and Bullish Momentum ??? KAVA Analysis Today 💎 KAVA has undoubtedly captured the market's attention. Presently, KAVA has broken out of the Descending channel and has entered a confirmed retesting phase. Observations indicate that after its retest on the resistance trendline of the channel, KAVA experienced a sharp upward trajectory, potentially aiming for the resistance zone.
💎 Should KAVA decisively surpass the notable resistance at $0.730 and sustain above it, there's a strong possibility for the coin to continue its bullish run, Probability targeting the supply zone and the bearish OB.
💎 However, if KAVA faces a setback at the resistance zone, it might retreat towards its proximate support to gather momentum. There's also a chance that KAVA could descend to the demand zone to build a more robust momentum for another attempt at breaking the resistance.
💎 if KAVA revisits the demand zone and fails to uphold its position, it could indicate a bearish trend. This would mean a potential downward spiral for KAVA, with the coin possibly gravitating towards its key support zone.


KAVA Long OpportunityNot a lot to this trade, beside longs rotating toward KAVA probably by mid November to hit this target.
Good luck!

kava breaking multi year downtrend sems like preparing for massive recovery formed and breaking falling wedge in 3 days timeframe expecting successful breakout soon trend line is weak due to multiple tests
incase of successful breakout expecting massive recovery in coming days expecting move towards 2.50$ keep eyes on kava and try to catch some after breakout

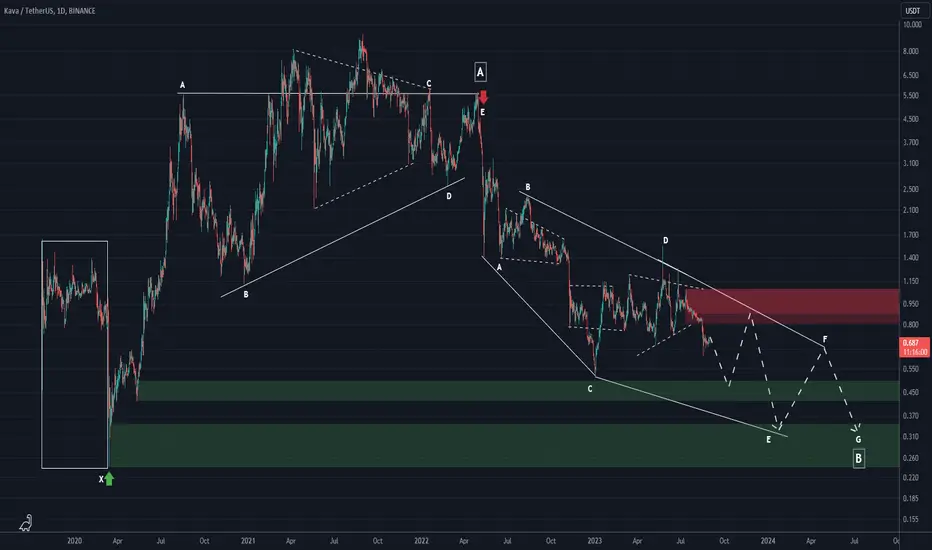
KAVA ROADMAP (1D TF)It seems that we are inside the diametric diamond of the big B wave.
It seems that we are now in wave E of this diametric.
Green areas are relatively strong support areas.
In terms of time, each branch is between 48 and 150 bar.
We have plotted the fluctuations that we expect from KAVA in the daily time frame.
We have plotted the fluctuations that we expect from KAVA in the daily time frame.
For risk management, please don't forget stop loss and capital management
Comment if you have any questions
Thank You
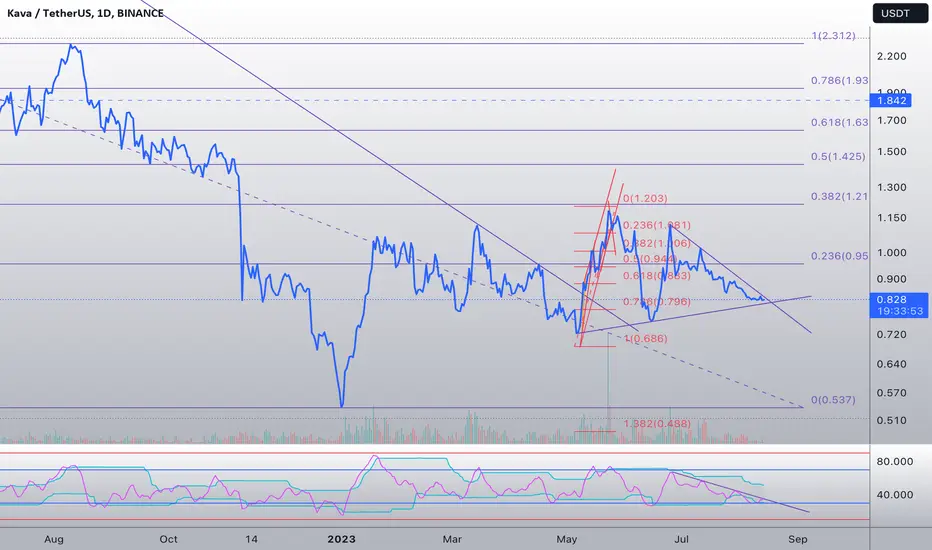
KAVA Long idea In the ever-evolving realm of cryptocurrency, where fortunes flicker like distant stars, Kava emerges once again, inviting traders on a fresh journey of potential gains and exhilarating market maneuvers.
Picture the chart, a line of time etched with the memories of past movements. A channel, like a road leading to possibilities, draws our attention. It’s not just an ordinary channel, but a path that has proven its significance in the dance of prices. This channel, like an old friend, has seen the rise and fall of trends, and now, it beckons us once more.
Step back for a moment and ponder the Stochastic indicator, that little oscillating wonder. It's in a state of rejuvenation, its readings bottomed out. It’s as if the market's heartbeat has found its rhythm, preparing for a new pulse.
As we study this chart, the Fibonacci 0.786 level glows like a beacon. A level where altcoins seem to whisper secrets, it's a place of interest, often a playground for significant actions. Just as Fibonacci numbers spiral through nature, they spiral through these markets, guiding us.
But there's more to the story. Imagine the On-Balance Volume (OBV), a silent observer of market movements. Divergence, like a symphony of intrigue, plays its tune. It’s as if the market is telling us a story, a narrative of potential. It's this divergence that piques our interest, suggesting that hidden possibilities might be unfolding.
And then there's volume, the voice of the market, its fluctuations as significant as a conductor's baton. For this swing to work its magic, the crescendo of volume needs to accompany the upward movement. It's the signal that turns a solitary move into a symphony of momentum.
This tale, my friends, is not just a glimpse into a crystal ball. It's a calculated dance of data, a thoughtful strategy that beckons you to seize the potential while protecting your capital. As we embark on another swing long trade, armed with knowledge and insight, we brace ourselves for the next chapter. The markets shift, the numbers change, but the essence of trading remains.
As Kava extends its invitation, it's time to write the next verse in the saga of potential gains. Gather your wits, adjust your strategies, and let the journey continue. Set your stop-loss, a safeguard against unforeseen tides, below the 0.7815 mark. It's a strategic move to protect your capital, even amidst the allure of profit.
So let the path be navigated with both caution and courage, for risks are managed, and the potential for gains remains.

KAVA- Are you ready?Dear my friends,
Not much to say about Kava! Breaking is only a matter of time.
Patience and waiting are key.
Best Regard,
KAVAUSDTHello traders
I've updated KAVA chart.
The old chart was in 4H timeframe and this one is daily.
I attach previous chart in bottom of this chart.
After drawing chart I remove INDICATORES I don't analyze without indicators.
KAVAUSDTThe price is in the middle of the long-term channel as well as the bottom of the daily time frame trend. The first target is 15%, the second target is 35%

KAVAUSDTHello. We have a chance to go up with Bitcoin. Yes, this is a small rebound, but the potential is good.

KAVAUSDT - are you ready for the rally?We just went long on KAVA since the price is trading near the 61.8% Fiboinacci support. The risk/reward setup is decent and probability favors the uptrend. Let's get rolling KAVA~!
