Kavausd
KAVAUSDTHello. We have a chance to go up with Bitcoin. Yes, this is a small rebound, but the potential is good.

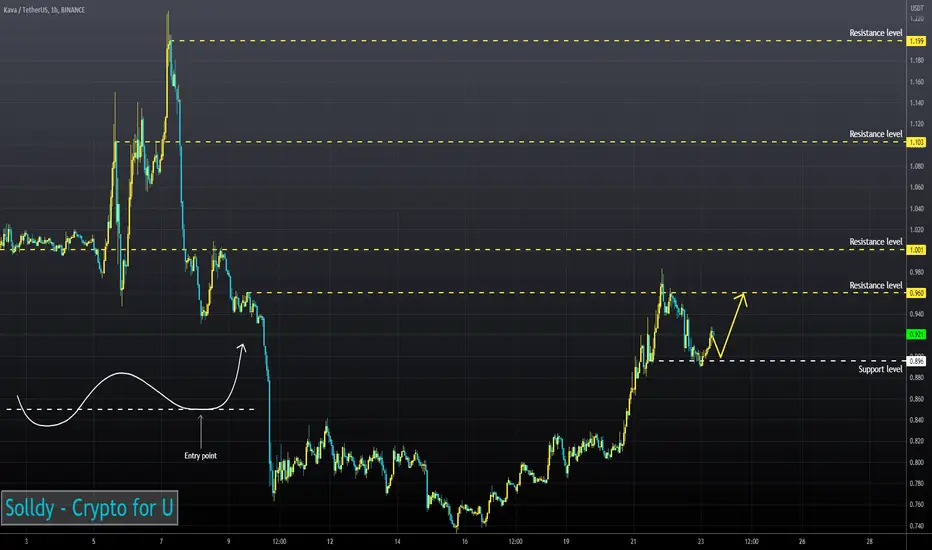
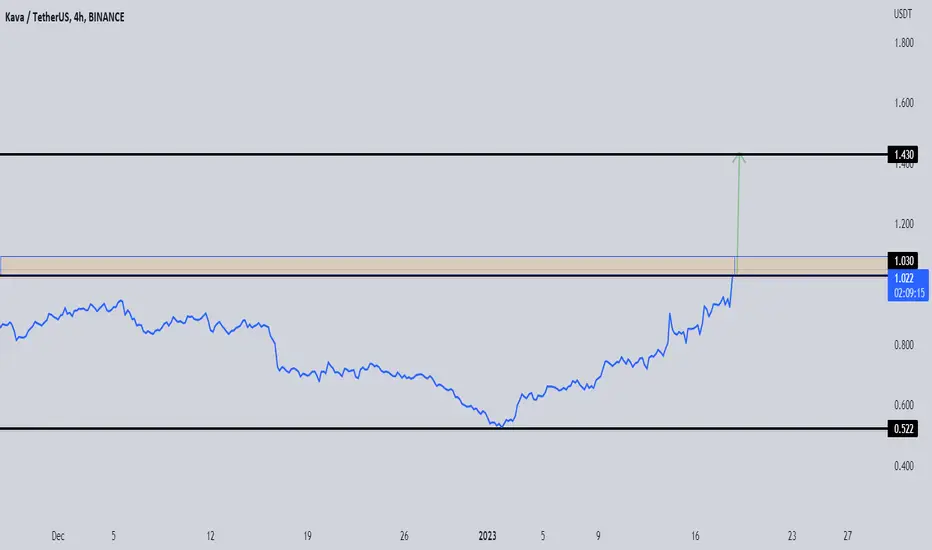
KAVA price where are you going?Today, KAVA will update its network. And almost at the same time, the announcement of the "fresh" US CPI.
If the two news turn out to be positive, this could be a c-c-combo push for the KAVAUSDT price to move up.
The critical level is $1.20. From this level, the price may begin to rise:
rapid growth along the $1.50-2.30 route
and a correction to $0.80
_____________________
Did you like our analysis? Leave a comment, like, and follow to get more

KAVA Road Map🗺️!!!Hi everyone👋( Reading time less than 2 minutes⏰ ).
If you want to invest in Kava(KAVA) , I suggest you read this post.
🌐 What Is Kava (KAVA) ❗️❓
Kava is a Layer-1 blockchain that combines the speed and interoperability of Cosmos with the developer power of Ethereum.
Kava was built from the ground up to optimize its resources for protocol growth, strengthened by its Cosmos EVM technology that enables maximum scalability, speed, security, and developer support.
Builders on Kava earn a share of Kava Rise's $750M developer incentive fund via the program's blockchain-based distribution method, designed to reward the top protocols every month based on usage.
-----------------------------------------------------------------------------------
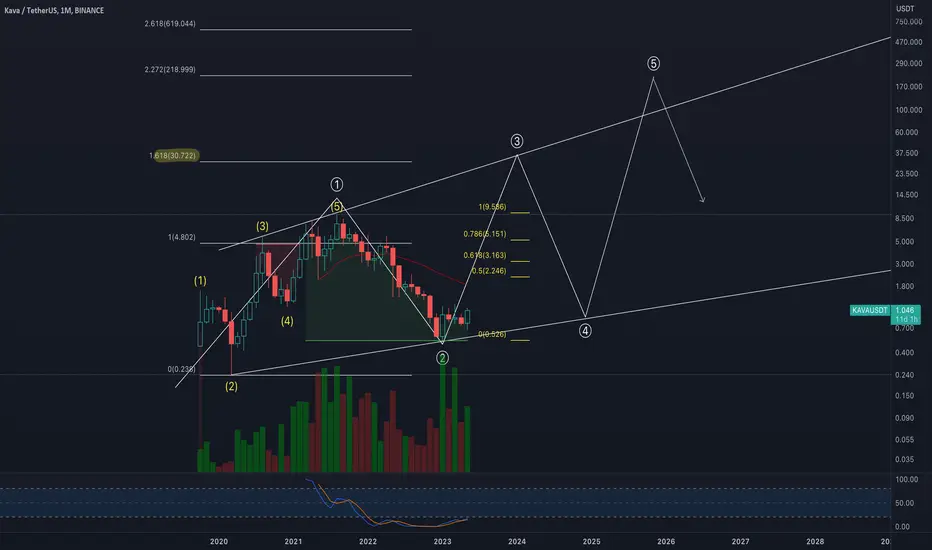
Kava started to fall after completing the Diagonal pattern and breaking the lower line of this pattern.
The structure of Kava fall waves is in the form of five impulse waves .
Kava now seems to have completed the main wave 4 on the downtrend line .
🔔I expect the main wave 5 to end in the 🟡 Price Reversal Zone($0.525-$0.359) 🟡 and it will be a suitable area for mid-term investment.
Kava Analyze ( KAVAUSDT ), Weekly time frame ⏰.
Do not forget to put Stop loss for your positions (For every position you want to open).
Please follow your strategy, this is just my Idea, and I will be glad to see your ideas in this post.
Please do not forget the ✅' like '✅ button 🙏😊 & Share it with your friends; thanks, and Trade safe.

KAVA IS BEARISHHi, dear traders. how are you ? Today we have a viewpoint to SELL/SHORT the KAVA symbol.
For risk management, please don't forget stop loss and capital management
When we reach the first target, save some profit and then change the stop to entry
Comment if you have any questions
Thank You

Kava. io forming a bullish BAT for upto 34.50% pumpHi dear friends, hope you are well and welcome to the new trade setup of Kava. io (KAVA) token with US Dollar pair.
Our last trade for KAVA was as below:
Now on a 4-hour time frame, KAVA is about to complete a bullish BAT move for another price reversal.
Note: Above idea is for educational purpose only. It is advised to diversify and strictly follow the stop loss, and don't get stuck with trade.

KAVAUSD ❕ volumes declinedTrading volumes declined on the correction.
The price broke through 50EMA at 30m TF.
The RSI chart is moving in a bullish zone (4H, 1H and 30m TFs)
I believe the asset can bounce if it holds the current support level.
2 bullish targets for kava in the short to medium termA bull flag and also an inverse Bart from a bear flag. Price action may find resistance temporarily at the 200 ma(in blue), but if so watch for the 50 ma (in orange) to maintain support to increase probability that price will overcome the 200ma and continue towards the breakout targets. *not financial advice*

KAVA LONG OPPORTUNITY 20230519KAVA is trying to break the bottom structure, if it does, a 2.5 risk/reward opportunity may appear.
DISCLAIMER
This is only a personal opinion and does NOT serve as investing NOR trading advice.
Please make your own decisions and be responsible for your own investing and trading Activities.

Analyzing Short Opportunities in KAVAGreetings, Traders,
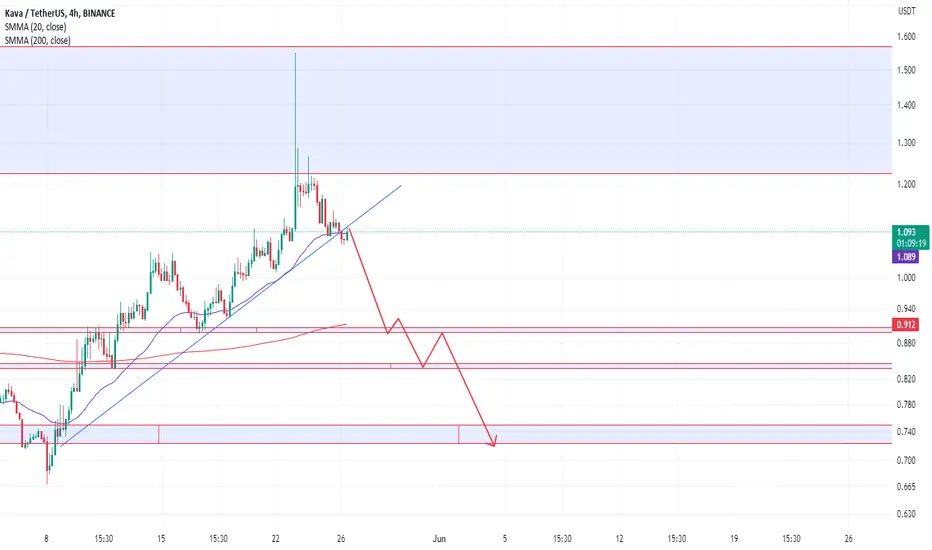
Today, I present an in-depth analysis of KAVA, a prominent asset within the decentralized finance (DeFi) platform. This platform offers loans to its users without intermediaries and has thus become a notable entity within the cryptocurrency market. Currently, KAVA's price stands at 1.089.
Technical Analysis
On closer inspection of KAVA's current state, numerous technical indicators suggest that it might be an appropriate time to consider short positions. Here is a detailed dissection of the relevant technical factors:
RSI & Stochastic Oscillators: The Relative Strength Index (RSI) currently stands at 69, nearing the traditional overbought threshold of 70. In parallel, the stochastic oscillator is high at 92. These are both significant signals of potentially overbought conditions, frequently leading to a market correction.
Bollinger Bands: The asset's current price is nearing the upper Bollinger Band, placed at 1.116. This closeness often signifies overvaluation and potential reversion to the mean, providing a price correction signal.
Volume Oscillator: The volume oscillator value is -4%, indicating a higher downward volume compared to the upward volume. This pattern can be perceived as a bearish sign in certain market conditions.
MACD: The Moving Average Convergence Divergence (MACD) value currently stands at 0.057. While it's not distinctly bearish, it necessitates close monitoring for a potential bearish crossover.
Fibonacci Levels: The Fibonacci retracement levels also merit attention. On the daily timeframe, the 0.5 level stands at 0.859 and the 1 level at 0.667. These levels could potentially act as support in the event of a price decline.
Key Resistance Levels
It's crucial to highlight KAVA's significant resistance levels. The asset has a local resistance level of 1.171 and a substantial resistance level of 1.347. These resistance points may act as a price ceiling and provide excellent opportunities for short positions. The convergence of the overbought indicators and these resistance levels present the potential for short positions with a favorable risk/reward ratio.
Conclusion
Considering these indicators, both the local resistance of 1.171 and the solid resistance of 1.347 seem to be probable regions for initiating short positions. However, it's important to note that trading requires meticulous planning and risk management. It is essential to conduct independent research and consider personal risk tolerance before entering any trades.
I will continue monitoring KAVA and provide updates on significant changes in its market behavior. Until then, let's maintain a diligent watch on this asset and observe how the market scenario unfolds.
Wishing you successful trading.

KAVAI have kava bottomed in an expanding diagonal wave 2 back in Oct 2022. Now we slow gind into W3 around $30
KAVA ANALYSIS (1D)Many questions are asked about the KAVA movement process.
The chart is not a single scenario and there are many scenarios for price movement.
I marked the least dangerous scenario on the photo.
If the price reaches the green zone, you can enter a long/long position
In the upper parts of the green box, you can enter the position if you receive confirmation to enter the position, and I have only specified the low-risk scenario.
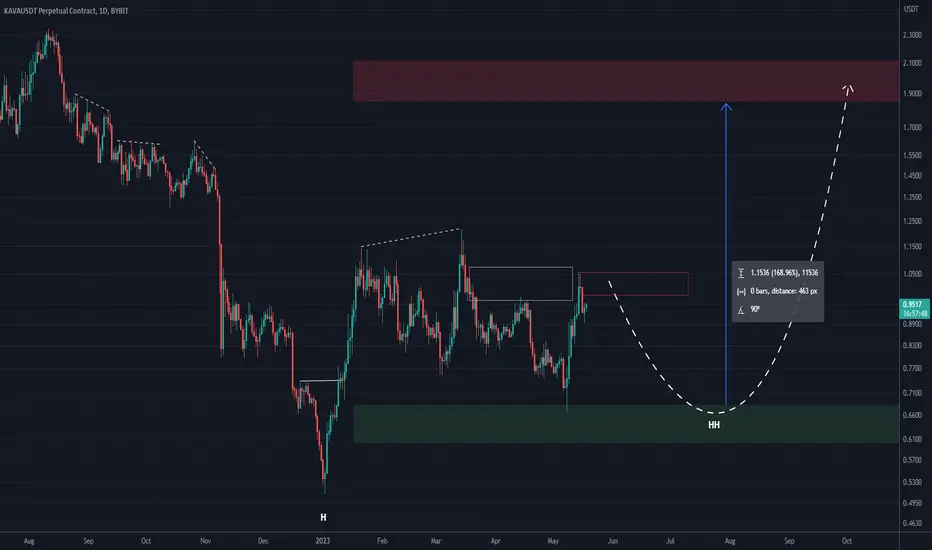
Kava another move is loading Kavausdt
Kavausdt breakout already confirmed wait is for retest incase if successful retest expecting 30-50% bullish move
Dyor

kava short setup Hello Traders, here is the full analysis for this pair, let me know in the comment section below if you have any questions, the entry will be taken only if all rules of the strategies will be satisfied. I suggest you keep this pair on your watchlist and see if the rules of your strategy are satisfied. Please also refer to the Important Risk Notice linked below.

KAVAUSD Pivot trade on the 1day MA200 closingKava/ KAVAUSD is trading inside a Channel Down on the 1D timeframe.
Today it is testing the 1day MA200 for the first time in 6 weeks.
If it closes a candle over it, buy and target 1.09000 (58.70% rise).
If it closes under it, sell and target 0.69000 (Support A).
Follow us, like the idea and leave a comment below!!

KAVA can drop soonHi, dear traders. how are you ? Today we have a viewpoint to SELL/SHORT the KAVA symbol.
For risk management, please don't forget stop loss and capital management
When we reach the first target, save some profit and then change the stop to entry
Comment if you have any questions
Thank You

KAVA is still Bullish, BUT...KAVA is still bullish but the asset is already overheated. Keep an eye on the indicator and SELL/SHORT once you enter the red zone!

KAVA : LONG VIEWThe market overview its in the breakdown.
Kava still shows a volume view for an uptrend.
The only + volume at this moment.
Kava. io formed bullish BAT for upto 17.50% moveHi dear friends, hope you are well and welcome to the new trade setup of Kava. io (KAVA) token with US Dollar pair.
Previously we caught a nice trade of KAVA as below:
Now on a 2-hr time frame, KAVA has formed a bullish BAT move for another price reversal.
Note: Above idea is for educational purpose only. It is advised to diversify and strictly follow the stop loss, and don't get stuck with trade

#KAVA, Is it ahead of the curve or wrong?#KAVA
Is it ahead of the curve or wrong?
UCTS 2D Buy in place already
⏳🧘♂️

Go KAVA! 1.14 and Beyond!We can see that KAVA broke the white trendline and 50 EMA Daily
This scenario may bting KAVA to 1.14 USD
My analysis will be invalid if KAVA dumps to below 0.737 USD

KAVA confirm bullishKAVAUSD reach to the base line according to price action principle and the reverse head and shoulder already formed the price is completely bullish in my opinion maybe you will see the price above 2 rupees

KAVA LOOKS BULLISHHi, dear traders. how are you ? Today we have a viewpoint to BUY/LONG the KAVA symbol.
For risk management, please don't forget stop loss and capital management
When we reach the first target, save some profit and then change the stop to entry
Comment if you have any questions
Thank You
