KAVAUSDT |Wyckoff Accumulation| It seems?Hello everyone, I wrote a new idea for you. I think it's easy to like and subscribe to the channel, thanks😉
📌Friends found an interesting coin KAVAUSDT and read about Wyckoff accumulation just yesterday. I think the schedule is about the same.
📌Now to understand whether the removal or accumulation is not finished yet?
Write your comments about this👇
KAVAUSDT

KAVAUSDT Ready to take off!KAVAUSDT Technical analysis update
KAVAUSDT formed symmetric triangle in 4h chart, expecting good up move in KAVA after triangle pattern breakout.
Buy zone: $1.94 - $1.97
Stop loss : $1.82
TP 1 : $2.07
TP 2 : $2.20
TP 3 : $2.35
TP 4: $2.55
Always keep stop
Thanks
Hexa

AMD on $KAVAlovely amd i saw today on kava. i was able to notice it early and long at a perfect entry.


KAVAUSDT Analysis (LOCAL VISION)Hello friends.
Please support my work by clicking the LIKE button👍(If you liked). Also i will appreciate for ur activity. Thank you!
Everything on the chart.
Entry: market and lower
Target: 2.2 and 2.4
after first target reached move ur stop to breakeven
Stop: ~1.6 (depending of ur risk). ALWAYS follow ur RM .
Risk/Reward: 1 to 3
risk is justified
Good luck everyone!
Follow me on TRADINGView, if you don't want to miss my next analysis or signals.
It's not financial advice.
Dont Forget, always make your own research before to trade my ideas!
Open to any questions and suggestions.

KAVAUSD H4: +100% gains BULLS THE BEST level TO BUY/HOLD(SL/TP)(Why get subbed to me on Tradingview?
-TOP author on TradingView
-2000+ ideas published
-15+ years experience in markets
-Professional chart break downs
-Supply/Demand Zones
-TD9 counts / combo review
-Key S/R levels
-No junk on my charts
-Frequent updates
-Covering FX/crypto/US stocks
-before/after analysis
-24/7 uptime so constant updates
🎁Please hit the like button and
🎁Leave a comment to support our team!
KAVAUSD H4: +100% gains BULLS THE BEST level TO BUY/HOLD(SL/TP)(NEW)
IMPORTANT NOTE: speculative setup. do your own
due dill. use STOP LOSS. don't overleverage.
READ ENTIRE IDEA BEFORE EXECUTION!
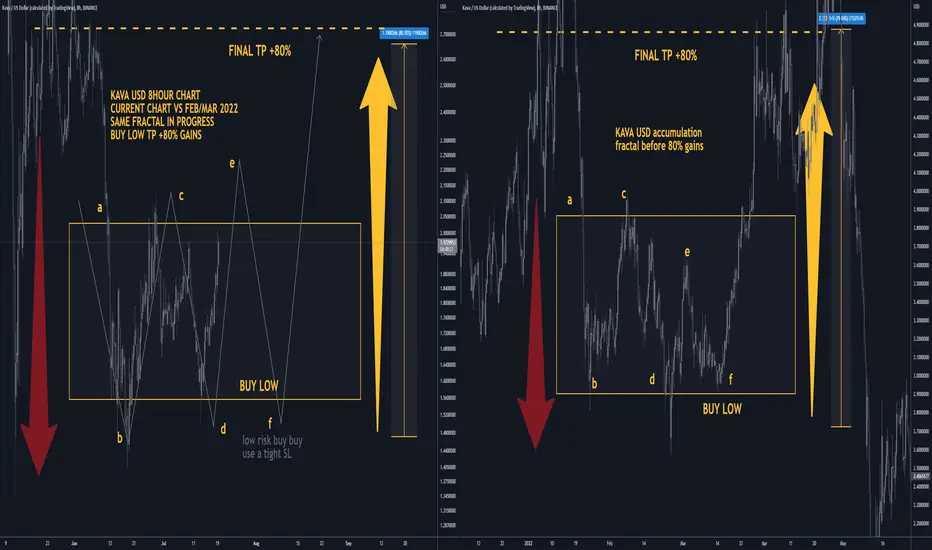
🔸 Summary and potential trade setup
::: KAVAUSD H4/candle chart review
::: corrective cycle in progress no
::: repeat a/b/c/d/e/F fractal from past
::: same structure FEB repeatS soon
::: setup still valid as of RIGHT NOW
::: chart is LOG SCALE
::: get ready to BUY LOW later
::: currently/soon CORRECTION MODE
::: BUY LOW after 30% correction
::: entry - end of this month
::: for now PULLBACK/CORRECTION MODE
::: on the right same a/b/c/d/e/f fractal
::: FEB/MARCH 2022 repeat fractal
::: resulted in 100% gains off the lows
::: re-test of range lows is likely
::: point f is BEAR TRAP (fake breakdown)
::: SPECULATIVE SETUP
::: do your own due dill
::: and use proper risk management
::: TP bulls is +100% gains
::: details: see chart
::: FINAL TP is +100% gains
::: recommended strategy: BUY/HOLD after correction
::: TP BULLS +100% gains
::: SWING TRADE: BUY/HOLD IT
::: bull run not over yet
::: good luck traders!
::: BUY/HOLD and get paid. period.
🔸 Supply/Demand Zones
::: N/A
::: N/A
🔸 Other noteworthy technicals/fundies
::: TD9 /Combo update: N/A
::: Sentiment mid-term: BULLS/100% gains
::: Sentiment short-term: CORRECTION/MODE
RISK DISCLAIMER:
Trading Crypto, Futures , Forex, CFDs and Stocks involves a risk of loss.
Please consider carefully if such trading is appropriate for you.
Past performance is not indicative of future results.
Always limit your leverage and use tight stop loss.
KAVA - Only one way this can goReasons to take short:
⭐️ BTC bearish
⭐️ Trendline is 19 days long
⭐️ Trendline is clean
⭐️ Pulbacks are getting weaker
⭐️ Slowly squeezing
⭐️ There has been false breakup
⭐️ 5th touch
⭐️ 40 ATR
⭐️ Under VWAP
Will enter when price squeezes to the trendline on 5m timeframe, the base will form and the tape will get faster.
If you don't understand the previous sentence, just use swing stop-loss 3-5%
Fix profit by parts:
1% - 1/3
2% - 1/3, stoploss to breakeven
What's left, hold to the maximum
What do you think of this idea? What is your opinion? Share it in the comments📄🖌
If you like the idea, please give it a like. This is the best "Thank you!" for the author 😊
P.S. Always do your own analysis before a trade. Put a stop loss. Fix profit in parts. Withdraw profits in fiat and reward yourself and your loved ones

KAVA giving off good vibes.KAVA is giving off some very good vibes in the way that it was bounced off this retest of this break out on the lower time frame here.
Looking for price to travel towards the 2.00 mark. Would be taking profit here, and then waiting for consolidation for any re-entry. (Or you might want to use any swing highs on lower time frame as re-entry/good places to wait for a long, if we do hit that overhead resistance).

BITCOIN 2H TA : New Update Support ZoneAccording to the previous analysis, with the fall of Bitcoin to the support range and the return of the price, it was unable to break the $21,000 range and it is correcting to the support range that I specified in the chart. I have shown possible scenarios if this support range is maintained. But with the failure of this range, the analysis will be updated.
Its not Buy or Sell SIGNAL
DYOR
BY : Mohamad Teriz - @AtonicShark

KAVA KAVA/USDT forming Rising Wedge Pattern on 1h Timeframe now broke Support Zone and waiting for 1.530$

KAVAUSD D2: 255% gains THE BEST LEVEL TO BUY/HOLD(SL/TP)(NEW)Why get subbed to me on Tradingview?
-TOP author on TradingView
-2000+ ideas published
-15+ years experience in markets
-Professional chart break downs
-Supply/Demand Zones
-TD9 counts / combo review
-Key S/R levels
-No junk on my charts
-Frequent updates
-Covering FX/crypto/US stocks
-before/after analysis
-24/7 uptime so constant updates
🎁Please hit the like button and
🎁Leave a comment to support our team!
KAVAUSD D2: 255% gains THE BEST LEVEL TO BUY/HOLD(SL/TP)(NEW)
IMPORTANT NOTE: speculative setup. do your own
due dill. use STOP LOSS. don't overleverage.
🔸 Summary and potential trade setup
::: KAVAUSD D2/candle chart review
::: HIGHER RISK SETUP USE TIGHT STOP LOSS
::: further losses short-term
::: expect BEARS to target 1.20-1.40 USD
::: however strong bounce after correction
::: setup still valid as of today
::: chart is LOG SCALE
::: get ready to BUY LOW later near 1.20-1.40 USD
::: BUY LOW near 1.20-1.40 USDusing tight SL
::: currently correction in progress / no upside
::: dump until July/August 2022
::: for now stay out / wait for better entry price
::: up to 255% gains possible later
::: short-term pullback/correction
::: is possible / likely
::: however chart looks good for BOUNCE
::: SPECULATIVE SETUP
::: do your own due dill
::: and use proper risk management
::: TP bulls is +255% gains
::: details: see chart
::: FINAL TP is +255%
::: recommended strategy: BUY/HOLD 1.20-1.40 USD
::: TP BULLS +255% gains / 4.40 USD final TP
::: SWING TRADE: BUY/HOLD IT
::: bull run not over yet
::: good luck traders!
::: BUY/HOLD and get paid. period.
🔸 Supply/Demand Zones
::: N/A
::: N/A
🔸 Other noteworthy technicals/fundies
::: TD9 /Combo update: N/A
::: Sentiment mid-term: BULLS/STRONG BOUNCE
::: Sentiment short-term: CORRECTION/1.40USD
RISK DISCLAIMER:
Trading Crypto, Futures , Forex, CFDs and Stocks involves a risk of loss.
Please consider carefully if such trading is appropriate for you.
Past performance is not indicative of future results.
Always limit your leverage and use tight stop loss.

KAVAUSDTPERPThe price has lost its upward momentum by reaching the resistance zone, and in case of confirmation, it is suitable for entering the short trading.

#Kava🔴Short
❇️Entry : 1.760~1.751
Max lev 3~5x
Targets : 1.728 / 1.698 / 1.669
🛑Don't risk more than 3% of capital.


KAVA in reaccumulation$KAVA 4h chart , things we can see:
- Asymetrical V shave recovery that lead to an ascending channel (can be considered as accumulation)
- RSI + MACD neutral
- Waves slightly positive
- Fib trace shows us the possible Liquidity check area before springing upwards
- $2.90 is the upper limit inside the range. Need to close 4h above that level in order to think that we will leave the range bullish
Bias: Neutral/Slightly bullish

BELUSDT 1D TA : Pump again?According to the chart, after breaking the line, the trend is pumped and is pullback now. If the pullback is completed and the resistance range is broken, it can grow again, otherwise we will have correction.
Its not Buy or Sell SIGNAL
DYOR
BY : Mohamad Teriz - @AtonicShark


CARDANO VS TrendLineIn the daily time frame, the downtrend line has been successfully broken upwards and we expect growth up to the resistance limits specified in the chart. If the trend line is broken down again, the downtrend will continue.
Its not Buy or Sell SIGNAL
DYOR
BY : Mohamad Teriz - @AtonicShark

KAVA - Daily trendline breakdown is one of my favoritesReasons to take short
⭐️ BTC looks bearish
⭐️ Updating historical lows
⭐️ 5th touch
⭐️ Volume at top
⭐️ Level is visible on daily timeframe
⭐️ Level is 22 days old
⭐️ 40 ATR
Will enter when price squeezes to the leverl on 5m timeframe, the base will form and the strip will get faster.
If you don't understand the previous sentence, just use swing stop-loss 3-5%
Fix profit by parts:
1% - 1/3
2% - 1/3, stoploss to breakeven
What's left, hold to the maximum
What do you think of this idea? What is your opinion? Share it in the comments📄🖌
If you like the idea, please give it a like. This is the best "Thank you!" for the author 😊
P.S. Always do your own analysis before a trade. Put a stop loss. Fix profit in parts. Withdraw profits in fiat and reward yourself and your loved ones

KAVA Full of news 👍👍👍👍There is a lot of news about this currency code these days. On the other hand, the bitcoin decline process is coming to an end and this currency code can give good profits to its shareholders.
Your constant friend Manouchehr Azar from Iran

KAVAUSDT - SETUPKAVAUSDT price moved aggresively in previous hour as Bulls trying to break the falling trendline. But there is a resistance ahead, if aggressive volume come at resistance we could see an upward surge up to next resistance level. Keep Accumulating

Kava - Nice short opportunityReasons to take short
⭐️ BTC is bearish
⭐️ Trend bearish
⭐️ Level is 7d old
⭐️ Level is visible on multiple timeframes
⭐️ In the end of formation
⭐️ Slowly squeezing to the level
⭐️ Volume at top
⭐️ 4th touch
⭐️ Under VWAP
Will enter when price squeezes to the level on lower timeframes, the base will form and the strip will get faster.
If you don't understand the previous sentence, just use swing stop-loss 3-5%
Fix profit by parts:
1% - 1/3
2% - 1/3, stoploss to breakeven
What's left, hold to the maximum
What do you think of this idea? What is your opinion? Share it in the comments📄🖌
If you like the idea, please give it a like. This is the best "Thank you!" for the author 😊
P.S. Always do your own analysis before a trade. Put a stop loss. Fix profit in parts. Withdraw profits in fiat and reward yourself and your loved ones

#kava kavausd in 1h time framethis chart is for 1hour kava price and we can see that the price is consolidated near the support zone and it is under pressure of a dynamic resistance trend line.
if the bars can break the trend line and the correction leg (simulated bars) retest the support zone, we can set a long position !#kava
#kavausd
time frame : 1h
Ep: 9.80
Sl ~ 9.41
Tp ~ 11.50
