KAVAUSDT

KAVA is slowly breaking outI'm not sure how if this can go up too much, after all the last two 4h candles and last 3 daily candles had a lowering volume, however that's a breakout. This might stop right here or touch the resistance up there.
My thought is that it's stopping right here and is about to retrace.
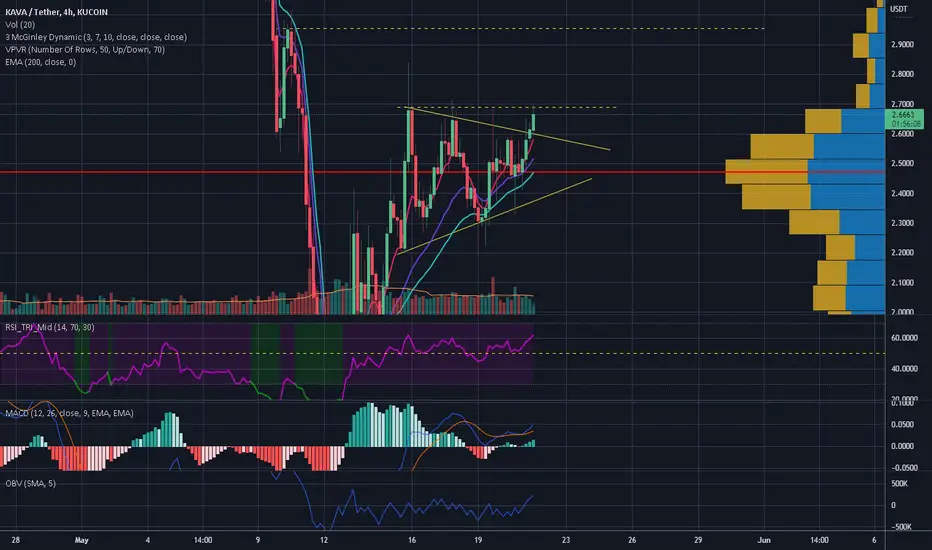
KAVA/USDT BUYING SETUPKAVA look's like make a ascending triangle we can setup entry after breakout or when retest to resistance become support , big buy volume on resistance at the time EMA 20 golden cross with EMA 50 so potential breakout
MACD showing bullish crossover
Buy zone : 2.65 - 2.5
Target : 2.786 - 2.966 - 3.282 - 3.503
Stop : 2.4

KAVA Events along the Trendline KAVAUSD experiences same parallel downtrends with curiously similar bottom pattern followed by a sharp low on the trend line
This is happening currently, the only difference being a lower low being created instead of a higher low in the prior two situations
In the prior two situations price rose in both situations following these structural patterns

KAVAUSDTHello Crypto Lovers,
Mars Signals team wishes you high profits.
This is a one-day-time frame analysis for KAVAUSDT
The price has entered a descending channel and at the moment, it is fluctuating below the first resistance line. Here we must wait for a confirmation candle by which the price is able to move over the first resistance line. Then we will consider a long position for it. But if there is a weakness in the price trend and it cannot move above the first resistance line, we should have a short signal for the support line.
Warning: This is just a suggestion and we do not guarantee profits. We advise you analyze the chart before opening any position.
Wish you luck


KAVAUSDT Analysis (LOCAL VISION)Hello friends.
Please support my work by clicking the LIKE button👍(If you liked). Also i will appreciate for ur activity. Thank you!
Everything on the chart.
Entry: market and lower
Target: 4.9 and 5.9
after first target reached move ur stop to breakeven
Stop: ~2.9 (depending of ur risk). ALWAYS follow ur RM .
Risk/Reward: 1 to 3.5
risk is justified
Good luck everyone!
Follow me on TRADINGView, if you don't want to miss my next analysis or signals.
It's not financial advice.
Dont Forget, always make your own research before to trade my ideas!
Open to any questions and suggestions.

KAVAUSDT can go lower after the pullback
KAVAUSDT can go lower after the pullback. We can see a lot of selling pressure from the sellers after the breakout however we might have a pullback to retest the channel before it continues to go lower. Some traders prefer to wait for the pullback to enter the trade.
💎 KAVAUSDT
🔵 Entry zone 5.059 - 4.688
🟢 TP1 4.310
🟢 TP2 3.660
🟢 TP3 2.770
🔴 SL 5.550
Good Luck 🎲


KAVA Price Targets and Stop LossKAVA/USDT
Entry Range: $5.10 - 5.40
Take Profit 1: $5.80
Take Profit 2: $6.50
Take Profit 3: $7.02
Stop Loss: $4.70

Kavausdt syarting a good trend moveKava is gonna get its confirmation here for trend break and will go to top of bigger uptrend channel.
Entry is around 5.22 tp is 5.85 and sl is 5.19... nta 🚀🚀

KAVA test strong resistance KAVA / USDT
KAVA was one of few greens during red market in last days
Right now it’s testing very strong resistance :
–A Close above resistance will open all the way up to 7$ and 9$
–If strong rejection here, i see 3$ again
Lets see what MM will decide before opening a trade
Best of wishes

KAVAUSDT - Daily chartThe price has reached a strong support area based on two Fibonacci.
Susceptible to negative divergence.
You also express your opinion in the comment.
Thanks a lot.

KAVA, short-term long/buy strategyKAVA, 4h level operation:
Direction: Buy & Go Long
Good entry price: under 5.18
Stop loss price: below 0.057
Take Profit Price: 5.82

KAVA / USDTJust wait for the confirmation to make it short or long
we are facing the resistance as I draw you on the chart
Keep eye on the chart and Check BTC movement at the same time
This is not financial advice
USE STOP LOSS

#KAVA Ready for ATH ?In Daily TF, Kava is inside the rising channel.
Bulls success to break the falling Trendline.
Expecting massive pump in the coming weeks.
Send IT!

KAVAUSDT - SETUPKAVAUSDT price is breaking up with a strong volume and momentum. Bulls will make sure to close above if any upside move is on the cards. So wait for the upcoming and trade accordingly.

kavausdt 1d daily resistane trend line is broken now we see HH and going up if you take a long positoin do make sure to put your stoploss trand carefully

Gnarly Long KAVAA pretty gnarly trade suggestion and not the cleanest with stop-loss placement.
We are above the cloud on the 1 hour and also higher time frames like the 12 hour. (along with the lagging strand). Almost looking for a continuation of the prevailing up trend.
In terms of stop-limit placement, it might be a bit of grin and bare it. Only smaller positions. The gains could be as equally big as the losses though.
A sensible trailing stop-limit could be the Parabolic SAR on the 1hour.

$KAVA Longggcurrently the strongest holding coin.
Pump is highly expected. Making a strong bull flag
Cheers,
nav


KAVAUSDT 6H TA: PRZ zone As we can see in the chart, the price jumped upwards when it hit the prz area, and we expect to correct the $ 5.5 area when it hits. So it is suggested to save profit. And re-enter if the $ 5.5 range is broken above. We expect a drop to $ 4.2 if corrected.
Its not Buy or Sell SIGNAL
DYOR
BY : Mohamad Teriz - @AtonicShark

Here is My Idea On Kava/BTCHere is My Idea on Kava. Dont Forget Stoploss. Because Bitcoin is Still not Stable
I am Not A Financial Adviser. And This Is not A Financial Advice. And All Cherts Are Just My Study. So Please Do Your Own Search before open Any Trade.
Aprox. All Crypto Currencies are Correlated to BTC . So If There is a Big Dump in BTC . All alt coin go down with it. Without Respecting any Technical Analysis
If You Like My Work Just Come and Join Me.
KAVA
