descending triangle detectedjust wait for conform break out and then loot it.
personally waiting for its breakout.
and also you can follow us for safe and sound analysis.
KAVAUSDT

KAVAUSDT AnalysisHello friends.
Please support my work by clicking the LIKE button(If you liked).Thank you!
Everything on the chart.
open pos: market and lower
target: 8-9-10
after first target reached move ur stop to breakeven
stop: ~5 (depending of ur risk). ALWAYS follow ur RM .
risk/reward 1 to 4
risk is justified
Good luck everyone!
Follow me on TRADINGView, if you don't want to miss my next analysis or signals.
It's not financial advice.
Dont Forget, always make your own research before to trade my ideas!
Will be very APPRECIATE FOR UR DONAT/coins :)
Open to your questions or suggestions(Looking for investors!).

KAVA - does the fall continue 😲❓Finally, bitcoin has been corrected. All altcoins have been corrected along with it. Nothing has changed globally, bitcoin is still moving in an uptrend.
And corrections are a normal thing.
KAVA is now testing the trend line, which acts as a support for now.
But at the same time, no buyer strength is visible. Additionally, it is worth noting that the price is starting to squeeze, which is a bad signal. In case of a breakdown, there could be a fall to the targets marked below.
Write in the comments all your questions and instruments analysis of which you want to see.
Friends, push the like button, write a comment, and share with your mates - that would be the best THANK YOU.
P.S. I personally will open entry if the price will show it according to my strategy.
Always make your analysis before a trade.

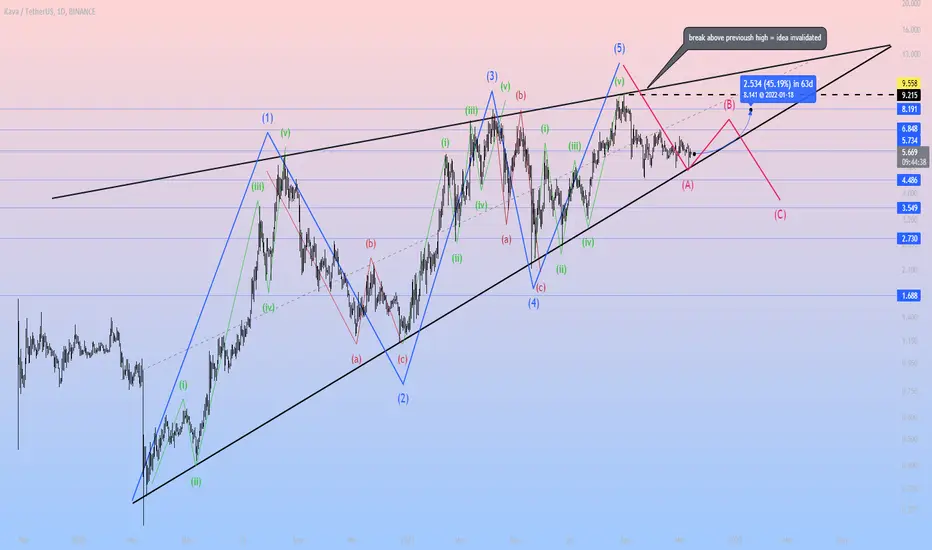
☕KAVA- Rising wedge, B-wave pump now?Today I had a look at KAVA and spotted an obvious rising wedge pattern. The price action fits very nicely into elliot wave cycle scheme, which suggests that the ATH created in August 2021 was the end of wave (5), after which the price entered phase A of corrective ABC scheme. After quick bounce from the dynamic support on Nov 11th the price is now trading in the bottom area of the formation consolidating on horizontal support (5.73). If buyers manage to defend this level, we can expect more upward pressure very soon. Although this idea is more bearish for the next few months, there's still an opportunity to benefit from a potential short-term bounce.
The targets for this bounce are: 6.84 and 8.19.
Feel free to share your thoughts in the comments.
-----------------
About KAVA:
Kava is a cross-chain DeFi lending platform that allows users to borrow USDX stablecoins and deposit a variety of cryptocurrencies to begin earning a yield.
The Kava DeFi hub operates like a decentralized bank for digital assets, allowing users to access a range of decentralized financial services, including its native USD-pegged stablecoin USDX, as well as synthetics and derivatives. Through Kava, users are able to borrow USDX tokens by depositing collateral, effectively leveraging their exposure to crypto assets.
Built on the Cosmos blockchain, Kava makes use of a collateralized debt position (CDP) system to ensure stablecoin loans are always sufficiently collateralized. If a borrower fails to maintain their collateral above a required threshold, the Kava liquidator module will seize collateral from failing CDPs and send it to the auction module for sale.
Source: coinmarketcap
KAVAUSDTBased on the current bull run
I can see this breaking out to the upside
Once it breaks out looking at least 15%
I already have this apart of my portfolio but got in 6.50
So looking to bring my average down slightly but crypto is a long investment play for me

Kava repeating its very interesting harmonic patternLook at the chart, history not always repeat but it does rhyme.
I am bullish on this move, although if this long term setup is broken, new support/trends need to be establish. Hence a strict stop loss is recommended
Good for a leveraged position. Manage your risk
WAGMI 🤝


KAVA/USDT can go amazingly from here.Breakout done and it's looking bullish. You can also stay calm form bigger gain.


$KAVA ready to pumpafter this BOS ( break of structure) the KAVA price seems bullish and it's already going up
a huge pump that will make you some bags of profits might come next
take the chance!


#KAVAUSDT #KAVA#kAVAUSDT
#KAVA
@khancryptoschool
@BullsERA
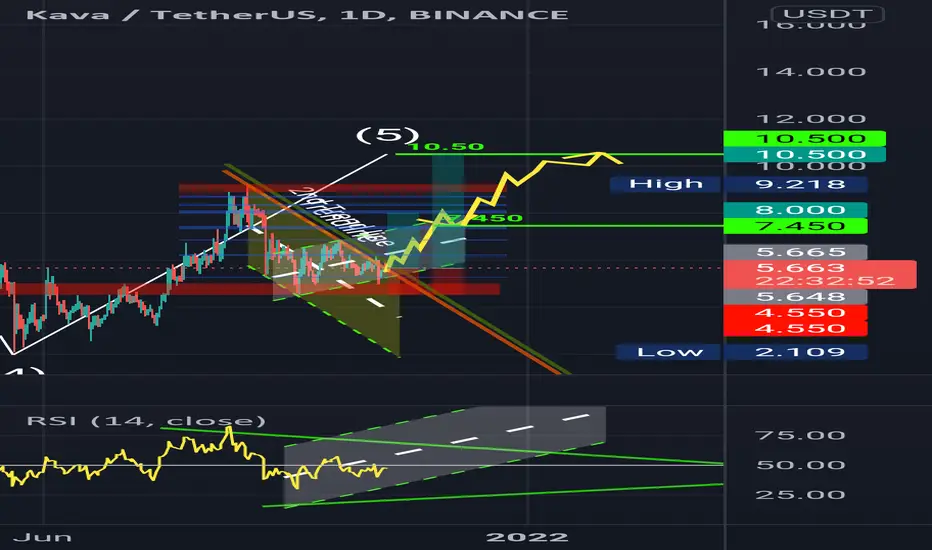
Right Now #KAVAUSDT In ⁵th Wave And Exactly This Wave Will Cross Previous High But There Have Strong Daily Resistance There posible
#KAVAUSDT Take Time And
⁵th Wave Is Big Morthen ³rd Wave
I Recommend 10.50 $ Price And Posible Markeet Hit 11.00 $ Price R Above
Keep in mind.
🟢 Multiple Rejection Structure
🟣 Monthly Frame Structure.
🔴 Weekly Frame Structure.
🔵 Daily Frame Structure.
🟡 4.H Frame Structure.
⚪️ 1.H Frame Structure.
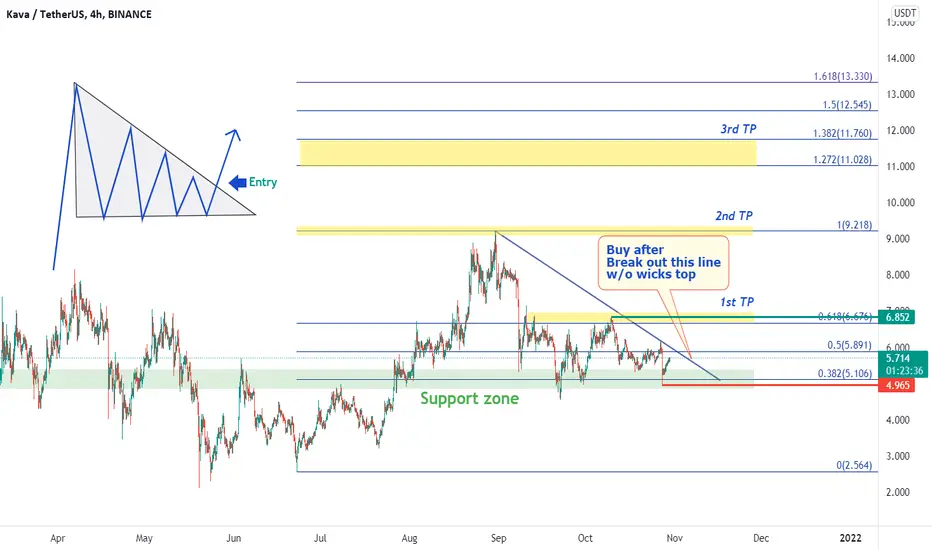
KAVAUSDT - Wait until timing for entryBINANCE:KAVAUSDT
4H trend chart
-
KAVA is consolidating as a triangle since 8/21
This triangle is formed with a downtrend line and support zone.
If price can break out the downtrend line, trading strategy as below.
-
Profit Targets:
a) 6.852----Green horizontal ray
b) 9.218----Fib(1)
c) 11.028~11.760----Fib(1.272~1.382)
Stop losses:
a) 4.9658-----Red horizontal ray
-
If you like this analysis, smash the "like button" and leave a comment below to share your thoughts
or let me know what crypto you want to see!
Trading is a reflection of yourself. Learn more daily and be ready for every opportunity.
Have a nice trading!
kavausdtHello friends.
Please support my work by clicking the LIKE button(If you liked).Thank you!
Everything on the chart.
risk is justified
Good luck everyone
Follow me on TRADINGView, if you don't want to miss my next analysis or signals.
It's not financial advice.
Dont Forget, always make your own research before to trade my ideas!
Will be very APPRECIATE FOR UR DONAT/coins :)
Open to your questions or suggestions(Looking for investors!).

KAVAUSDT Might Create an All-Time HighBINANCE:KAVAUSDT
PPPDirhams.
Disclaimer: This is just my idea. Am not liable for the end results if adapted by anyone. Trade cautiously as there are chances that you will lose your investment..

KAVA DESCENDING TRIANGLEKAVA is just at the end of a DESCENDING TRIANGLE which is normally a CONTINUATION pattern or BEARISH PATTERN.
DAILY TF we are breaking to the upside, but if it does not complete it is a FAKE OUT and we will see a RETRACMENT.
If it completes we have the targets as follows.
ENTRY 5.7-6.0
TARGET 1 $6.5
TARGET 2 $7.1
TARGET 3 $7.5
TARGET 4 $8.2
TARGET 5 $9.50 ATH
STOP LOSS $4.5 SPOT
STOP LOSS $5.4-5.6 3X LEVERAGE
NOT FINANCIAL ADVICE!

KavaThe downtrend on RSI is broking. We should see a broke on price downtrend too
After a breakdown you can BUY/LONG KAVAUSDT$

stay alert on kava !!!in 1H in kavausdt we can see flag pattern and elliot wave in number 5
so if the up trend broken down we can get the short positin by this TP on it.
by moj3 trade assistant

KAVA USDTMy view about KAVA
1. KAVA is moving in bullish trend
2. KAVA have a potential forming IHnS which is right shoulder can be falling wedge
3. MACD have a bullish reguler divergence. which is it can be a potential reversal if MACD can be golden cross.
You can spec buy, and avg up if it breakout from falling wedge. manage your own Money Management
cheers,
-NFA_

kava we can see soon to 10-12$Current trend of kava
I am bullish right now and soon we can see breakout

KAVA/USDT ANALYSIS Important SupportCurrently KAVA/USDT trading at its Important trendline support. 🤞HOPE it Holds the support
CMP - $5.7
If it breaks than we will see our next support at $5.


Strong support at 5Kava formed a "W" shape noble bottom, and breaks through the down trend Line as the Green Zone shows from Oct 2.
Now it seems like KAVA is trying to retrieve back 6 dollar level cause there are pretty small trading volume since the break out.
6 can be a level for opening Long position, it is a minor support here.
If 6 level can hold, it can reach further more to the resistance level 7 and 8.
if 6 level can not hold, it will retest 5 level.
5 dollar is a pretty strong support level
1. we see a lot of trading volume in early Aug green zone area,
2. In the down trend Red Circle area, when the price try to break 5, it pulls back with significant volume
3. when the price break through the trend line there are also big volumes.
These three points make 5 as a strong support, and if the price hit this level again I would buy more, and that might become a triple bottom.
Below 5 is real bearish and will need time re adjust.
Happy Trading
(NOT Financial Advice)
