KAVA consolidation before expansionKAVA in a quite tight range vs BTC for quite some time. Underperformed massively during the previous alt season while the rest of the Binance IEOs did very well. To me this is an interesting DeFi project that could do very well. The chart supports that view as it hasn't had that major pump before that would make me thing it is done + it has been consolidating and showing strength vs BTC when the rest of the coins are weak. If BTC dumps I don't think it will do well in USD terms and could dip vs BTC too, but long term this has high potential.
KAVAUSDT

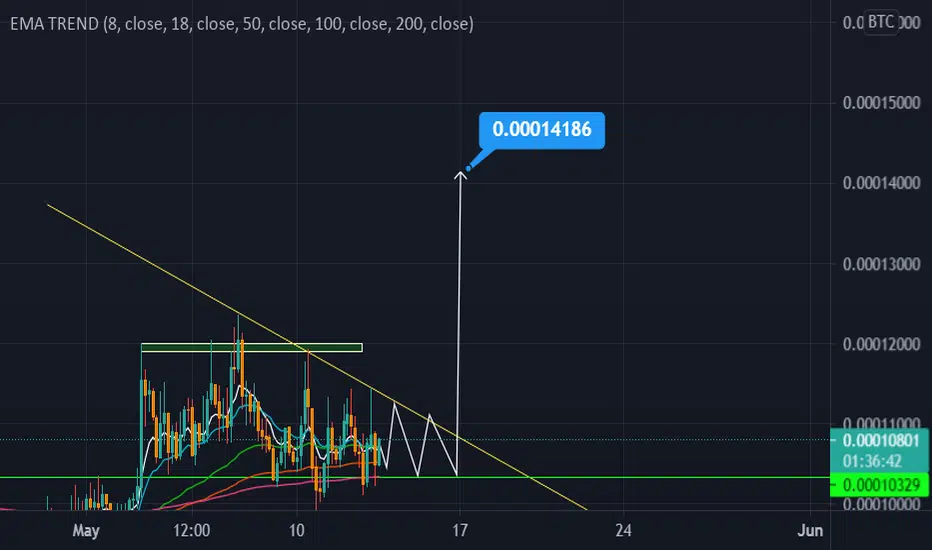
Kava might bounce back stronglyThis is my prediction for the kava movement. Long time increasing channel still holds. If follows the same pattern like before, soon with the support crossing it can bounce back upwards.
Entry level valid only if it does not close a candle under the entry level.
Not financial advice, follow your own ideas. When playing with alts, always keep an eye out for BTC .
Good luck all.


KAVA 1D Strong Buyer Wants Growth?The KAVAUSDT chart looks very interesting.
On the one hand, the cost was drained by -70-75% like most of the altos in the May fall.
On the other hand, the falls were stopped above the strong liquidity zone, and the trading volumes were very high, which may indicate an increased interest in the KAVAUSD pair.
Looking at the graph of the Kavalabs token, two possible scenarios come to mind:
1) Price KAVA growth to $5, further correction, but buyers will no longer allow the price to drop below $4 and continued growth to the $8 area
(This option seems more likely)
2) If somehow the price of KAVAUSDT falls through and consolidates below $3, then the fall may continue further, and the zone of $1.80-2 will meet below
Perhaps the project has a strong fundamental news background? Share your thoughts in the comments!
_____________________
Since 2016, we have been analyzing and trading the cryptocurrency market.
We transform our knowledge, trading moods and experience into ideas. Each "like under the idea" boosts the level of our happiness by 0.05% . If we help you to be calmer and richer - help us to be happier :)

KAVAUSDT H8: 50%/100% gains BEST Level to BUY/HOLD (SL/TP)(NEW)Why get subbed to to me on Tradingview?
-TOP author on TradingView
-15+ years experience in markets
-Professional chart break downs
-Premium content
-not just random lines on the chart
-Supply/Demand Zones
-TD9 counts / combo review
-Key S/R levels
-No junk on my charts
-Frequent updates
-Covering FX/crypto/US stocks
-24/7 uptime so constant updates
KAVAUSDT H8: 50%/100% gains BEST Level to BUY/HOLD (SL/TP)(NEW)
IMPORTANT NOTE: speculative setup. do your own
due dill. use STOP LOSS. don't overleverage.
Tagged as LONG as I expect 50-100% gains!
🔸 Summary and potential trade setup
::: KAVAUSDT H8/candle chart review/outlook
::: measured move structure for 100% gains
::: BULLS BUY low from my level at 2.00 USD
::: expecting more gains short-term before reversal
::: 50-100% gains possible
::: BULLS focus on buying mild dips/pullback
::: expecting reversal off 2.00 USD level
::: the bounce will be good for 50-100% gains
::: target BULLS is mirror S/R level at 4.00USD
::: recommended strategy: BUY DIPS for 50-100% gains
::: TP BULLS +100% gains final TP 4.00 USD
::: BUY/HOLD setup / swing trade
::: for patient traders only / no fast gains here
::: only use low leverage don't do gambling here
::: the sequence for the BULLS
::: Just BUY DIPS and you will get paid, period
::: good luck traders
🔸 Supply/Demand Zones
::: N/A
::: N/A
🔸 Other noteworthy technicals/fundies
::: TD9 /Combo update: N/A
::: Sentiment mid-term: BULLS/SWING/50% GAINS
::: Sentiment outlook short-term: BEARS/pullback
RISK DISCLAIMER:
Trading Crypto, Futures , Forex, CFDs and Stocks involves a risk of loss.
Please consider carefully if such trading is appropriate for you.
Past performance is not indicative of future results.
Always limit your leverage and use tight stop loss.

$KAVAUSDT - Escape plan from the flagHello everyone!
Here is a KAVAUSDT Elliott wave count with a possible escape from the bullish flag.

bloody kava is coming ... Watch out !!
Till now $4.50 seems to be holding well for Kava after testing it.
Most likely we gonna complete the uptrend till the above of the channel.
Look at the channel on the chart, u will get that we r trying to break $5.95 resistance.
An estimated pullback from $5.95 to $2.40 within June. ( about 60% down)
On very short-term we r bullish .
for long-term holding, should add bags in the dip n prepare an exit strategy is a must .
If we moved as expected on the chart, it will be a good indicator to see a rejection bearish daily candle at 5.95 resistance.
The best time to buy, when the wave ends at $1.33.
For me, will sell all my kava at the top of the channel n will short above 5.90.
After we gonna break $4.40 support we will see $2.40 straightway.
DONT LEVERAGE N USE A PROPER RISK MANAGEMENT STRATEGY !!
Please click LIKE button and Appreciate my hard work.
Must follow me for latest crypto real time updates.
Thank you.

KAVAUSDT H8: BEST Level to BUY/HOLD 50%/55% gains(SL/TP)(NEW)Why get subbed to to me on Tradingview?
-TOP author on TradingView
-15+ years experience in markets
-Professional chart break downs
-Premium content
-not just random lines on the chart
-Supply/Demand Zones
-TD9 counts / combo review
-Key S/R levels
-No junk on my charts
-Frequent updates
-Covering FX/crypto/US stocks
-24/7 uptime so constant updates
KAVAUSDT H8: BEST Level to BUY/HOLD 50%/55% gains(SL/TP)(NEW)
IMPORTANT NOTE: speculative setup. do your own
due dill. use STOP LOSS. don't overleverage.
Tagged as LONG as I expect 50-55% gains!
🔸 Summary and potential trade setup
::: KAVAUSDT H8/candle chart review/outlook
::: contained within sliding channel
::: expecting more gains short-term before reversal
::: 50-55% gains possible
::: BULLS focus on buying mild dips/pullback
::: expecting gains next week
::: the bounce will be good for 50-55% gains
::: target BULLS is mirror S/R level at 6.00USD
::: recommended strategy: BUY DIPS for 50-55% gains
::: TP BULLS +50% gains final TP 6.00 USD
::: BUY/HOLD setup / swing trade
::: for patient traders only / no fast gains here
::: only use low leverage don't do gambling here
::: the sequence for the BULLS
::: Just BUY DIPS and you will get paid, period
::: good luck traders
🔸 Supply/Demand Zones
::: N/A
::: N/A
🔸 Other noteworthy technicals/fundies
::: TD9 /Combo update: N/A
::: Sentiment mid-term: BULLS/SWING/50% GAINS
::: Sentiment outlook short-term: BEARS/pullback
RISK DISCLAIMER:
Trading Crypto, Futures , Forex, CFDs and Stocks involves a risk of loss.
Please consider carefully if such trading is appropriate for you.
Past performance is not indicative of future results.
Always limit your leverage and use tight stop loss.

KAVACan Stake Kava for 20% APR in Kraken.
What Is Kava (KAVA)?
Kava is a cross-chain DeFi lending platform that allows users to borrow USDX stablecoins and deposit a variety of cryptocurrencies to begin earning a yield.
The Kava DeFi hub operates like a decentralized bank for digital assets, allowing users to access a range of decentralized financial services, including its native USD-pegged stablecoin USDX, as well as synthetics and derivatives. Through Kava, users are able to borrow USDX tokens by depositing collateral, effectively leveraging their exposure to crypto assets.
Built on the Cosmos blockchain, Kava makes use of a collateralized debt position (CDP) system to ensure stablecoin loans are always sufficiently collateralized. If a borrower fails to maintain their collateral above a required threshold, the Kava liquidator module will seize collateral from failing CDPs and send it to the auction module for sale.
--------------------------------------------------------------------------------
Trading Parts :
- Buy Now around 3.1$
- TP1 : 4.95$ (Security TP)
- TP2 : 5.95$
Stop Loss : 2.48$
--------------------------------------------------------------------------------
Stay S4fe!
Happy Tr4Ding !

KAVAUSD D1: STAGE2 50% DUMP WARNING / correction MODE(NEW)KAVAUSD D1: STAGE2 50% DUMP WARNING / correction MODE(NEW)
IMPORTANT NOTE: speculative setup. do your own
due dill. use STOP LOSS. don't overleverage.
NOT a setup to SHORT KAVAUSD. Just showing
signs of weakness and recommend to stay out
of this market into the CORRECTION MODE.
🔸 Summary and potential trade setup
::: KAVAUSD Daily chart review
::: not a great looking chart
::: price/ RSI div very clear on H8 TF
::: expecting correction/pullback mode
::: previously maxed out and
::: also rejected from MIRROR S/R level
::: STAGE2 DUMP pending soon
::: weak bounce possible from here
::: STAGE2 DUMP up to 50% LOSSES
::: PT BEARS is 2.40-2.50 USD
::: BE CAREFUL and don't get caught in this
::: market not ready for recovery yet
::: correction MODE to extend into JUNE 2021
::: similar setup in other alt coins so be careful
::: also overextended right now
::: BULLS remain on sidelines and
::: good luck traders!
🔸 Supply/Demand Zones
::: N/A
::: N/A
🔸 Other noteworthy technicals/fundies
::: TD9 /Combo update: N/A
::: Sentiment mid-term: BULLS
::: Sentiment short-term: BEARS/CORRECTION MODE
RISK DISCLAIMER:
Trading Crypto, Futures , Forex, CFDs and Stocks involves a risk of loss.
Please consider carefully if such trading is appropriate for you.
Past performance is not indicative of future results.
Always limit your leverage and use tight stop loss.


KAVA IS SO HOTkava retest support line now can go to break Resistance and go upppp
targets: 6.8 , 8 , 11


KAVAUSDT H8: 100% gains XABCD BEST LEVEL TO BUY(SL/TP)(NEW)Why get subbed to me on Tradingview?
-TOP author on TradingView
-15+ years experience in markets
-Professional chart break downs
-Supply/Demand Zones
-TD9 counts / combo review
-Key S/R levels
-No junk on my charts
-Frequent updates
-Covering FX/crypto/US stocks
-24/7 uptime so constant updates
KAVAUSDT H8: 100% gains XABCD BEST LEVEL TO BUY(SL/TP)(NEW)
IMPORTANT NOTE: speculative setup. do your own
due dill. use STOP LOSS. don't overleverage.
🔸 Summary and potential trade setup
::: KAVAUSDT 8hours/candle chart review
::: updated/revised outlook
::: still great setup for 100% gains
::: speculative XABCD setup in progress
::: BULLS get ready to BUY LOW point C
::: from my level TP +100% gains
::: this is BUY/HOLD setup
::: patient traders only
::: not for gamblers
::: SPECULATIVE SETUP
::: do your own due dill
::: and use proper risk management
::: TP bulls is +100% gains
::: details: see chart
::: FINAL TP +100% gains point D
::: recommended strategy: BUY/HOLD
::: SWING TRADE: BUY/HOLD IT
::: bull run not over yet
::: good luck traders!
::: BUY/HOLD and get paid. period.
🔸 Supply/Demand Zones
::: N/A
::: N/A
🔸 Other noteworthy technicals/fundies
::: TD9 /Combo update: N/A
::: Sentiment mid-term: BULLS/PUMP/point D
::: Sentiment short-term: BEARS/PULLBACK/point C
RISK DISCLAIMER:
Trading Crypto, Futures , Forex, CFDs and Stocks involves a risk of loss.
Please consider carefully if such trading is appropriate for you.
Past performance is not indicative of future results.
Always limit your leverage and use tight stop loss.

💡 KAVA/USDT💡 Hello everyone, if you like my idea, follow me with likes and comments, I will also try to share the best ideas with you, Always do your own research before opening positions and always put stop limit.


KAVA DAILY CHARTAs you can see OBO formation available. be careful for new purchases
NOT AN INVESTMENT ADVICE

KAVA breakout comingKAVA/USDT forming a symmetrical triangle pattern. KAVA also break the long downtrend and now ready for the triangle breakout. KAVA is launching the KAVA SWAP soon. Bitcoin breakout is confirmed and ETH is also pumping, this is a good sign for alts and we see a good move in alts soon. This is a good time to build your position in KAVA.
Buy Zone : $6.25 - $6.33
Sell Zone : $6.8 - $7.12 - $7.55 - $8.2 - $9.1 - $10.4


