KAVA LONG TRADE 20201110Symbol: KAVAUSD, KAVAUSDT
Indicator: 9 Seasons Rainbow Multi TimeFrames Pattern PRO
Timeframes:15M - 2H
Signal: RED-> Green * N
I appreciate your like or comment. Welcome to share your idea here.
PM the author for a trial of "9 Seasons Rainbow Multi TimeFrames Pattern".
DISCLAIMER
This is only a personal opinion and does NOT serve as investing NOR trading advice.
Please make your own decisions and be responsible for your own investing and trading Activities.
Trade closed manually: Closed when the above ribbons turns Yellow or Red.
KAVAUSDT

KAVA USD pair to X10 in the following monthsSome signals are pointing to KAVA as one of the alts with more possibilities to x10 in the upcoming months:
- retracement from last pump reached 78.6% fib level, which means the retracement is coming to an end.
- it looks resistance and support lines are well defined from bottom to peak, so there is a good chance to trade in that channel.
- there is a huge bullish falling wedge you can see on the weekly and daily chart that should be about to break upwards. Same structure can be seen in other alts, another signal they are gonna pump sooner or later.
- Alt market moves usually come during the end/beginning of each Quarter.
- kava.io is improving its platform.
- Taking into account fib levels and r/s lines, KAVA is likely to have 7 usd and 10 usd price peaks in 2021.
These are good days to fill your KAVA bags.


KAVA/BTC (Test Key Level Support)💎Technical Analysis Summary💎
BINANCE: KAVABTC
-KAVA is on a strong downtrend coming from the high 45k sat
-It is now approaching its key level of support around 6400 sat
-We have seen a lot of altcoins breaking below its key levels
-So the risk buying at these levels are high
-Waiting for a proper sign of strength or reversal pattern is a must
-Trading discipline and the patient is a key factor for long term success too
A big Thanks for donating 💰 via Tradingview coins this week to SattarKHAN 🙏🎉
``````````````````````````````````````````````
Trading Involves High Risk ⚠️
Not Financial Advice 💸
Please Exercise Risk Management 💱
``````````````````````````````````````````````
Thank You All!🙏😊💖For Supporting My Channel 📺
Through Leaving A Thumbs Up, Comment & Follow 💬
Happy Trading!😊💕💖
``````````````````````````````````````````````

Trading ETH, VET, KAVA_USDT (Y20.P4.E8).OpportunitiesHi All,
I see a long opportunity in this 12 HRLY chart. Look for a bullish candle or combination of a bullish trio candle setup (smaller time frames) before taking the trade.
Also a shorting opportunity with VET.USDT. Similarly look for a few touches on resistance before taking the trade.
=========================================
Similarly with KAVA, 1st we need to see it break this to the down side before taking the trade. However its one of those I believe is 50/50 either way.
Need to see what takes place on the line
All the best.
Cheers,
S.SAri


KAVA/USDT (Potential short-term -- triple bottom) KAVA/USDT has potential for short-term upside with confirmation.
1) Triple bottom off support between $1.70 - $1.75
2) MACD 1D looking to crossover(confirmation on strong crossover)
3) RSI on 1D, 1W has room to grow.
Recommedend stop-loss $1.70 - $1.75
The Crypto Associate is not responsible for any losses incurred during trading digital assets or any form of security. This analysis does not constitute investment advice and should not be regarded as such. All analyses is for informational purposes only.

KAVA/BTC (Will Key Support Hold?)💎Technical Analysis Summary💎
BINANCE: KAVABTC
-KAVA is back at a key level of support after toping out from the 23000s sat area
-This is not a good sign in terms of bullish price action
-If this level of support becomes weaker, it will likely to breakdown soon
In-Bearish scenario, the next key support is somewhere around 12000 sat area
-Always prepare for both scenario of the market
A big Thanks for donating 💰 via Tradingview coins this week to billstenzel 🙏🎉
``````````````````````````````````````````````
Trading Involves High Risk ⚠️
Not Financial Advice 💸
Please Exercise Risk Management 💱
``````````````````````````````````````````````
Thank You All!🙏😊💖For Supporting My Channel 📺
Through Leaving A Thumbs Up, Comment & Follow 💬
Happy Trading!😊💕💖
``````````````````````````````````````````````

KAVA 12h. Final target is $4.2Kava Labs company created the first DeFi multi-asset cross-chain lending platform. This platform allows users to pledge a variety of crypto assets and instead receive a loan in Kava USDX stablecoins.
Today, 15.10.20, Kava Labs team plans to launch its own Mainnet at 14:00UTC.
Quite positive and powerful news to launch a rocket with Kava into space with a target $4.2 :)
If something goes wrong, the price will fall below $2 and then the bears will take control of the situation.
Follow us if u like!

KAVA.USDT (Y20.P4.E2).Next stage.Macro structure TAHi All,
Ref (A.chart)
Keeping this short and to the point.
> Double bottom with a W formation; These tend to have a strong bounce;
> Can be viewed as a potential inverse H and S in the making, or a ascending triangle;
> What ever it is, it looks like a delayed bottom formation unlike ADA or LINK that went ahead of the game:
This could be in a similar position like Link;
> The important factor is the test and sign of strength at the bottom again;
> Prior this macro correction, KAVA gave over 300% return;
> It has been that long which means Kava could have already gone through it’s larger corrective cycle. Is this the ABC correction and now we seeing a bottom reversal structure?
MACRO Overview:
Please give me a tick or like for this post
Regards,
S.SAri
Another perspective;

$KAVA CLEAR BULLISH REACTION OFF A DOUBLE BOTTOM $KAVA showed strength once she went for a double bottom. As long as she can clear the .5 of the current trading range we are in, we are in dip buying mode!
Clear invalidation would be the break of the double bottom structure. I see no reason for her to roll over unless $BTC does something ridiculously bearish.
If you want more updates on the PT Buy Sell indicator, follow along!
Follow, Like & Share! Look at my signature for more updates on our indicators & analysis :)

KAVAUSDT AnalysisEngineeringRobo and I are Bearish about KAVA at the moment
Holding KAVA is not advisable at the moment as 3 out of 4 EngineeringRobo signals are present and Risk/Reward ratio is below 2.
If you are interested in buying KAVA your options are:
- Buy when at least 2 of 4 EngineeringRobo Buy signals are present with R/R ratio 2 or more.
- Buy if candles break above the 2.197 resistance level, turning it to the support level
- Buy at the 0.798 support level.
- You can buy if the candles coming from above touch the uptrend line
If buying with EngineeringRobo buy signals, pay close attention to EngineeringRobo sell signals.
If you are interested in using EngineeringRobo, DM me!

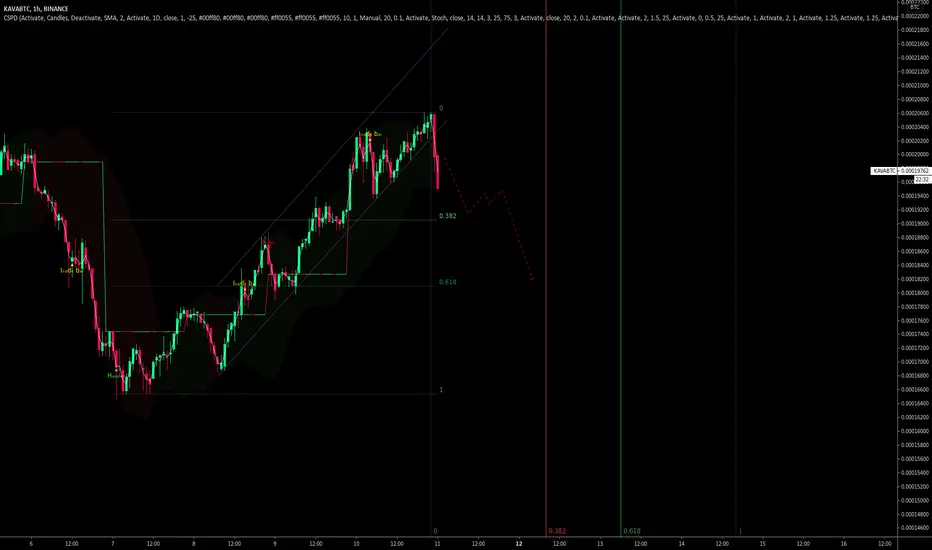
KAVABTC - Continuation of the downtrendIt seems that we will see a price decrease soon..
I'm also looking for another entry point around 19500 with SL around 20500(closure of one 4h candle upper than sideway zone).
Risk/Reward ~ 1/4

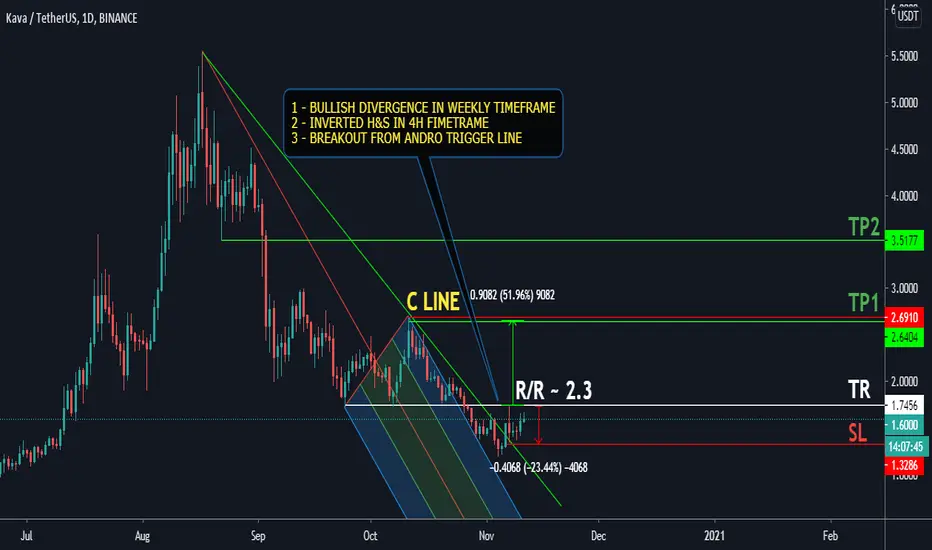
Kava.io (KAVA) - October 1Hello?
Dear traders, nice to meet you.
"Like" is a huge force for me.
By "following" you can always get new information quickly.
Thank you for always supporting me.
-------------------------------------------------- -----
Make sure you can get support at point 2.4172.
If you get support at 2.4172 and keep the price above 2.54 while breaking the downtrend line (3), you're likely to touch the 3.0986 point.
If it falls from the uptrend line (1), it is a short-term stop loss
It is important to see if it deviates from the downtrend line (3).
-------------------------------------------------- -------------------------------------------
I think it is a period of volatility from September 21st to October 1st.
Therefore, I think careful trading is necessary.
About October 28, when maximum volatility is expected to occur, is about a month left.
The most important thing is to generate money, so I think it's time to trade to earn money.
** Check support, resistance, and abbreviation points.
** Support or resistance is based on the closing price of the 1D chart.
** All explanations are for reference only and do not guarantee profit or loss on investment.
Explanation of abbreviations displayed on the chart
R: A point or section of resistance that requires a response to preserve profits
S-L: Stop-Loss point or section
S: A point or segment that can be bought for generating profit as a support point or segment
(Short-term Stop Loss can be said to be a point where profits and losses can be preserved or additionally entered through installment trading. You must trade from a short-term investment perspective.)

kava 4h looking bullishit looks retesting the resistance , gonna buy and hold some . sl 4h below red resistance

KAVA: ShortWait for the support to be broken and buy at the retest.
Please hit LIKE if you find this idea useful!

KAVAUSDTConfirmations for my decisions are double bottom, breakout from resistance trendline and a pennant pattern.
Take advantage with proper risk management.

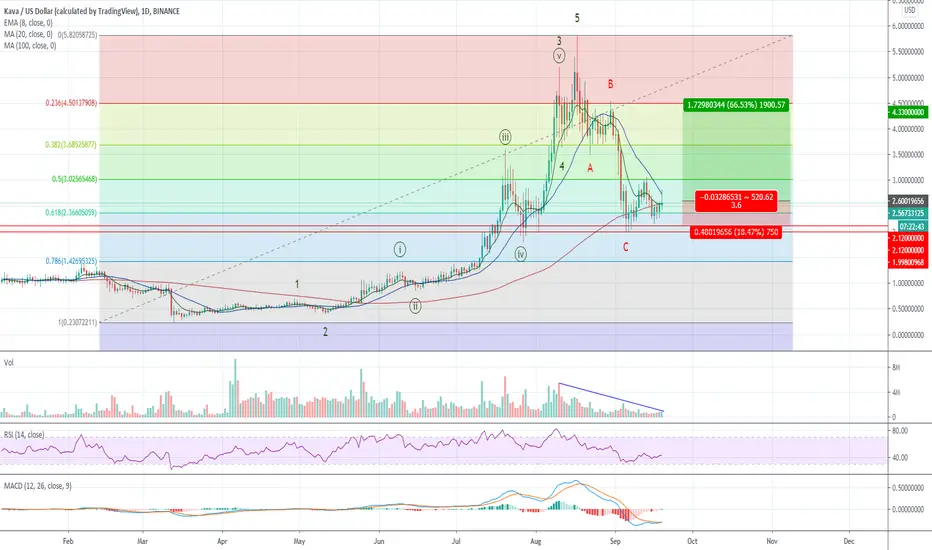
KAVA Bouncing at SupportBINANCE:KAVAUSD
Kava is bouncing at the $2 USD support level, near the 61.8% Fibonacci Retracement Level, MACD is just starting to give a buy signal, RSI is ticking higher. The previous decline from the $5.82 USD level was with decreasing volume, and this seems like a good place to go long.
In Elliott Wave Terms, we had a 5-wave move to the upside, followed by a 3 wave decline to a level a little beyond the 61.8% level, which is typical.
The Earn campaign for Kava is currently live, coinmarketcap.com
So, the trade is to go long here at $2.60 USD with stop at $2.12 USD and a price target of $4.33 USD, which should give us a risk-reward ratio of 3.6 to 1, which is pretty good.
Not a recommendation, just what I’m doing.
Good Luck to You