#KAVA/USDT#KAVA
The price is moving in a 1-hour bearish channel and sticking to it well
The price rebounded well from the lower border of its neck at the green support level of 0.660
We have a tendency to stabilize above the Moving Average 100
We have oversold RSI to support the upside
Entry price is 0670
The first target is 0.7180
The second target is 0.7435
The third goal is 0.7723
KAVAUSDT

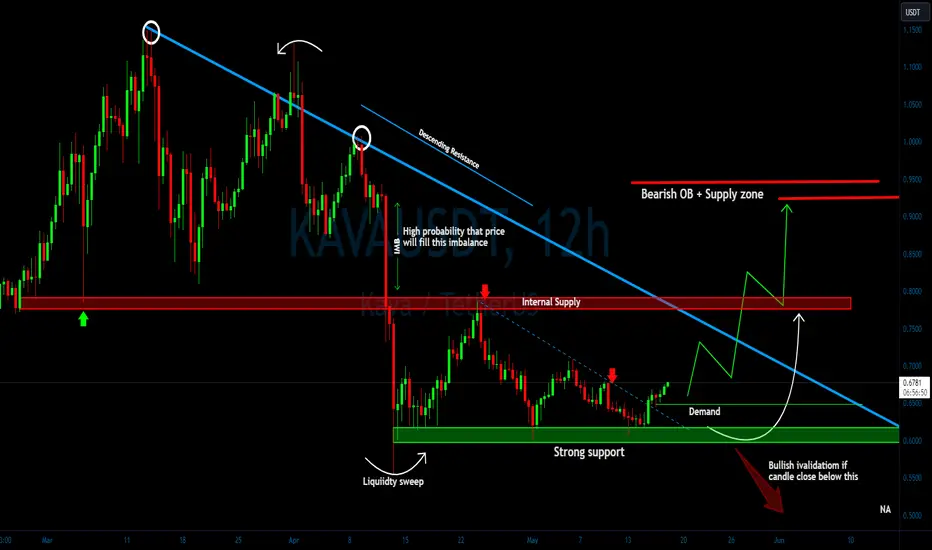
KAVA/USDT upward trajectory from demand? 👀🚀KAVA analysis💎 Paradisers, take note as #KAVAUSDT is currently making a noteworthy move, trading within a demand zone that significantly raises the likelihood of a bullish trend.
💎 Previously, we've observed #KAVA consistently respecting descending resistance. Currently, as the price regains momentum at the demand level of $0.6489, there's a high chance that it could overcome the descending resistance and tackle the noted Bearish Order Block.
💎 However, considering the inherent volatility of the market, if SEED_DONKEYDAN_MARKET_CAP:KAVA fails to maintain its momentum and falls below the demand level at $0.6489, this could indicate a softening of the bullish stance, potentially leading to a substantial price drop.
💎Should this occur, we will shift to plan B: we may witness a bullish rebound from the lower, substantial support level at $0.5963, although breaking below this level could trigger significant downward movements.
MyCryptoParadise
iFeel the success🌴
"KAVA" Extended wave next...Hello, friends. Nice to meet you
After breaking the RISING WEDGE down,
It shows a very strong extended wave.
If the upper line of this extended wave is broken upward, it is likely to rise to the recent high.

Last post didnt have full screenshotIdk why that happened, just take a look at the previous post, should be linked to this

Last trendline remains, lets share our thoughts :)You can probably see the image
200ema broke,
Some trendlines broke (pink for closer and blue for longer trendlines)
Now so far i am expecting a rebounce (not immediately) from lowest trendline
Unless ofc iran/israel stuff worsens, we may go even low
Anyway, let me know if anything can be improved in the chart

Alikze »» KAVA | The trigger pullback is brokenIn time W1, after exiting the density and pulling back to the dynamic trigger, it will now have the ability to grow up to the red box area, and if it fails, it will succeed in continuing the upward path to the specified goals.
»»»«««»»»«««»»»«««
Please support this idea with a LIKE and COMMENT if you find it useful and Click "Follow" on our profile if you'd like these trade ideas delivered straight to your email in the future.
Thanks for your continued support.
Sincerely.❤️

[KAVAUSDT]- Accumulation phase looks cheerful in 3d chart as it's in accumulation phase and obviously there is many attempt to breakout the 0.236 fib res.
extermly bullish if get out from the accumulation.
dont forget to support us with ur like comment and follow for more ideas,updates🎯

KAVA /USDT bullish horizons from key demand? 👀 🚀KAVA analysis💎 Paradisers, set your sights on #KAVAUSDT! An intriguing pattern has emerged, indicating it's in a prime spot for a potential bullish surge.
💎 #KAVA is on an upward trajectory within an ascending channel, having impressively crossed a significant supply point at $0.8455. With the price now nearing a critical demand level, keeping up the pace could pave the way for a strong bullish push into higher territory.
💎 If the drive behind SEED_DONKEYDAN_MARKET_CAP:KAVA starts to fade, we're poised to seize a potential uplift from the key demand level at $0.7972. However, a drop below this essential marker could signal a move into bearish waters.
💎 As always, make sure to navigate with savvy trading strategies and secure your positions with appropriate stop-loss orders! Keep an eye on the evolving market landscape and stay tuned for further updates.

#KAVA/USDT LONG#KAVA
The downtrend of the reversal flag has been broken
At the same time, the EMA 100 was breached higher
We have a large reversal pattern and the price looks set to break it
The price is expected to trade in an upward wave with price corrections
Current price 0.945
The first goal is 1.180
The second goal is 1.411

finally kava heating up
Seems Like kava Has Already Bottomed Out And Finally Preparing For Solid Recovery Currently testing Descending Trendline+ Crucial Horizontal Resistance Once Both Got Cleared Massive Bullish Rally Can Start Expecting 300-350% Bullish Wave Incase Of Successful Breakout

Is KAVA a sleeping giant in the market?Hello everyone!
You can call it whatever you want, but #KAVA is a real hidden GEM in the market!
The chart clearly defines a 5-wave growth structure in the past bull market and a long, drawn-out correction in the following bear market.
Currently, the asset has approached an important Fibonacci level, many other assets have already surpassed it, but not KAVA.
On a global scale, we have huge potential for growth, I dare not aim to surpass the previous ATH, but I think reaching $3 is quite possible, and if we reach a bit higher with much higher risk, $5 mark and phenomenal +390% on the spot market.
For myself, I see an entry after overcoming the 0.236 Fibonacci level and consolidating above it. Next, all targets are important Fibonacci levels.
This is not financial advice, everything you do, you do at your own risk!
Follow me for even more trading ideas!

#KAVA/USDT#KAVA
The price has been trading in a large descending triangle since last May
The downtrend was recently broken and the price began to rise successively
The price is expected to reach the first target of 0.919
Then it bounces back to correct
Before completing its rise to the second target at the level of 1.10, which represents 170% of the current price
This is supported by bullish momentum and oversold on the MACD
and as usual follow your trading plan and manage your risk.
If you like this kind of analysis don't forget to like and follow

KAVA/USDT Poised for Bullish Breakthrough? 👀 🚀KAVA Analysis💎Paradisers, turn your gaze to #KAVAUSDT as it weaves an intriguing story in the trading world. Positioned within a support zone, it's priming for a potential bullish breakthrough.
💎 A glance at #KAVA's past maneuvers shows a knack for moving through descending channels and launching into upward trajectories. Currently, with the price edging past the critical resistance at $0.9786, we're on the lookout for a bullish wave post-retest, transforming resistance into a launching pad for growth.
💎 Alertness is the watchword for seasoned #KAVA traders. Prepare for a possible bullish wave originating from the support level of $0.8854, particularly if our breakout hopes take a detour. However, dipping below this pivotal point might reveal challenges in maintaining a bullish momentum.

KAVAUSDT 5DKAVA ~ 5D 📈
#KAVA Make purchases gradually from here, with a minimum target of 20%++. This Resistance Line will soon be broken. 🚀

KAVAUSDT → Readiness to move into the distribution phase BINANCE:KAVAUSDT breaks the triangle resistance, which provokes the formation of a strong impulse. But now the price meets the flat resistance at 0.954.
On W1, the coin is starting to come to life, but is still very far away from the overall altcoin market. Trading volumes are growing when the resistance is broken, which indicates that the market is ready to realize the accumulated potential.
On D1 we are interested in the level of 0.954. A correction is possible, but we need to wait for a breakthrough and price consolidation above this area, which will be a confirmation of the market's readiness to go higher.
Support levels: 0.865, 0.694
Resistance levels: 0.954
I expect a final exit of the price from the global downtrend and subsequent growth to 1.28 and 1.55.
BINANCE:BTCUSD CRYPTOCAP:TOTAL CRYPTOCAP:TOTAL2
Regards R. Linda!

KAVA will fly soonFrom where we entered START on the chart, it seems that KAVA has started a triangle and is now completing the final wave of the triangle. It seems that the last wave of the triangle will be completed soon and we will see the KAVA pump.
Closing a daily candle below the invalidation level will violate the analysis
For risk management, please don't forget stop loss and capital management
When we reach the first target, save some profit and then change the stop to entry
Comment if you have any questions
Thank You

KAVAUSDT Elliott Waves AnalysisHello friends.
Please support my work by clicking the LIKE button👍(If you liked). Also i will appreciate for ur activity. Thank you!
Everything on the chart.
Entry: Find your entry point yourself (im in pos from 0.184)
Targets: 1.3 - 1.6 - 1.9 - 2.4
after first target reached move ur stop to breakeven
Stop: 0.67 (depending of ur risk). ALWAYS follow ur RM .
RR: 1 to 10
risk is justified
Good luck everyone!
Follow me on TRADINGView, if you don't want to miss my next analysis or signals.
It's not financial advice.
DYOR!

#KAVA/USDT#KAVA
We have a down channel that just broke out perfectly
We have a strong rising trend on RSI as well
We have stability above the Moving Average 100 and we have an upward momentum supported by the rise of Bitcoin
The pattern is canceled if the day is closed with a strong bearish candle below the green support area at 0.684.
Entry price is 0.779
The first goal is 0.810
The second goal is 0.888
Third goal 0.967

KAVA is bullishWith the iCH and iBOS we have on the chart, a bullish view is formed on the chart.
Transfer of buy orders is progressing well
I specified the targets
Closing a daily candle below the invalidation level will violate the analysis
Note that the financial market is risky, so:
Do not enter any position without confirmation and trigger.
Do not enter a position without setting a stop.
Do not enter a position without capital management.
When we reach the first TP, save some profit and try to move the stop continuously in the direction of your profit.
If you have any comments please post them, comments will help us improve our performance
Thanks

SasanSeifi 💁♂Potential Upside in Long-Term (4-Day) AnalysisPrice broke the long-term descending trendline and had a minor uptrend after a pullback and ranging. The current price is trading at $0.94.
Expectations:
After breaking the $1 high and a minor correction, the price can further rise to the $1.20 liquidity zone and the $1.50 supply zone.
To better understand the continuation of the trend, we need to see how the price reacts to the $1.50 supply zone.
Support Levels:
$0.78 / $0.70
This is not financial advice. Always do your research before making any investment decisions.🙌
Sure, if you have any more questions or need further clarification, feel free to ask. I'm here to help!✌
if you found my analysis helpful, I would appreciate it if you could show your support by liking and commenting. Thank you!🙌

KAVA 1D BULLISH WAVEKAVA in 1D timeframe has already broken descending triangle at 0.88 zone and gaining momentum, 1.3 would be the first target for short term and for long term 2x can be expected.

Long KAVA to .88 Cents for 14%+ ProfitsAll my KAVA indicators are set to green and with our VRVP PoC under price as support along with our 50/200 SMA's, I think entry here in KAVA is of good value. I will be targeting .87-.88 cents with a SL just under the 200 SMA at around .72 cents. The RRR here is 1/2. Not bad for a likely 14%+ profit potential.

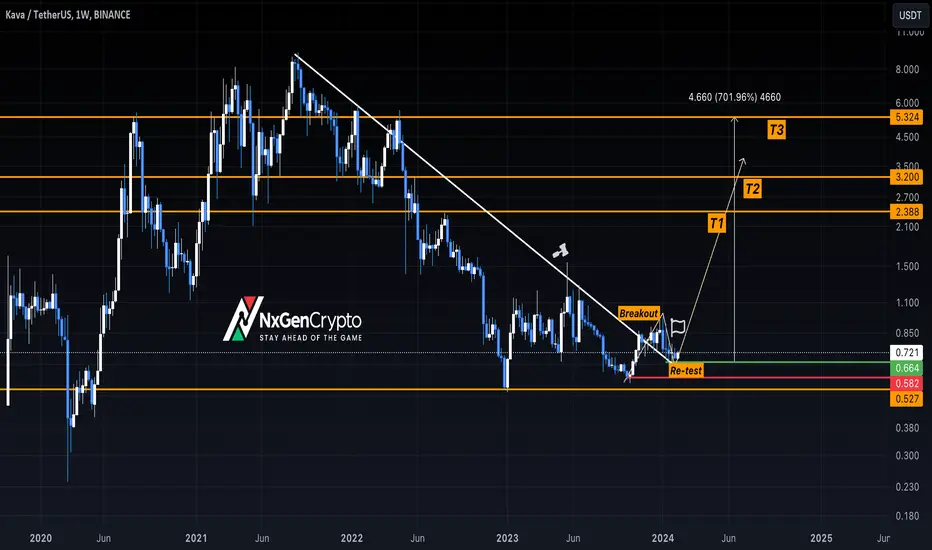
KAVA successful re-test, look ready hereKAVA looking ready after a successful re-test of the breakout
Demand Zone:
0.66 - 0.70
Sell zone:
$4.2 - $5
Risk/reward= SL 11%, Reward: 700%-+