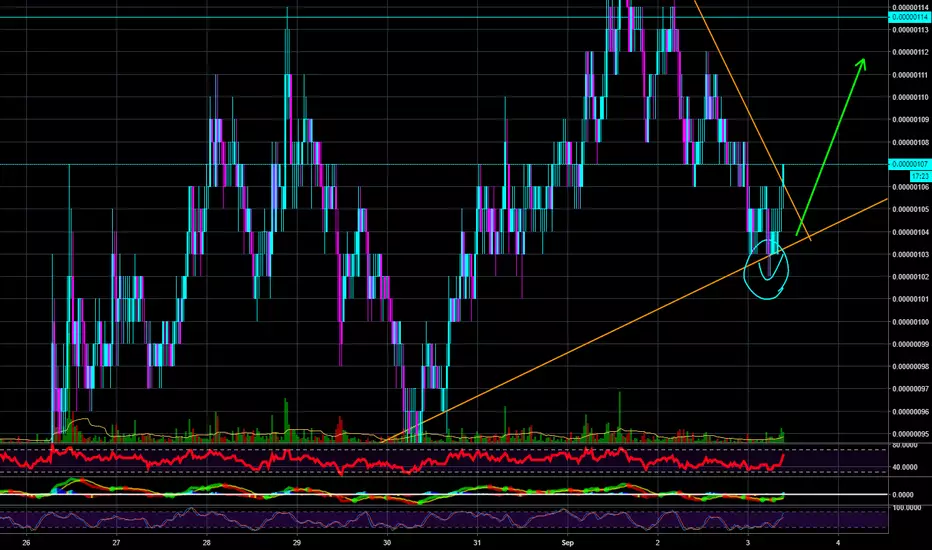
KEY triangle breakoutOur eyes on KEY. Getting close to triangle trendline with possibility of breakout towards 115 – 125 – 139. I can see here only two bullish scenarios. One is when the price returns back to ~97 and then bounce up. Another for direct “fly to the moon”.
Day chart for overview.
KEYBTC

KEY - LONG - Trade OpportunityTrade opportunity: KEY
After 9 days, KEY finally gets out of the trading range (White box), If the daily closes above, it will keep grinding upwards. KEY has been making higher lows and lower highs leaving us to think that it will get a huge green candle soon so, will leave a 3rd target in case it happens.
Entry: 92 – 93 Sats
Target 1: 98
Target 2: 106
Target 3: 113
Stoploss:87
Disclaimer
CryptoCue is not providing individually tailored investment advice and is not taking subscribers personal circumstances into consideration when discussing investments. Investment involves a high degree of risk and should be considered only by persons who can afford to sustain a loss of their entire position. Investors should consult their registered financial adviser before investing.
CryptoCue is not registered to provide investment advice and is simply providing an opinion, giving a particular experience. Information contained here is not an offer or solicitation to buy, hold, or sell any security.
CryptoCue is not a broker-dealer or financial adviser and is not affiliated with an investment advisory firm and does not engage in activities that would require such registration.
CryptoCue and/or any others affiliated with CryptoCue, are not responsible for any gains or losses that result from the opinions expressed herein.
CryptoCue makes no representation as to the completeness, accuracy, or timeliness of the material provided and all materials are subject to change without notice. Opinions discussed herein have not been reviewed by the securities and exchange commission or any state securities regulatory authority.

Key Looking at possible mechanical ignition.Key looking to test levels. Ignition to break levels looks to be prepping across all time frames.

Daily Bullish Signal $KEY $KEYBTC (14-10)#KEY (KEY/BTC)
Buy : 90
Flash Sell : 95
Short Sell : 100
Long Sell : 105-110-115-120-125
Stop : 84
Follow me for more signals daily

KEY/BTC, indicators on green for a new pumpHi guys,
This is a short analysis on KEYBTC.
The breakout happened yesterday, and indicators looks good to pump KEY higher.
Need confirmation on ichimoku in the next days.
OPEN PRICE : 103 sats
TARGET 1 : 120 sats
TARGET 2 : 150 sats
Thanks for your time.

Last chance to get key sub 100, XRP breakout pattern is emergingGet ready guys.
Something exciting is about to happen to KEY.
I don;t know what it is but stuff like below is good:
blog.selfkey.org
What u are experiencing right now, is definitely not a bear, but a accumulation into a rally.
I highly recommend to load up right now, instead of missing out on the surge, and deal with the volatility.
Just look how this pattern have developed for XRP, it is going to do the same thing for KEY.
Good luck everyone ;)
**LEGENDS**
BLUE = Bear/Resistance
Yellow = Bull/ Support
~Explore the chart for possible scenarios of price actions - use zoom and scroll for better view.~
/*This information is not a recommendation to buy or sell. It is to be used for educational purposes only.*/
If you want your coin to be analysed, JUST ask.
If you got a question, ASK away!
And please keep those Stop losses in place!
Fractal dates are moments of interest, where price and time collide to create oscillation - vertical lines!
Thank you,
Ajion


Oh Ghost! Do You Really Believe $KEY Will Back to 200 Sats?24/9/2018 Ranked #243 which just celebrated their 1st birthday on September 3, 2018! The goal of this ERC-20 token is make sure you can control your Identity and privacy. Do you really believe that they will achieve such goal one day? There is always possibility in this early development environment.
Really wanted to discuss about $KEY chart tho. First of all i saw this KEY thing as the same as SiaCoin thing. Which both are low sats on Binance along with another ones like NCASH and HOT. The psychology behind low sats is that, when you bought it, look like a lot compared if you bought that one who already quite "expensive" in prices.
I bet KEY has a long way to go, but here is a thing. Binance has been my favorite exchange ever since it had an overload user registrations back then, feels like i'm special because I already have a couple of accounts. But another reason why i love Binance is the volume itself which always kind to low sats. Meaning, if you entered low sats at very good entry, or just accumulating regulary, at some point, the pump is really good tho and it's quite normal for them to be because not like many "ghost exchange" or "low volume exchange" the whale will always be around.
So do you really believe $KEY will be back to 200 sats?

KEYBTC LONGBUY : 90-92
S/L : 88 ( Prefer to do manuel sl if close under 88 (4 hour )
Target 1 : 108
Target2 : 120

KEY Trading AdviceBuy Price: Yellow Line
TP: Green Lines
Invest Suggestion: 5-10 Percent
Profit Expectations: 5, 10 or >20 Percent
Just hold and watch. All targets will be reached within 24 to 72 hours as my prediction. But it's recommended to hold it for 6-7 days if any target not reached. Sell when you got some profit. I am sure, you will be get nice profit. Good Luck!
Looks Good? Leave a like, share and tell me in comments if my trading advices are working for you or I am just wasting my time and effort.
Thanks for visiting.


Analytics KEY/BTCYoung token with a promising idea of a digital ID. The asset found a historical low at the level of 0.00000066, which was formed with reduced trading volumes.
Favorable entry points are in the range of 0.00000084-0.00000087. In the medium term, the potential growth is approximately 180%. But you have to be careful. Technical analysis does not work correct, because token is subject to social factors and manipulation.
Overbought assets are observed in DOM and due the indicators at the moment, the rolllback to 0.00000084 is likely. Volumes are low, only 20-30% of the average.
Intraday volatility with reduced trading volumes is within 3-6%, while normal volatility is up to 20%.
There are good long-term prospects.

KEYBTCPlaced some bids at 92 and 93 sats.
Might not get filled.
Expecting news driven upside by the end of month.
BTC looking tricky.

Daily Bullish Signal #KEY #KEYBTC (18-09)#KEY (KEY/BTC)
Buy : 80-82
Flash Sell : 85
Short Sell : 90
Long Sell : 95-100-105-110
HODLER Sell : 140-180-220-240
Stop : 77
Follow me for more signals daily
PM me if you need help or learn to trade

KEY DOUBLE BOTTOM BULLISH SCENARIO - CryptoManiac101KEYBTC
Enjoy this trade advice my Crypto Maniacs, but remember to invest only what you can afford to lose or you're going right back to poverty on drop. We are not your financial advisors.

Bullish Signal for #KEY #KEYBTC (10-09)#KEY (KEY/BTC)
Buy : 84
Flash Sell : 85-86-87-88
Short Sell : 90-92-94-96-98
Long Sell : 100-105-110-115-120
Stop : 80
Follow me for more signals
PM me if you need help

Bullish signals for #KEY #KEY/BTC (06-09)#KEY (KEY/BTC)
Buy : 88-89
Flash Sell : 90-91-92-93-94
Short Sell : 95-97-99-101-103
Stop : 84
Follow me for more signals
PM me if you need help

SelfKey broke resistanceLooks like SelfKey is not ready to Boom right now, aiming for the green boxes to look for an entry

KEY breaking lines KEY breaking lines KEYBTC
Look good for entry
Love to hear your thoughts?
This is for my own research
Always Trade Safe
$Key / $ETH Setting up nicely for long setup$Key / $ETH Setting up nicely for long setup. this one pumping very fast as well as dumps very fast as well. place tight stoploss.
Description: SelfKey is a blockchain based digital identity system with an integrated financial services marketplace, designed to put identity owners in control of their personal data, and to allow them to request identity claims attestations and instantly apply for passports, residency and financial services in a safe, secure manner.
Circulating Supply: 2,430,991,491
Total Supply: 5,999,999,954
Upcoming News & Events
Title: Wallet Desktop App
Date: 29 September 2018 (or earlier)
Description: Alpha Launch of SelfKey Corporate Identity Wallet desktop app
Title: Partnerships
Date: 29 September 2018 (or earlier)
Description: Partnership work with governments and utility providers begins.
Title: Mobile App
Date: 29 September 2018 (or earlier)
Description: Alpha Launch of SelfKey mobile app.
Title: Desktop App Beta
Date: 31 December 2018 (or earlier)
Description: Beta launch of SelfKey desktop app

Technical Analytic for #KEY #SelfKey (30/08) - CryptoStationLast call was finished successfully. Now we will make a new call
#KEY (KEY/BTC)
Buy : 94-96
Flash Sell : 97-98-99-100-101-102
Short Sell : 104-106-108-110-112
Long Sell : 115-120-125-130
Stop : 88
Follow me for more signals
Inbox me for more and more signals

Good Entry (25-08) #KEY #SelfKey - CryptoStationBuy : 86-87
Sell : 89-91-93-95
Sell : 100-105-110-115
Stop : 81
Follow me for more signals
