Multiple Confirmations For The ShortI have multiple confirmations for the short to last at least a few days or for the week. We have a bearish engulfing on a daily timeframe plus, we also have multiple bearish engulfing candles on the 4-hour chart after the monthly level was respected as resistance.
So one of two things is going to happen: this will be a pullback for another bull run, or we're about to do another nosedive to make a new lower low. Let's find out.
BULL TPS:
• 58096 .71
• 59603.93
• 61359.15
BEAR TPS:
• 55750.00
• 54364.99
• 52953.39
Keylevels

Possible Retest For A Swing Sell Happening This WeekLast week, GJ showed fatigue at a weekly level and took a nosedive for the week. It actually created a bearish engulfing on the weekly chart, so I', looking for a retest of last week's move before a continuation down. I have my BULL TPs a little too high this week because I don't really know how long the pullback will last before we continue dropping. Always good to play both sides of the field until you get what you want.
BEAR TPS:
149.837
149.334
148.296
147.442
BULL TPS:
150.834
151.260
151.633
152.091

May Be A Pullback Before A Bullish ContinuationLooks like a correction is happening before we continue the bull run with this pair. I missed the move paying attention due to watching higher volume pairs, But will keep an eye on it this week from here on out. When this pair moves, it MOVES. So here are the TPS I want to see the price complete when it makes a full decision where it's going.
BULL TPS
1.49803
1.50555
1.52001
BEAR TPS
1.48504
1.48060
1.47507
-

TrendyTrades: NIO bounce off Daily-DemandUsing Supply & Demand on a higher time-frame (DAILY) I've found a simple analysis of NIO respecting Supply along with a Daily Key-Level at 42.71 and slapping back down. NIO has respected the Demand Zone at around $34 three times before and instead of heading back to that level, I believe it will catch a newly made Daily Demand level of 37.17 which will cause it to bounce up and back into Daily Supply/Daily-Key Level. -TrendyNeck

EURAUD going short overall downtrendEURAUD has been a long term downtrend( trade with the trend)
i've seen a breakout of trend and it touch my daily resitance zone therefore we are looking for sell Opportunities
2.5 risk/reward
I explain my reason why I took this trade, this is my analysis so take it with precautions
April 27 2021

NZDCAD possible shortsMarket structure was broken to the downside, Nzd/Cad is now creating lower lows and lower highs. Price is retracing to one of our key Fibonacci levels, which is also the previous broken low of structure. After the bears show strength in the lower time frames (1H, 4H), we can look for sells to create a possible new lower low. If the bulls show strength in the lower time frames no trade will be executed.

GBPUSD PRE-MARKET ANALYSIS 12 APRIL, 2021OVERALL TREND- BULLISH ON THE DAILY (OVER 200EMA) and at a corrective retracement of a key support structure level.
Again looking for long setups based on key support levels, looking to break into higher highs with a potential bounce retest of a major key support level at 1.380 and 1.380
Otherwise we have a key support level between 1.367 and 1.368 that price may retest for a 3rd time.
Depending on how the price moves, we can look for entry opportunities on the 1H TF.
But overall, looking for long setup trades.

NZDUSD Pre-Market Analysis 12 April, 2021OVERALL TREND DIRECTION- BULLISH ON THE DAILY, and currently at a corrective phase and at a key support level.
We can see that price has tested the lowest zone broke into newer highs and is currently in a ranging channel that is likely to breakout to make higher highs considering the overall trend direction.
Looking for long setups only from this one based off of price action and where support and resistance key levels.

AUDUSD PRE-MARKET ANALYSISOVERALL TREND- HEALTHY UPTREND ON DAILY, CURRENTLY IN A CORRECTIVE RETRACEMENT ON THE 4H TF, WITH THE POTENTIAL TO BREAK INTO HHs.
We see price currently in a ranging channel that's being tested multiple times from an overall bullish move on higher TFs.
Currently looking to make Higher highs unless price decides to make lower lows, at which may signify an overall break in trend to the downside.
2 potential long position set-ups this week to follow with the uptrend of the market overall.

XRP, Key Fibonacci levels. Beware of the traps and keep calm!We will probably touch the red mid fork line before a little retracement to the bottom of the triangle. Remember, XRP will not moon until the SEC case is settled. There will also be more fake outs, so do not rush your position, the price of xrp is also under a manipulated floor until they go online with CBDC. XRP will be the liquidity provider for the worlds' sentral banks so do not miss this BINANCE:XRPUSDT
Trade safe everyone, and have a great week!

Silver Short Idea.This one is a little bit of a reach, but I've done my best to corner it.
---
The Offspring and caffeine are the only things giving me life at the moment. They are literally propping my mental up like crutches in the armpit.

Is The Bearish Doji On The Daily Calling For A Sell?What a beautiful ride up. But now it's time to do a pullback. A bearish doji was created are the daily level and it's in the overbought zone with the RSI on the daily timeframe as well. I'm wondering if will make it to my weekly level at 152.725and then will we come tumbling down? Or will we just go ahead and start right away? Only the market can tell us. I have intraday TPs mixed with my swing targets this week. That's why there are so many TPs.
BULL TPs:
• 152.246
• 152.725
If it can get pass this weekly level, I'll target these other TPs'
• 152.966
• 153.288
• 153.822
BEAR TPs:
• 151.290
• 151.290
• 151.012
• 150.695
• 150.363
• 149.994
• 149.704

Multi-Wick Rejection Offf The Weekly Level Can Lead To ShortThis is a very jittery uptrend. And there are a lot of which rejections on my weekly area around 1.94408. I can see this from the daily timeframe. This could mean that we're getting ready for a short and if any reversals are possible, it will happen later part of the week. For now, my targets will be targeting daily levels from both sides. So less he had a market plays out.
BULL TPs:
• 1.94408
• 1.94950
• 1.96092
BEAT TPs:
• 1.93297
• 1.92725
• 1.92020
• 1.91514
• 1.91065

Daily Bullish Engulfing Retest Can Lead To Swing BuyGold looks like isn't perfect position to perform a swing bye beginning this week. We had a bullish engulfing bounce off a monthly level and then was retested on Friday to confirm to buy is a go for this week. I'm only trading it to a lower low that I found on the daily timeframe for now. And if it passes that monthly, of course I'm going to hold it for much longer. Bear targets are in place in case things don't do as planned.
I'm actually pretty excited to trade this pair for the week. Let's see what it does!
BULL TPs:
• 1731.17
• 1738.39
• 1746.00
• 1757.70
BEAR TPs:
• 1715.34
• 1709.17
• 1699.72
• 1689.00

Is A Pullback Due Or Are We Shooting Up Into The Unknown?This pair did a nice swing buy for the entire week last time. But, according to the daily, we may be running out of a little steam just for a bit. I saw that we wicked out at the daily level, so we may be due for a pullback coming down to the monthly area around 3897.3. That will retest the last higher high and then create a continuation up if respected.
If it busts through the monthly. I'll ride it down to the daily area around 3788.3 to see if it'll try for another bull run from there.
As you can see, my BULL TP went into unknown territory. That's what I'm looking forward to in the long run. But let's focus on what'll happen this week first.
BULL TPs:
• 3960.4
• 3979.5
• 4032.8
BEAR TPs:
• 3901.3
• 3870.8
• 3851.8
• 3788.3

BTC Short Term Key Levels! See You at $67k!Hello Traders!
Just wanted to provide a quick update to Bitcoin.
We just broke the Opposing Short setup so that's good for Bulls. We may get a slight pullback before continuing with the Shorts being stopped out, but depending on the market, it could keep going.
Ultimately, I see us at $67k in no time. Let's see if the market agrees with my analysis.
Key levels are on the chart!
Happy Trading, always manage risk.
Quality in trading is the ability to react to one's own psyche

EUR/CAD | Potential Downward Movement 🔨🔨🔨Technical Analysis:
The price on the higher time is showing lower lows and highs where it is smashing all the daily supports. Recently, the price posted a correction count toward the resistance (previously support) at 1.4914 USD level. On the lower time frame, the price is forming a bearish pennant, where we expect a breakout to the downside and then a move downward toward the 1.4852 USD mark.
-------------------------------------------------------------------------------------
Trade Idea:
Sell Limit Order @ 1.4914
Take Profit @ 1.4852
Stop Loss @ 1.4940
Trade Safely 🙂

Wedge Breakout Will Determine DirectionGold broke a range it held a few days, but needs to fill a wedge to determine its true direction. If bullish, I'm going to ride her as far as the daily level area to 1910.90. If it breaks for the bear, I'm going to swing it all the way down to the monthly area around 1769.11. This is the time of year where gold prepares for a swing trade. So I'm anxious to see where we'll go this week.
BULL TPs:
• 1877.19
• 1899.79
• 1910.90
BEAR TPs:
• 1843.04
• 1829.20
• 1819.96
• 1801.80
• Stretch TPs:
• 1779.78
• 1769.11

A Giant Slant With No Pullback Setting Up For A Big DropGBPUSD has been moving is a large slant for a lengthy period of time according to the daily. And a slant with no pullback of any kind means that a drop is coming. The sideways movement we're seeing could be setting up for a major move to the downside, or a temporary climb further up before it comes crashing back down. Time will tell. Here are the TPs.
BEAR TPs:
• 1.36126
• 1.35326
• 1.34493
• 1.33804
BULL TPs:
• 1.37593
• 1.38250
• 1.39098
• 1.39786

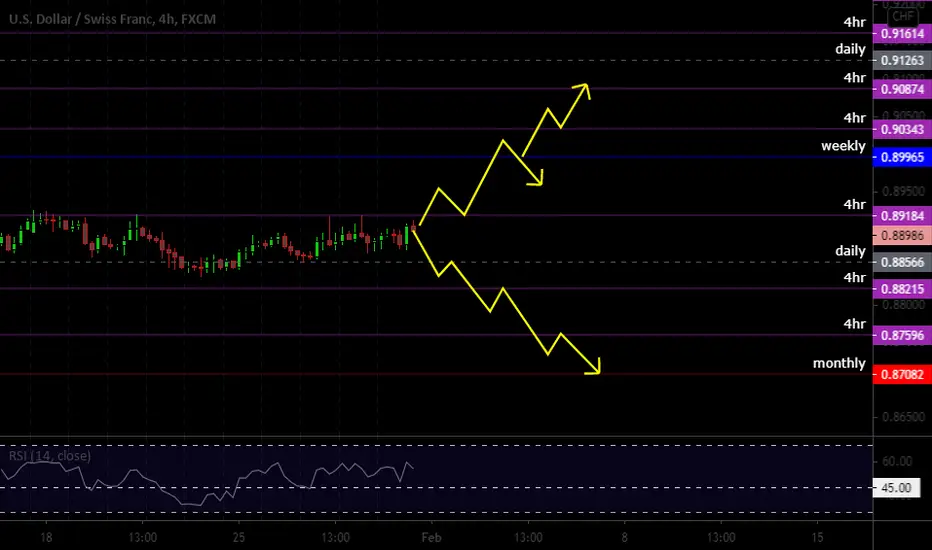
Inverted Head and Shoulders on Daily Could Signal A Big MoveHELLO Inverted Head and Shoulders on the DAILY!! My levels have already trapped price and all I am doing is waiting for the breakout of consolidation between the 4hr 0.89184 zone and daily 0.88566 area. Gonna enjoy this move when it takes off, so be ready!
BULL TPs:
• 0.89965
• 0.90343
• 0.90874
• 0.91263
BEAR TPs:
• 0.88215
• 0.87596
• 0.87082
EURAUD SETUP 1:4Firstly, I identified the general downtrend then looked for key support and resistance levels.
These levels were dynamic and consistent with the downtrend.
The entry was set at the first level of resistance with the TP being closer to the support level.
The SL was set at a key level where previous support had turned into resistance.

GBPJPY - Where will we go after 150. ? 2020's bullish run into 2021 has most defintely surprised us all, but is it time for a potential reversal once we've exhausted the 150. level?
- I'm personally bearish once liquidity has been snatched between 150-150,500 where retail stops will be on last week's short sellers.
-A very interesting week or two coming for this pair I feel, has the mood changed?
-DXY strength could come into play next week, which could give that fundamental push to the yen.
-*First entry indicated is more of a potential retail buy setup and stop loss, I'd wait for a confirmation rejection from the bottom of the grey order block below before longs to 150-*
- Second entry shown gives me more confidence and confluence to take the trade depending on how momentum appears when approaching these key levels.
What are your thoughts?
This is only my perspective on potential price action that I shall be looking for over the coming days/weeks as indicated.

Good day my friends analysis on GBPUSDWill it sell to the 1.3715 level and continue the buy trend? Let see how the judges guide us
