$BTCUSD Important levels for maintaining bullish momentumBefore we get into this idea, please note that performance is not guaranteed. I recommend doing your own research before entering any trade. Your upvotes & comments are appreciated.
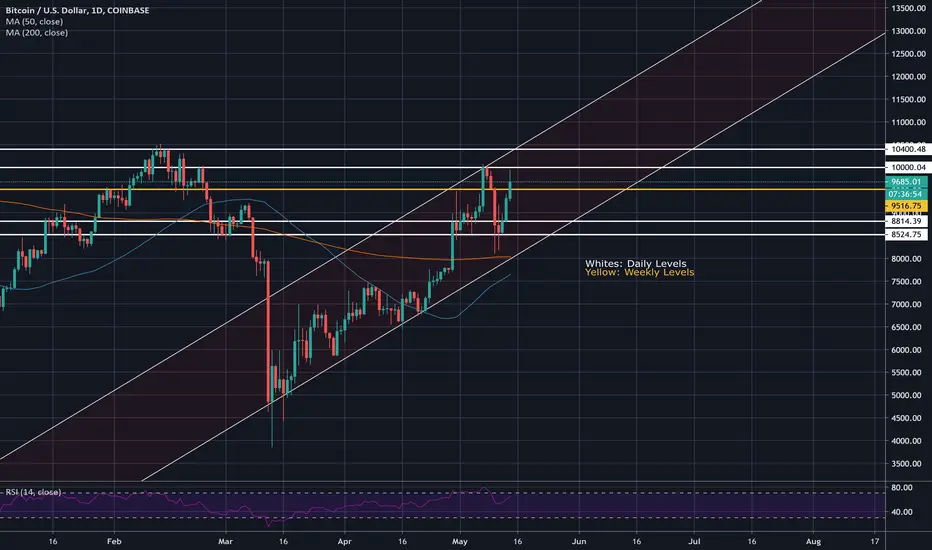
Since the strong decline between the 8th and the 12th of March, COINBASE:BTCUSD has been recovering in a healthy fashion. Drops like the one last week look bad temporarily but are swiftly erased by new gains. For COINBASE:BTCUSD to maintain this momentum, there are a few key levels that need to be broken.
Before the drop in March, COINBASE:BTCUSD was able to break through the psychological $10,000 barrier, but failed to break through the $10,400 range. This failure was followed by a battle for the $10,000 level which the bears eventually won, driving price down to the lowest key resistance range, between $8,500 and $8,300. See image below for more.
After failing to find support at those levels, the March drop took place, taking us to the start of the upwards trend COINBASE:BTCUSD is currently in.
On the way back up, the $8800 level that previously acted as weak support turned into resistance and was broken rather easily. Since then we've seen price action re-attempt the $10,000 level. After failing, price retraced back to the support area between $8,500 & $8,300 before starting this new climb to the $10,000 range.
Zooming out on the weekly timeframe, weekly support & resistance is around 9500, and has been respected on the daily as well.
SUMMARY:
Daily resistances $10,000 & $10,400 need to be broken for further gains. Failure to do so would result in retrace to the $8,800 - $8,300 support area, potentially further.
Recommend longing when price breaks and successfully retests $10,400.
Once again, please do your own research. Best of luck.
- Jelle
Keylevels
Great continuation level for sell positionAs we can see the GBP/USD created a new supply above.
The current momentum is bearish and therefore this supply seems like a great level for sell position as a continuation trade.
The target will be the support at the bottom.

Higher Low Possibly Getting Ready To FormGA is hovering over the daily SR zone, but it looks like it may getting ready to do a higher low before continuing on a new uptrend. With the big nosedive it took, not sure how high it can go. But I'm gonna enjoy the ride either way.
BEAR TPS:
• 1.94116
• 1.93353
• 1.92369 (where I believe the higher low will complete for continuation)
• 1.91329
BULL TPS:
• 1.95087
• 1.96401
• 1.98068

Correction DueYou missed a helluva move last week with this pair if you weren't paying attention. So this week, we're trading the possible retracement for continuation. It depends on what the market feels like. Right now, it appears this will continue bullish after a correction.
BULL TPS:
• 1.54878
• 1.56354
• 1.58161
BEAR TPS:
• 1.53960
• 1.52947 (zone where retracement will possibly end for continuation)
• 1.52140
• 1.50998

BTCUSD Key levelsIt's amazing how zooming out gives you perspective on the price action. The way I see it we have 3 key price levels at this moment.
6400 level : This level has been providing support for quite some time and has been tested quite a lot, the break below in March was quickly bought up again and we are back in the range between this level and ...
9200-9300 level : historical resistance level. We have been trading between the 6.4 K and this level for quite some time, not only since September 2019, but also in the period April through October 2018.
Finally there is the 13.8-13.9K level, the highest monthly close. If we manage to break and close above the 9.2K level on the monthly chart, this level is most likely going to provide resistance. Of course we can go above it, but what matters is where the month closes.
So what does this all mean for the future price action. Honestly, nobody knows, but I will give you my thoughts on it :
I think the month of April will close around the 9.2K level and in May we will see a ramp up in price of people FOMO-ing in anticipating the #bitcoinhalving. I do not expect spectacular price action in the next few months and chances are that we will still remain in the band between 6.4 and 9.2K for a couple of months until the "supply shock" gets real and miners don't have that much BTC to sell off. After that (probably Q3-Q4 2020) we'll probably see a price hike testing the 13.8K level. A lot will depend on retail and the macro-economic situation whether we'll break that level or not ...
Let me know whether this makes sense or not in the comments below, and if you like my idea, please give it a thumbs up. Thank you for your time !

The Technicalities of Key Levels (Institutionalization) This was made for someone asking for the key-levels on GJ and where they are. I hope this shows how powerful waiting for rejections and consolidation around institutional prices can give us high probability trades. The goal is to analyze from top to bottom, gathering the price action data in order to tally up confluences. For stop placements, the 4-hour chart will be the lowest in which we find SL points above lower swing highs and below higher swing lows.
Turning analysis into trades..
When performing analysis across the daily and weekly timeframes on a Sunday night for instance or analyzing the daily charts at the end of every trading day, the first important pieces of data to pick out are key level price points and candlestick formations. You’re looking for patterns, that might serve as clues for the next directional movement of any specified currency pair.
Price action, moving averages and key levels are displayed on the longer-term charts and these are generally the most significant and strongest. It’s best to take note of these levels at the end of each trading day or morning and then plot them on the charts using the charting tools available in your trading software of choice. Keeping a notepad at hand helps to keep track of the organizational breakdown of your selected currency pairs. Beginning traders should start out with six or seven pairs, then strip each one down, labeling the bullish and bearish indicators for each one on every time frame, starting with the monthly and working your way down to the 2-hour chart.
Timeframe rules are the basic building blocks of all other trading strategies, so it’s important to have a good understanding of them before moving on to more complex methods. Keep it simple, learn the rules, make notes and work with the price action that the market delivers through the charts. In this sense it can be helpful to remind yourself that trading is essentially a financial game between the bulls and bears – the optimists and pessimists in the market – both of whom have the same goal of earning a profit but who achieve it through different means.
Key level placement
Support and resistance levels are one of the most important technical factors in trading. “Key levels” are certain prices for a currency pair which may support the price below the current market level or a price which may resist above the current market level. Support acts as a floor and resistance acts as a ceiling, both of which are “barriers of price.” .
For example, the chart above displays various support and resistance zones. These key levels are major support and resistance areas; they are strong price points which the pair has reacted to a number of times. Currencies tend to react to these specific price points with a surprising degree of consistency. The market can either bounce or break upon the approach of a key level. Many beginning traders struggle due to not drawing key levels onto their charts accurately. Support and resistance are the absolute foundations which hold the ground for various other price action applications. Once a support level has been broken and the bears take control, the price often (but not always) pops back up to that same level from underneath in order to “retest” it once more before a continuation to the downside, and vice versa. Your job as a trader is to pick as side in this battle between support and resistance forces – between bulls and bears. If you pick the right side, then you will make money; of course, you pick the wrong side you will lose it.
________________________________________________________________________________________________________________________
________________________________________________________________________________________________________________________
No part of this copyrighted research may be reproduced or used in any manner without written permission of the copyright owners. Procescusion enforced.
________________________________________________________________________________________________________________________
________________________________________________________________________________________________________________________
BUY | Possible Crab Forming#USDJPY - Tendency: Bullish
Observations -
i - Price has broken a trendline
ii - Possible Crab forming
iii - If Crab is forming, the D leg also coincides with a major key level and a major trendline above

EURUSD: 1.08 | Key Levels LONG | SHORT position volatility at lows unnoticeable moves yet regulated towards reset levels

Respect of Trendline Indicates Bears Are Still In ControlUhhhh yeah, I don't see any bullish anything happening here. On none of the higher timeframes. A just in case bull move was shared anywho. Trendline was respected to continue to bearish move to the southside. This is gonna be a good ride. So will trade accordingly.
BEAR TPS:
• 1.73132
• 1.72943
• 1.71354
BULL TPS:
• 1.75772
• 1.76611
• 1.77635

Bearish Continuation LikelyBoth this pair and EURCAD will be bearish as long as the Canadian dollar continues to show strength. Here are the TPs for both. My aim is for it to be bearish. But I move where the market moves.
BEAR TPS:
• 1.73132
• 1.71867
• 1.71354
• 1.69933
BULL TPS:
• 1.74523
• 1.75927
• 1.76611
• 1.77635

Can Remain Bullish If CAD Stays StrongBoth this pair and GBPAD will be bearish as long as the Canadian dollar continues to show strength. Here are the TPs for both. My aim is for it to be bearish. But you I move where the market moves.
BEAR TPS:
• 1.52947
• 1.52680
• 1.50998
• 1.49798
BULL TPS:
• 1.53960
• 1.54582
• 1.55656
• 1.56602

Will The Bullish Run End This Week?Traders drove GOLD into its bullish rally, but does their buying strength stand a chance against the OPEC meetings?
If the USD doesn't show strength after this week's OPEC meetings, this will continue to be bullish. Fundamentals will change the course of this pair this time.
Otherwise, we're going to have a nice trade-off the weekly key level no matter where it goes.
BEAR TPS:
• 1612.96
• 1594.92
• 1579.68
BULL TPS:
• 1629.31
• 1644.64
• 1668.80

Possible Lower High FormingTechnical analysis wise, this is forming a lower high before the continued drop.
Fundamentals wise this week, we could go bullish if the USD gets strong during OPEC.
Let's find out this week.
BULL TPS:
• 108.940
• 109.669
• 110.818
BEAR TPS:
• 107.684
• 107.053
• 106.444

Pullback Due This Week Then Possible ContinuationExcuse the arrows not showing a retest.
GBP may keep going bullish since the US is still trying to figure out how to handle the outbreak better. So I am trading to stronger key levels. A pullback may be due for the time being. But after that, I am looking for the bull run to continue. Here are your TPs:
BULL TPs:
• 1.25035
• 1.26663
• 1.27248
• 1.27967
BEAR TPs:
• 1.23310
• 1.22306
• 1.20485
• 1.19224

Surge In Outbreak May Keep This BearishThe outbreak is rapidly spreading in the US with no signs of the slowdown happening yet.
If you haven't been paying attention to this pair lately, it's been making some pretty strong moves each week. I admit that I was even sleeping on this little bit, but not anymore.
This will be one of my top swing trade pairs for the next few weeks or months. I've actually been enjoying is several day rides and I'm going to keep continue to do so. As you may notice, I have bigger targets on despair due to the way it's been moving lately. Here is your TPS:
BULL TPs:
• 0.95716
• 0.96542
• 0.97306
• 0.97942
• 0.98358
• 0.99026
• 0.99673
BEAR TPs:
• 0.94910
• 0.93980
• 0.93476
• 0.92505
• 0.91845
• 0.90554

AUDUSD Key Levels Lowest AUSSIE Dollar has been in 17 years. Expecting a push to the upside in the coming months back to a key level. WEEKLY and MONTHLY Key levels posted.

EURGBP Swing Trade Sell EurGbp is aligning good on the weekly Tf I see a nice crucial level being tapped. If we see the 0.90985 not being broken on the weekly closure we will have a nice hedge fund position swing trade down to the 0.83000 and beyond if level is broken. I am watching this pair very closely.

Dxy Dxy overlook looks quite simple and clean to emerge down to the 92.45 level to retest its previous HL with the Dxy as we all know what’s going on in the United States with the corona virus empidemic favoring some minor weakness this week with weakness in us stocks

Gbpjpy short Gbpjpy has been in a sell out mode and is planning on dropping a couple more pips further. I see this pair having no problem going down to it’s weekly support @ the 127.800. We have a nice head and shoulders formation on the 30min timeframe a nice 4 hour shooter star will validate for a strong push to the downside let’s clash!

Buy BTC... Rocket about to take offFor Bitcoin lovers, As per Elliott Wave Principle, we are in the C wave upward, We are expecting to price Rally and move towards the highlighted target profit
Stop Loss: 7575
Entry Point: 7876
Target Profit: 9130
Good Luck !.

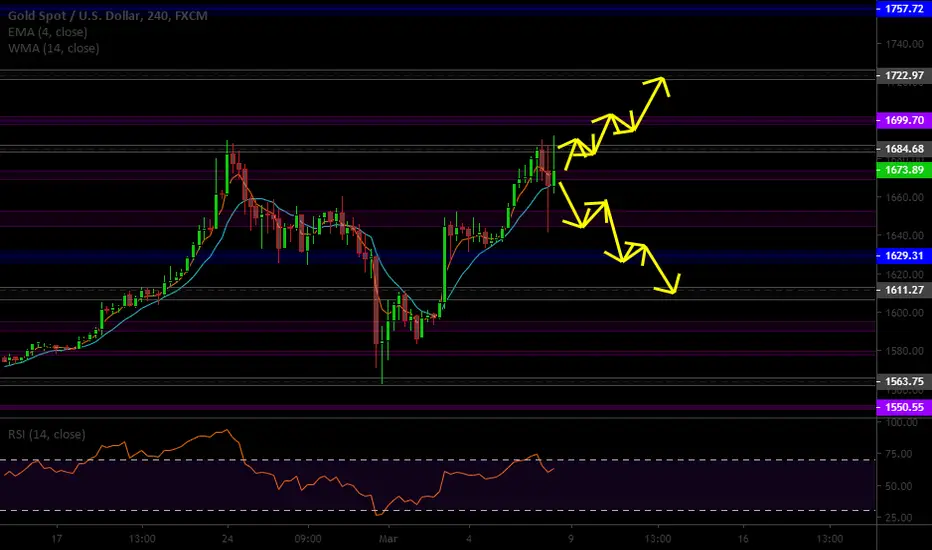
Gold Is Struggling To Get Past A Daily Key LevelThis actually looks like a slowdown of bullish momentum overall to me. It has rejected the daily SR zone of 1684.68 multiple times and is becoming overbought on higher timeframes. We may see another stutter step before another move toward the downside.
But the Coronavirus procedure here in the U.S. has been flawed due to lack of preparation and the market is been reflecting that. So if we do continue bullish, it'll be because of news on the United States right now.
Here are your TPS:
BEAR TPS:
• 1652.46
• 1635.33
• 1612.96
BULL TPS:
• 1683.62
• 1697.70
• 1720.94
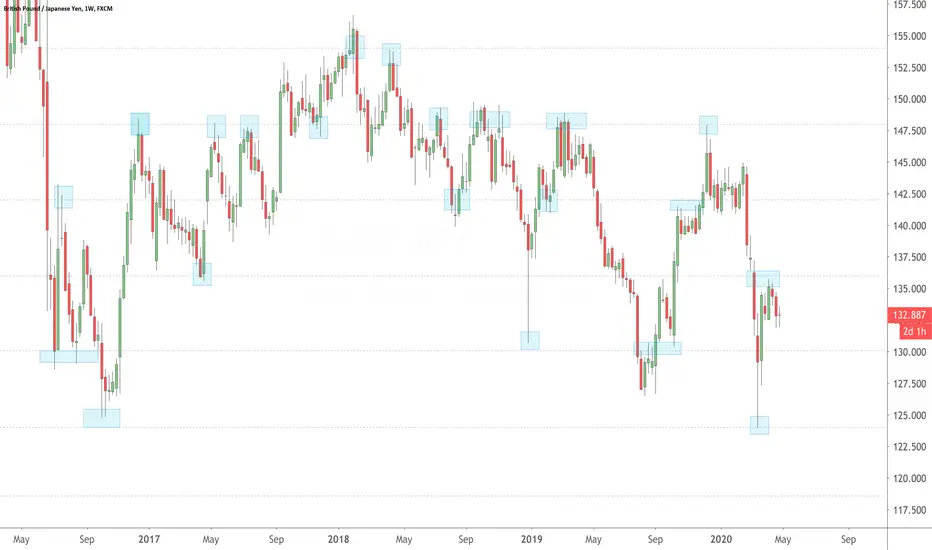
The Short Looks Like It May Continue...Where price is consolidating at on the 4hr became a very thing doji that retested a bearish engulfing candle. This could indicate another small retest before continuation back down or we're just gonna keep plummeting.
I want to see if we're going to keep going past the daily SR zone for 135.674 to the weekly. Or if the temporary long move does occur, will it stop at the monthly zone of 140.009 or not.
Even though I do see a reverse inverted head neck and shoulder formation happening on the weekly, it'll take a while for it to complete the right shoulder. That is, is price doesn't feel like keeping the bearish momentum in play.
Here are the TPs:
BEAR TPS:
• 135.909
• 132.775
• 131.018
BULL TPS:
• 139.393
• 140.009
• 141.288
• 142.510

EURUSD Sell opportunity Eurusd has been struggling to break above the 1.12 key level I am simply awaiting a retest of the previous HL at the 1.1095.
