GBP/USD: Opportunity for Swing Sell PositionAs we can see in this H4 chart, the GBP/USD price created a new supply above earlier today.
It seems like a great level for sell position as a for swing traders.
If the price retraces that supply I'll sell there and the final target for this position will be the support below.
Keylevels

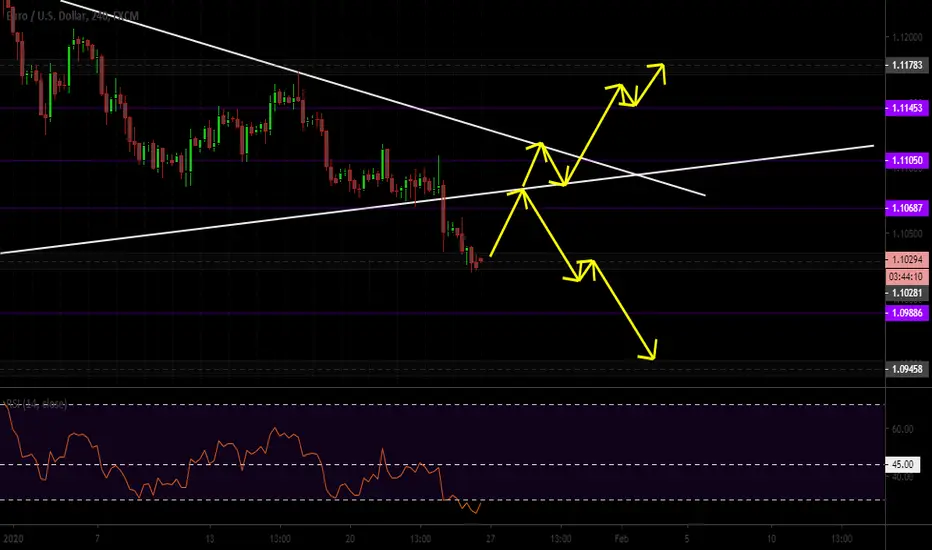
Retest of Wedge Before ContinuationWe are sitting on a daily SR….which means whatever direction it chooses, it's definitely gonna keep going to the next key level. We haven't retested the break of the bottom part of the wedge yet, so there's a good chance that's happening this week. I'm trading this to the next daily SR. Just gonna ride with the market to see will it respect this bearish trend it's still on.
BEAR TPS:
• 1.09886
• 1.09458
BULL TPS:
• 1.10687
• 1.11050
• 1.11453
• 1.11783
One Last Up Before A Huge Drop DownThis is a bearish flag with multiple confirmations that price is a wee bit too high and got to come down according to the higher timeframes. So I am patiently waiting for its cue.
As you can see, this is the current wedge price is in. I would look for it to try 1578.92 for one more uptick before taking the nosedive south. So I will only have two TPs in place for the bull. I am waiting for it to make a return to the monthly SR 1537.30 to make another attempt for the short.
BULL TPS:
• 1578.92
• 1595.99
BEAR TPS:
• 1563.75
• 1550.55
• 1540.49

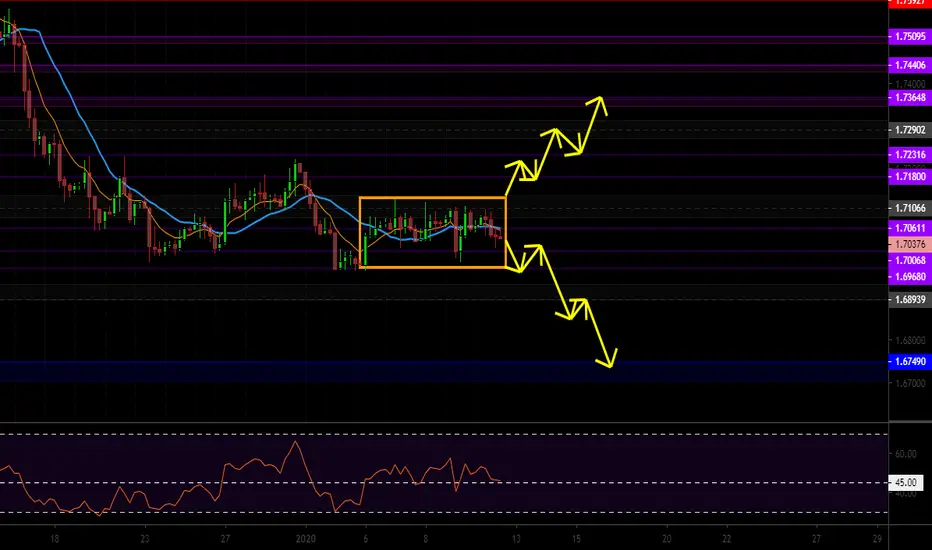
Bullish Flag Almost Complete This is a flag formation that's not complete yet. I decided to check the lower timeframes to see how price may respond to the daily level below. So far, I like the chances of it continuing to be bullish.
Of course, I have TPs in place just in case it won't pop off like I'm looking for. Whatever man. As long as I can trade from a good setup, I have no issues where the market wants to move.
Here ya go:
BULL TPS:
(from the SR level 1.71066)
• 1.71800
• 1.72316
• 1.72902
Even though I have a bigger aim, let's look at these TPs for now.
BEAR TPS:
• 1.71066
• 1.70611
• 1.70068
• 1.69680

Getting Ready to Go BullishDrew some trendlines out from the daily to see where the overall move is. And I see that price has broken the bearish trendline and may currently test that or the daily SR below before shooting back up.
Another confirmation was also formed at the 1 hour. There, a bullish harmonic has appeared where price has stopped on Friday. So we're waiting for that to complete to begin the uptick as well.
So here are the TPs from the current location:
BULL TPS:
109.923
109.658
109.921
110.287
110.889
BEAR TPS:
109.002
108.481
108.235
107.917

SPX500: Engulfing Candlestick Pattern on Daily ChartAs we can see, the SPX500 price created engulfing candlestick pattern.
We can see how the last trading day engulfed the previous one.
It indicates for reversal opportunity.
I'll look for sell position at 3318.00 zones.
The first target will be the support level below and the final target is the demand at the bottom.

GBP/USD: Key Levels for Swing TradersAs we can see, the price creates a new demand below that broke out the previous supply from left.
It indicates strong demand,
For now, it seems the price on his way to reach the supply above, and therefore, if the price retrace the demand below I'll buy there.
The final target will be the supply above.

USD/CHF: Great Continuation Level for Buy PositionHigh probability that the price tends to reach the supply above.
Below us, there is a great demand for continuation trade,
I'll buy at this demand and the final target will be the supply above.

AUD/JPY: Great Continuation LevelAs we can see in the H1 chart, the price changed the momentum to bearish.
It seems the price now tends to reach the demand below.
At the moment, the price gets really close to touching the supply above which is a great level for sell position.
I'll sell at this supply at the first touch of the price and the demand below will be the final target.

BTC/USD: Waiting for the Price at The Right LevelBTC/USD price is now between two critical levels.
There is a fresh supply above and a fresh demand below.
both are great levels for positions and both holding massively unfiled orders.
I'll sell at the supply and I'll buy at the demand.

USOIL: Two Levels for Sell PositionUSOIL price created two fresh supply levels above,
Each one of them seems like a great level for sell position.
I'll sell USOIL price at supply - 1 and set the stop loss just above this level,
If the price will hit the stop loss I'll sell again at supply - 2.
Both have great risk-reward potential.

Bull May ContinueUSDCHF has a good boost up which makes me think this is going to continue to be bullish. Awaiting the pullback to confirm. Not much to do here but go with the flow.
BULL TPS:
• 0.96964
• 0.97439
• 0.97684
• 0.98023
BEAR TPS:
• 0.96453
• 0.96023
• 0.95761

Looks Like a Pullback Due For ContinuationNot much to look at with this pair. Still has the legs to keep moving up. Looks overbought on the RSI, so could do a pullback before continuing, or make a run for the short.
So, with this pair waiting on a pullback to confirm the continuation or reversal.
BULL TPS:
• 110.784
• 111.164
• 112.193
BEAR TPS:
• 109.776
• 109.127
• 108.420

Trend Trade With A Pullback DueThis pair has been on a downward trend. I am actually curious to see can it make the monthly or not.
A pullback should appear before it continues further down. It's pretty much near rock bottom of the charts. So I'm looking for pullbacks and reversals for this pair.
For the time being, trading with the trend is key for this pair until it shows otherwise.
BEAR TPS:
• 1.06861
• 106284
BULL TPS:
• 1.07600
• 1.07808
• 1.08210

CHF/JPY: A Great Level to Join The DowntrendAfter the recent uptrend which we can see on the left side of the chart, the price has changed to a downtrend.
Above us, there is a great fresh supply that seems like a great level to sell CHF/JPY.
I'll sell at this level and the final target will be the support below.

GBP/USD: Intrady Key LevelsAs we can see on the M15 chart, the price gets close to reaching the demand below.
This demand seems like a fresh one and a great level for intraday buy position.
I'll buy at this demand and the target for this position will be the supply at the top.
This supply is also a great level for sell position, we can see how fast and strong the price dropped from that level.
I'll sell at this supply if the price reaches there.

SPX-500: Waiting for reversal daytrade signalIn the H1 chart, we can see that the price is in a very strong bullish momentum,
Since the price is in records I preferred to wait for a reversal opportunity.
If the price will break down the confirmation zone it will be the signal for the reversal opportunity.
If that happened I'll look for a price action setup to sell SPX500 as an intraday trade.
The first target will demand level - 1 and the final target will be demand level - 2.

Drop Could've Been a Big Pullback For The Bull Looks like it's bouncing off the daily to continue bullish. But do not be surprised if we revisit the trendline or go underneath it a bit.
The large drop may give it a reason to test more bearish waters. Not much to say on this one. A trendline break will signal the bearish continuation if there is one.
BULL TPS:
• 144.356
• 144.844
• 145.638
• 146.961
BEAR TPS:
• 142.321
• 141.469
• 140.757
• 140.225

Bull Still StrongCADJPY is in the middle of a strong bull run so we're just gonna follow the trend until it shows signs that it's turning around or committing a pullback.
BULL TPS:
• 84.088
• 84.407
• 84.818
• 84.889
BEAR TPS:
• 83.598
• 83.320
• 82.895

Price Action Says Short, But War Can Say BullGold is extremely overbought on both the monthly and the weekly. So this should still ride overall as a short.
The conflict with Iran can still greatly affect the USD, so whatever happens, this week news-wise can still make it bullish against price action.
But technical analysis still screaming this is a big big short. Let's see.
BEAR TPS:
• 1550.55
• 1537.30
• 1527.05
• 1515.56
• 1503.63
• 1489.61
BULL TPS:
• 1571.51
• 1584.37
• 1595.62
• 1610.72

In a Range Awaiting BreakoutWe are in a range according to the 4hr.
According to the monthly and weekly, We are in the middle of a bear run. This range is several days long so far, so we are waiting for a breakout trade for this one to be active.
Don't know when that will happen. So you can range trade until it breakout, or you can wait until it's free. Your choice.
BEAR TPS:
• 1.70068
• 1.69680
• 1.69298
• 1.68939
• 1.67490
BULL TPS:
• 1.71354
• 1.71800
• 1.72316
• 1.72902
Strong Doji on Weekly Can Possibly Signal The Bull MoveAUDCAD looking like a buffet with that super-strong doji on the weekly. The strong bearish move was unphased last week and barely made a juke at all. It did a rejection at the daily and it looks to be forming a pullback on the 4hr.
The weekly shows a large rejection like the downward move has come to a screeching halt. But one way to know for sure is to see how the market plays out. Trade well this week. This may be the one I keep an eye on this week.
BULL TPS:
• 0.90314
• 0.90955
• 0.91256
BEAR TPS
• 0.89873
• 0.89467
• 0.89025

Price Just Reach Supply LevelAs we can see on the W1 chart, the price just reaches into a great supply level.
This supply seems like a great level to look for a sell position.
The target for this position will be the demand below which also a great level for buy position.
