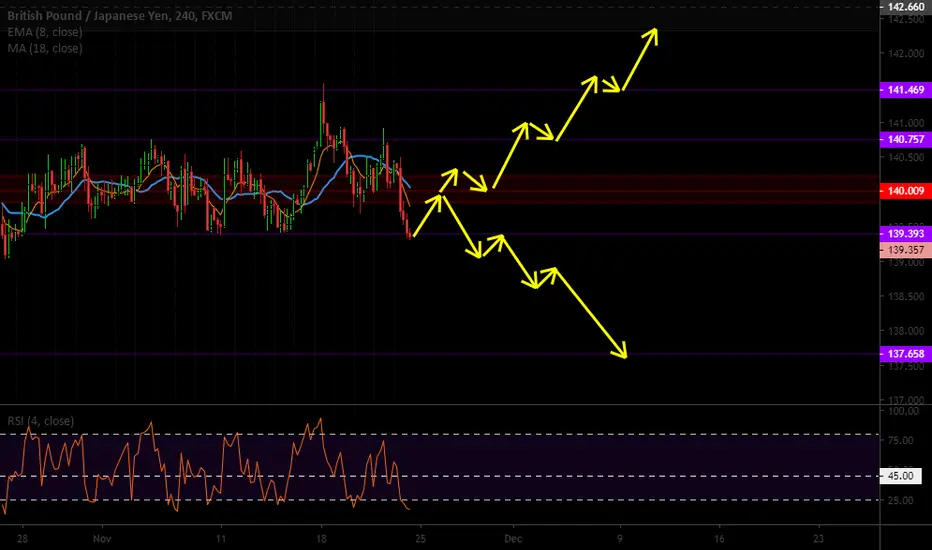
Reworked Analysis For Range BreakoutReworked the previous analysis that's still active for this pair. Price has been ranging for a very long time so looking for a ginormous breakout to come out of this. So I now have target TPs in both directions. Right now, I hope this will wake up soon.
BULL TPS:
• 140.009
• 140.713
• 141.469
• 142.320
BEAR TPS:
• 139.090
• 138.609
• 137.658
Keylevels
BTC/USD – Key Levels for Swing/Long Terms PositionsThe price is still bearish.
In the H4 chart, we can see the significant demand below which is a great level for long term buy position.
The target for this buy position will be 10.000 zones.
In the H1 chart, we can see a fresh supply above, as long as the price didn't touch the demand below I'll sell at the supply.
The target for this sell position will be the demand below.

AUD/CHF - Sell Opportunity for Intraday TradersAs we can see the AUDCHF price has formed a fresh supply above.
This supply is a great level to sell position as a daytrade position.
if we look at the H1 chart we can see that if the price will react to the supply it will complete a bearish Head & Shoulders.
The target will be the support below.

Key Levels for Daytrading positionsIn the long terms like H4 chart, the price reaches a supply zone,
In the 15M chart, we can see above the supply which is a great level for intraday sell position.
Below, we can see the demand level which can be the target for the sell position and also a great level for intraday buy position.

Sell Opportunity For Short Term PositionAs we can see on H1 chart, it seems the price on its way to reaching the supply above,
This fresh supply is a great one for sell position as a short term trade.
The support below will be the target.

Potential Bullish ContinuationThe consolidation was a pain, but now it looks like at a potential double bottom is forming after the drop.
Wanna see how far we'll go up if that's the direction as a continuation, or if we'll get to the trendline below and break/support it.
BULL TPS:
• 0.90242
• 0.90955
• 0.91256
BEAR TPS:
• 0.89641
• 0.89467
• 0.89025

Next Move Determined By Daily Key LevelWe are currently near two key levels: a daily and a weekly underneath. Waiting to see if price will breakthrough daily SR level and head to the weekly.
What it does at the weekly if it can get there, will determine if we will have a strong bullish or bearish move.
Here are the TPs for now:
BEAR TPS:
• 1460.33
• 1455.75
• 1442.25
• 1438.31
• More TPs if it can break the weekly SR level.
BULL TPS:
From the daily key level at 1460.33
• 1474.91
• 1486.85
• 1503.63

Will Harmonic Still Be Respected?Some good moves happened with CADJPY, so going over this a little more.
Right now, we wanna see if this bullish harmonic will remain respected all the way to the monthly at least.
Or, now that price has gotten to the mid-level of the harmonic, will it turnaround and continue to the trendline where a daily level resides.
As you can see, a trendline sits there in the waiting. If it can break that trendline, that'll be a nice dropdown. If it bounces off, the bull rally continues.
BEAR TPS:
• 82.239
• 81.905
• 81.638
• 81.464
• New tps announced if the trendline and daily SR level are broken.
BULL TPS:
• 82.719
• 83.230
• 83.598

SPX500 – MACD Divergence Indicates for Reversal Opportunity soonThe SPX500 has reached a new record last week.
The price has a significant divergence with the MACD indicator which indicates for a reversal opportunity.
If the price will breakout the support below it will be the right signal to look for a price action setup to sell the SPX500 index.
The demand at the bottom will be the target for this position.

GBP/JPY – Waiting For The Price to Breakout The Symmetrical TriaAs we can see in the D1 chart the price creating a symmetric triangle pattern.
If the price will breakout toward down it indicates the price tends to reach the demand below and I'll look to sell.
If the price will break toward up I'll look to buy GBP/JPY.

Fresh Supply for Sell PositionThe supply above is a critical level since it's the one that changed the recent bullish momentum to bearish.
It indicates a strong supply and therefore I'll sell at this supply on the first touch of the price.
The target will be the demand below.

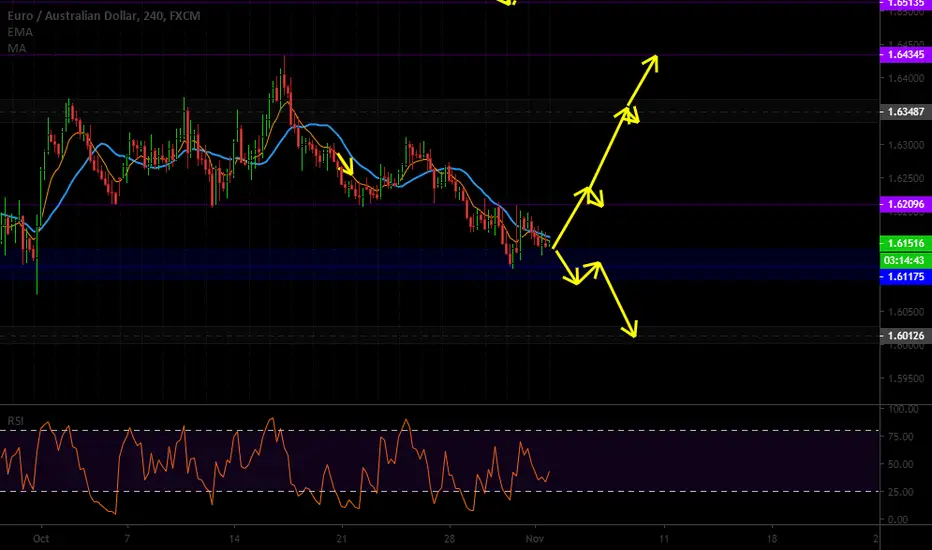
Possible Bullish MoveGoing bullish.
Sitting on a weekly SR and is already showing signs it's leaving the oversold areas on the RSI on the daily.
I'm going to the daily SR at 1.63487 until something changes its direction.
BULL TPS:
• 1.62096
• 1.63487
• 1.64345
BEAR TPS:
• 1.61175
• 1.60126
Multi-Day Consolidation Means Big Breakout SoonBIG MOVE COMING!
We have a several day consolidation sitting on a monthly SR with GJ.
This move is gonna be JUICY JUICY JUICY when it takes off.
I'm not looking for the pull rally to stop this month.
If we see a downtrend, it will only be a pullback for a few days before the big impulse move back up.
I'm patient with this one.
GJ has been fun since September.
BULL TPS:
• 142.469
• 142.660
• 144.775
• 147.177
BEAR TPS:
• 137.658
• 135.674
If it goes further than this, I'll add new TPS.

Gold Will Be A Little More Tricky With It's DirectionGold will still be a tricky little sucker this week.
With a large bullish doji made last week, it could signal a strong bullish move happening this week for gold.
Want to see if gold will do a temporary pullback then shoot straight up to my monthly SR to see can it breakthrough.
But, as you notice with my analysis, I'm thinking a rejection is likely once it gets there.
We'll find out this week.
BULL TPS:
• 1527.56
• 1537.30
• 1550.55 (if can breakthrough the monthly SR)
BEAR TPS:
From the monthly SR 1537.30
• 1527.05
• 1515.56
• 1503.63
• 1492.65

Possible Retracement Then ContinuationWell, this pair was an interesting one. It kept going up and didn't stop until it all the BULL TPs last week.
So I am looking for a bit of a retracement some more and then another try at the monthly SR level to see if it can breakthrough.
BULL TPS:
Starting from 0.90314
• 0.90531
• 0.90950
• 0.91285
• 0.91494
• 0.92004
BEAR TPS:
From the current position
• 0.90626
• 0.90312
• 0.89966
• 0.89485 (this one is a long shot)

Trading Head & Shoulders One Step before The Pattern CompleteOn the H1 chart for Gold, we can see the price creates an incomplete Head & Shoulders pattern.
Below, there is great demand for buy position, I'll buy at this demand and if this demand will react and the
Price turns up from there, it will complete the entire pattern.

Retracement ComingThis pair here hit most of its bull tps last week.
Bought we are now heading into the overbought area and bullish harmonics are forming on other JPY pairs.
We should see a retracement of the bull rally before continuing further up.
BEAR TPS:
• 82.230
• 82.753
• 82.239
• 81.895
BULL TPS:
• 83.992
• 84.405
• 84.889

Bearish Harmonic FormedSo we have a bullish harmonic that formed sometime last week and it hasn't fully taken off yet.
It should get a jolt with the Tuesday and Wednesday trade session to see whether or not it will be respected.
Because this harmonic is seen from the daily, this move could last awhile.
Here is the TPS ready no matter where it goes.
BEAR TPS:
• 120.568
• 120.238
• 119.119
BULL TPS:
• 120.937
• 121.389
• 122.208

May Reverse Soon For The AUDTotal respect of the downward trajectory since last week. With AUD news coming in a few hours and again tomorrow, this short may last to the weekly SR at 0.88245 -- if it makes it there.
Will keep the bull tps in place for now. I'll just add a few tps for the reverse just in case the news is in AUD favor.
BULL TPS:
• 0.84372
• 0.89801
• 0.89956
• 0.90242
BEAR TPS:
• 0.88893
• 0.88352

BTC/USD - Critical Levels to Look For Sell PositionBTC/USD price is in bearish momentum.
The current support is holding the price for the last three weeks.
If the price will break this support I'll look for a price action setup for sell position.
If the price will move up to the supply above I'll sell there at the first touch.

Bullish Channel Moves May Continue But Getting ShakyWe've been in a bullish channel for a good hot minute.
From the 4hour chart, it looks like we'll remain in the channel.
But there are signs that this move is starting to get a little shaky on the daily and weekly chart.
So gonna keep an eye on this pair to see when the big drop is gonna happen.
Otherwise, my swing trade outlook goes to the monthly SR level at the moment -- as long as we continue to stay in the channel.
BULL TPS:
1.63487
1.64018
1.65135
1.66041
BEAR TPS:
If we break out of the channel...
1.62096
1.61175
1.60126

GBP/USD - Looking For Reversal SignalGBP/USD price is after a nice rally,
as we can see there is a CCI divergence which indicates a possibility of reversal opportunity coming soon.
The support zone below is the confirmation zone, if the price will breakout this support I'll look for price action for sell position.
The target will be the demand below.

GBP/USD - What Will be The Signal For Reversal Opportunity.GBP/USD is in amazing rally for the last 10 days,
For now, I prefer to look for a reversal signal.
If the price will breakout the support below it will be the signal for changing momentum to bearish,
In that case, I'll look for a price action setup to sell GBP/USD.
In addition, there is a significant MACD divergence which indicates the buyers running out of power.
The target for the sell position will be the demand at the bottom.
