Wait To See if The Price Will Break the Support BelowBreaking out this support Will indicates the price On its way to the demand below.
If that happens I'll look for price action setup for intraday sell position.
Keylevels

Continuation Level For Buy positionPrice moves down toward demand level which seems like great level for buy trade
The target will be 10.800 zones

Fresh Demand For Continuation Buy PositionAUD/USD is bullish at the moment,
It seems the price tends to reach 0.6850 zones which is the next fresh supply.
A few hours ago the price performed a new fresh demand.
I'll use this demand as a continuation level for buy position.
Meanwhile, we can see how the price compressed toward this demand.
when a price compressed toward demand it's a great setup to buy.

Bull Run?The bulls seem to be in control at the moment. Remember don't manipulate yourself out of the money, keep it simple.

Two Fresh Supply Levels for Sell Position as a Continuation For the long terms, as we can see on the W1 chart on the left side of the chart, the USD/JPY tends to reach the demand at the bottom.
On the H1 chart, we can see how the price creates 2 fresh supply levels above.
Each one of the supply is a potential level for continuation sell trade.
I'll sell at the supply above and the stop loss will be few pips above this level,
If the price will break the supply and hit the stop loss order, it indicates the price on his way to reach the supply level 2.
In that case, we can look for a price action setup for intraday buy position and the final target for this buy position will be the supply level 2 at the top.
Supply level 2 is the next level where i'll try to sell again as a long term position,
The target for this position will be 102.50 zones.

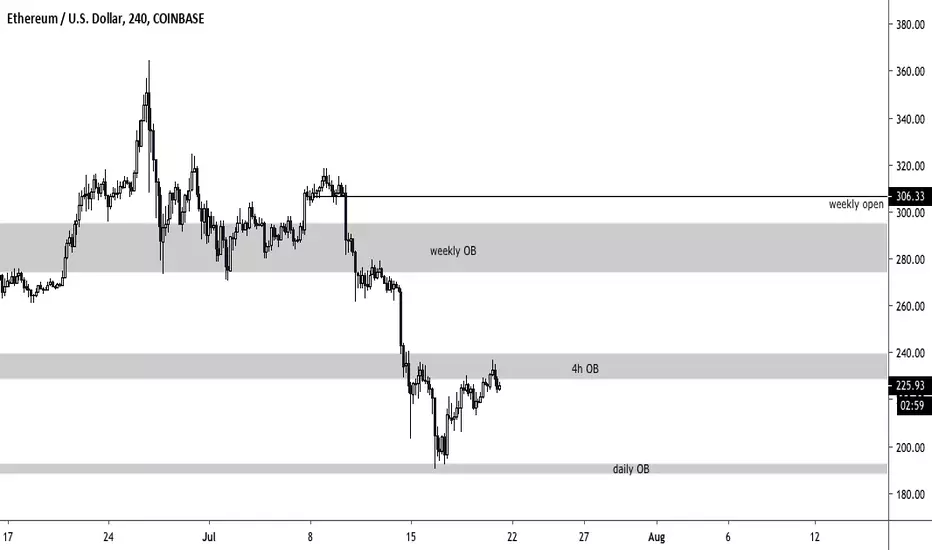
ETHUSD Coinbase Price Action with OrderblocksGoing sideways at the moment, either we retest the daily OB or make it above the 4h OB, waiting on the sidelines until I get a clear trading setup
Bitcoin Price Action July 21 LONGCleaned it up a little, new 4h OB was perfectly hit with last 4h high, well see how it reactes next time and decide then.

Bitcoin Price Action July 19th 2019I'm trading without indicators solely based on price action with OBs and key levels. Caught the perfect entry for this one here, let's see what happens at monthly opening.

7:1 Risk Reward Short To Major SupportYeah, so the chart most likely tells more than words. But, anyway, the last week closed as a bearish engulfing on a daily chart, and I expect this to be just a retest.
From swing high to swing low drawn fib retracement shows that the price is sitting on a 61.8 % fib, which gives us an excellent risk to reward to this trade as the stop loss is just slightly above it. Major support is most likely to be tested before the pair decides which way it will continue going.

Potential trade setup: EUR/GBP analysisPrice has tapped the 76.8% retracement line on a bigger time frame at the 0.89400 with last week candle closing as a spinning top hinting that there could be a reversal due to a slowdown in momentum of buyers however with this week candle looking like it could close as a bullish candle what would confirm a reversal is if this daily candle closes below 0.89302, what would invalidate this entry is if weekly candle closes above previous high to confirm further upward momentum.

Big Impulse Is Signaling Retracement Coming SoonSince I've been gone, gold decided to shoot for the moon. However, there looks like there was no pullback of any kind since its take off. The stutter step it did last week could be signaling the retracement is about to begin. So let's see how far will gold move for a big retest or something more.
BEAR TPS:
1337.50
1326.14
1319.26
1311.11
I have to wait a little longer to determine the BULL TPs fully. For now, I'll begin these TPs at 1326.14 and post new ones if it breaks that daily SR level:
BULL TPS:
1335.26
1342.28
1357.17
Will continue to update this one more as the week continues. For now, I'm looking for the tumble down.

GBPAUD SELL TARGET 1.8000 (HEAR COME THE BEARS PART 2)-SELL OFF DUE IF WE CAN STAY UNDER WEEKLY RESISTANCE
- DONT FIGHT ANY CONSOLIDATION BATTLES AWAIT GOOD CONFIRMATION


XAUUSD Ideas - Key Levels
Probably to continue the down trend! (1D)
Zone 1:
- Restest, Sell TP 1269
- Breakout, Buy TP 1285
Zone 2:
- Restest, Sell TP 1277
- Brekout, Buy 1295

Continuation to The DownsideOverall move is still bearish.
But what we're looking at right here with this mini trendline is confirmation of a continuation to the downside. I only see two possible areas where it can still bounce up before rolling back down as a swing trade.
I looks like a possible double bottom formation could happen to create the bottom of a bearish harmonic, then continue the short. Or it can shoot back up close to the overall trendline before returning down.
And YES, I do believe we are going to see a return to the weekly level for my max TP.
BULL TPS:
0.94094
If breaks through...
0.95180 for bearish harmonic
0.95521 to prepare for next drop
BEAR TPS:
Based from current trendline at price...
0.94527
0.94227
0.93688
From the possible harmonic...
0.94904

Continuation for the ShortMy harmonic was too small apparently for last week's markup because it created a bigger one off the weekly for a 140+ drop. So marked it up for this week analysis.
The bearish trendline is major respected thanks to the long wick rejection from the 1.51498 area.
Price even broke through a solid support level at 1.50138 to confirm we are in a downtrend.
Looking for a pullback to 1.50138 or monthly zone in red before continuing further down.
BEAR TPS:
1.49906
1.49292
If breaks though weekly...
1.48805

Direction Depends on Respect or Reject of CountertrendlineThis was a slow moving pair for the last couple of weeks. It got a mini jolt late last week, so let's see will it continue further down, or just find the strength to keep on climbing.
Looking for multiple tests on the counter trendline to see if the price will breakout for the return to the weekly, or respect it and keep tumbling down to the daily level and bottom of the wedge below.
BULL TPS:
111.834
112.125
If price breaks out of top overall trendline...
112.564
112.938
BEAR TPS:
111.055
If breaks out of bottom overall trendline
110.703
110.273


Short GBPUSD broke 1.3029GBPUSD broke the key level 1.3029 and is currently entering a downtrend movement, using the Trend ribbon we were able to find the reverse point.
- SL placed over earlier resistance

Continuation off Bullish HarmonicThis one depends on if price will support or breakthrough monthly support/resistance and trendline to determine clear direction.
Would like to see the harmonic fully respected all the way to 1.502034.
If monthly SR and trendline broken, looking for a target tp around 1.492892.
BULL TPS:
From the monthly SR area...
1.50823
1.51084
1.51332
1.51498
target tp 1.52034
BEAR TPS:
If the monthly SR and trendline is broken through...
1.49906
1.49292

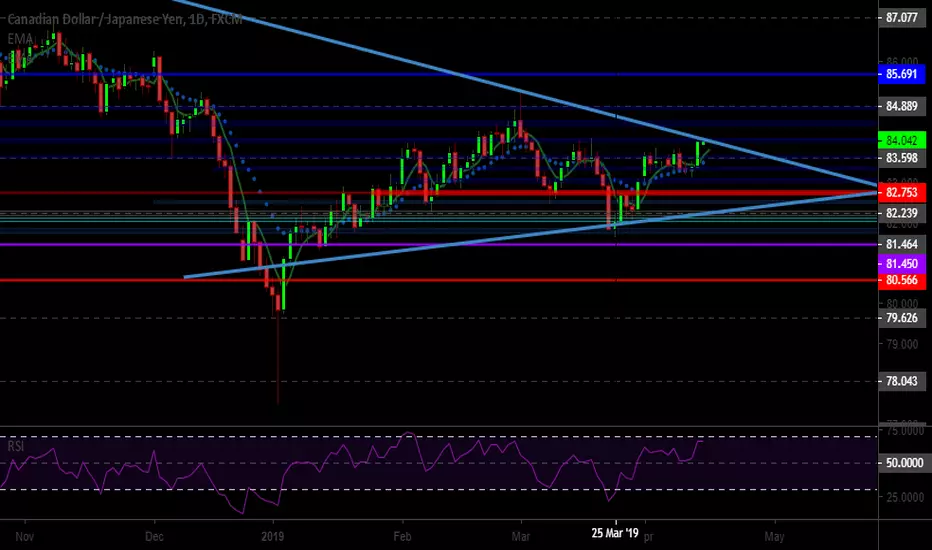
May Dance in Wedge If Doesn't BreakoutWedge formation can be seen on weekly and daily. Not full enough for the breakout yet, but have to wait and see what price does for now. In the meantime, the wedge may not even be broken this week. Currently, waiting for breakout or rejection of overall trendline.
BEAR TPS:
If overall trendline respected...
83.598
83.383
83.078
82.753
Must break trendline to reach these TPs...
BULL TPS:
84.405
84.889
85.691
Breakout of Wedge Coming SoonCurrently, price has the option of supporting or breaking through the counter trendline to determine which daily SR level it will go to. The overall move on the chart is bearish, but do not know how much longer this flag will go.
BEAR TPS/b]
0.74605
0.74422 if the counter TR is broken
0.74220
0.73982
BULL TPS:
0.74932
0.75180
0.75267

Pullback Coming for Continuation UpSince in a 4hr resistance zone, Awaiting the pullback sine price got exhausted around this area last week. Then a continuation back up around mid-week.
BEAR TPS:
111.498
111.055
BULL TPS:
All dependent on where price turns around
target TP:0112.125
112.054
111.732
111.393
