NZDCAD SHORT ORDER IMMINENT! 0.91800Good evening from the UK. Its been a while since I've posted a trade on NZDCAD. Reason being the price was moving sideways for a considerable amount of time. 0.9100 was acting as a Physiological key level which was rejected a break above for around 2 months. the previous restiance has beeb broken and is now acting as a support barrier for the pair.
We have now spiralled into a uptrend channel. creating good swings higher highs and high lows. before a touch of my trendily to the upside for a first touch i have some major barrier in the way. The blue Horizontal line at 0.9250 is a monthly key level which should hold price up in the short term. The week closure for NZDCAD was very bullish therefore the bulls may not be finishing yet however I do see price pushing a few pips higher and being "overbought and retrace a good 80 pips minimum before any upside momentum.
Guys after 1 week of good research and understanding I've done a lot of back testing and implemented the RSI indicator into my trading. Im not going to tell you its main functions thats for you to find out. You finding out will be beneficial for your trading growth and development if new to the market. RSI indicator signals a sense of the pair being exhausted, oversold and expecting a correcting to the downside.
Lets see how this goes. Have a great week of trading.
Keylevels

BTC KEY LEVELS ; FIB AND PSICOLOGICAL , DAILYDONT RECOMMEND ANY POSITION TILL WE BREAL 4.200 FOR GOING EVEN TO 6K, IF NOT WE CAN GO EVEN LOWER THAN THE LAST TIME FOR THE NEW LOWER HIGH. NO VOLUME ALSO SO MAY SELL

Butterfly Bajista y Key Levels GBPAUD VentasVámonos a ventas, tenemos Patrón Armónico Butterfly Bajista al primer TP de 0.382 del Fibonacci, Key Levels de Monthly a Daily y Línea de Tendencia esperando el Profit, iremos dando seguimiento. Felices Pips! =)
#TradingChangeTheWorld

Waiting for News to Determine Price DirectionUSDJPY is in a multi-day range, which means that the breakout will last for several days as well. All JPY pairs have been bullish for a moment. Bouncing against trendline several times, so a breakout is due this week. But which direction? News for USD will move this chart fully beginning Tuesday's New York session. So not trading this until Tuesday morning. (I'm really hoping for a sell)
Possible Tps if a sell:
110.366
110.087
109.809
109.489
Possible Tps if a buy:
110.964
111.324
111.947
112.125

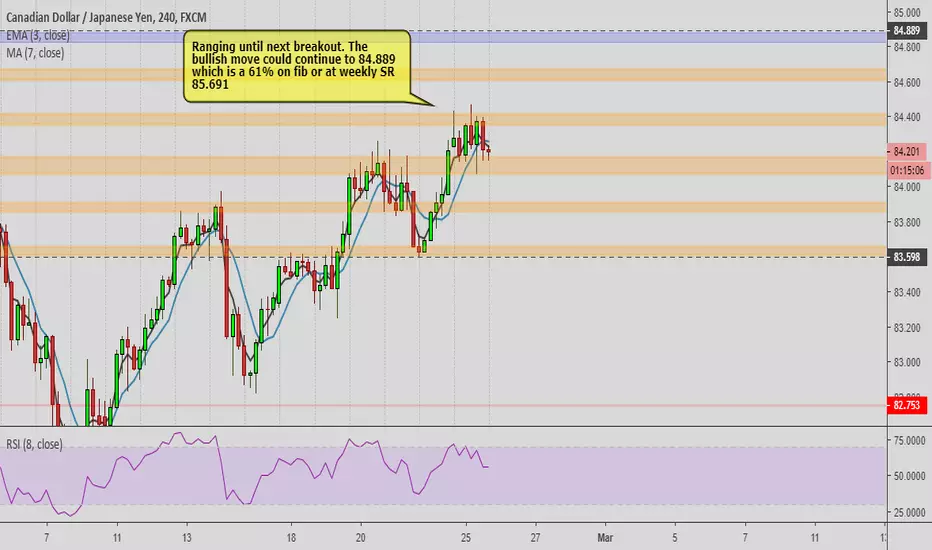
Waiting Next Breakout Stage CADJPY has not been shy with its bullish direction. Currently, the price is ranging until it creates the next breakout move. 61.8% fib (now removed) is near 84.889 daily SR level. So waiting to see what price will do if it can reach there, or the weekly SR at 85.691.
For now:
BULL TPs:
84.345
84.589
max tp 85.691
BEAR TPs:
83.907
83.669
Short Term Key Levels For USDJPY 19/02/2019For the day traders among us, I marked the next critical key levels to look for short term positions, The supply above is a great fresh supply for sell position, I'll sell at this supply at the moment the price hit there, and the demand below is a great level for buy position, I'll buy there also at the first touch of the Price. both levels are relevant for a day trade position,

MAJOR GOLD SELL OPPORTUNITY?? Just a beginner stepping his foot into the forex world. I marked up the charts and wanted to add my 2 cents in on the idea gold has a strong uptrend line of support & resistance thinking it will hit its peak sometime tomorrow or next week tuesday due to the holiday. Correct me if im wrong or add you're 2 cents in ! Thanks guys, may the pips be with you. Happy trading!

EURJPY LONG ACTIVE TO 126.000Posted this set up last week, however due to technical factors not aligning the trade set-up was cancelled. Following Friday's bullish engulfing closure breaking out of the range-play, Euro now looks set to advance into the 126.000 weekly key region.

Bull market - what bull market?In the screencast I show hard evidence from the chart refuting media reports which say that a bull market on Wall Street is back. This evidence is available to everybody.
There has been a bull rebellion over the lat 4 weeks but that doesn't mean that this is a bull market - at all!
If you're a forex trader or stock trader this is important. Why because what happens on Wall street affects currencies and stocks all over the world.
I am clear that I do not recommend trading a weekly time frame to most people. The situation on the weekly is relevant to most of us who trade on much lower time frames. So yes - I'm shorting on lower time frames (which is not a recommendation to others).

GBP/AUDGBP/AUD Long - retest of 1.79500 to make higher high, hourly bullish engulfing close, and 4hr pin bar. Buy limit lower than key level due to possible market manipulation, if not hit then who cares, there are a ton of opportunities coming!

NZDUSD H4 - Bullish continuation trade...At 6am we witnessed a bullish breakout candle breaking past the 0.67572 resistance zone. Before price continues in a bullish continuation trend, there will be a retest of this key level along with the 50% Fib level.
Price should retrace from this level and continue heading up. We have two targets in place:
Target 1 is placed at 0.67876
Target 2 is placed at 0.67977
Happy Trading
- Juff

WALL STREET: Key levels and outlook for the next few weeks.I overview what are some of the possibilities and probabilities over the next few weeks for Wall Street. I compare again the current situation with that of around 2008.
Preliminary action on small time frames on Weekend Wall Street, do not look exciting for a trip north on Monday. We shall have to wait and see, as Mr Trump often says.
I do not know what's going to happen. Nothing here is a prediction.
Nothing that happened in 2008 rules what may happen the near future.

Head & Shoulders 4H Chart USDCAD 03/12/2018As we can see on the 4H chart, there is a potential that the price will create a Head & Shoulders pattern, If my prediction that I marked on the chart will come true, we will see the Head & Shoulders pattern up there, the reason I'll sell at the supply above is not the pattern, I'll sell at this supply because it's a level with unfilled orders waiting there for the price To come back, Also, this supply has changed the bullish momentum to bearish, this supply created after this week starts with a GAP at the price, I'll sell high and buy low, meaning, I'll sell at the supply and my target will be the demand below.

Short Term Key Levels For GBPUSD 29/11/2018As a price action forex trader, I trade only Supply&Demand, sell at supply and buy at demand, I marked those supply&demand key levels as a short-term opportunity, the demand below is a great level of buy position and the target for this trade will be the supply above, and the opposite, the supply above is a great level of sell position and the target will be the demand below, I'll act only at the level that the price will reach first,

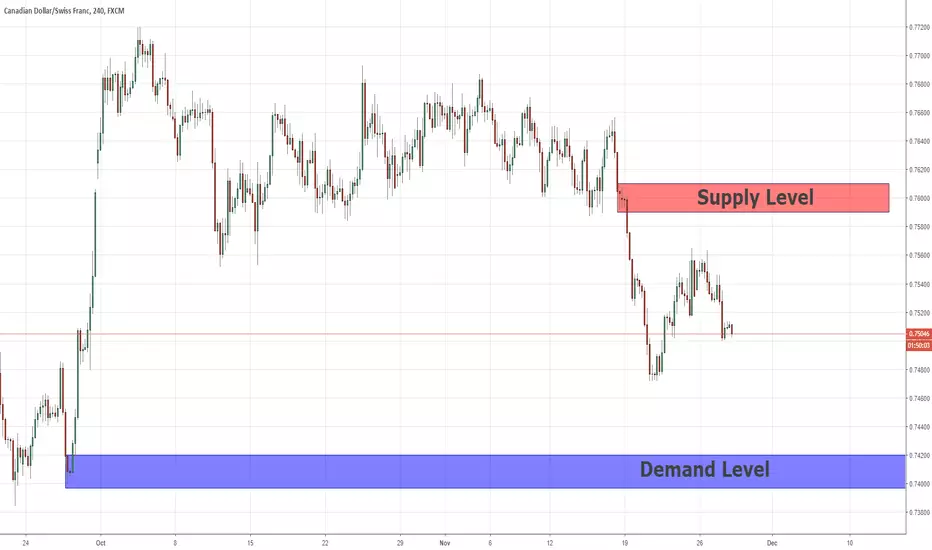
Analysis By Price Action For CADCHF 28/11/18CADCHF – the CADCHF is on bearish momentum at the moment, and seems he will stay bearish until the price reaches the demand below, the supply above us seems like a great Continuation level for sell position, i’ll wait for the price to sell there and my target will be the demand below which is also a good level for buy position,
EURAUD - LONG TERM SELL - MUST SELLTo retrace to the 0.786 level of fibonacci would mean for price to get all the way up to 1.59949.
4/25/18 (1.61409) on the Daily timeframe, shooting star candle which lead to a massive drop (~860 pips) til around 6/4/18 (1.52747 top of a key zone.)
Historically, this trend repeats itself from the ~1.61409 level very well. From 8/24/15 to 2/11/16 about 5 significant drops occurred resulting in a drop of about 300 pips at a minimum.
9/29/15 rice was at 1.62505. VERY close to the aforementioned high of 1.61409. From that time until 12/3/15 there was a ~1900 pip drop and price went to a low of 1.43479.
Price has consolidated the last 5 hours ranging from around 1.59336 to 1.59023.
I am looking to see if price will reach 1.61409 - 1.60008 for a really nice long term sell.
If price does not reach that level and shows a lot of bearish signs and signals.. I plan to sell it around 1.58895.
My take profit aligns perfectly with the 1.272 level of the fibonacci extension which is 1.50337. I plan to take profit at 1.50657. I will look for a sooner place to take profit and update as I analyze.
Happy trading everyone, let’s milk this bitch!

Daily key levels to watch for Bitcoin price (in €)Here are the major key levels to watch for the price of the Bitcoin in Euro.

BTC getting out of this correction? Here is a RoadmapRoadmap to get us out of this correction (ideal setup) & Next key pricelevels to watch.
If we hold 7040$ (preferably, or else 6425$) the bullish wave count is still in place.
Sure you could argue the retracement from 9990$ was bigger than anticipated but the bullish count has not been jeopardized as of yet.
Last update I said we might see a bounce from the 0,5 retracement level 8200$, which it did (up to 8884$) but it couldn't held that level soon after.
Next major resistances @8644$ -> 8884$
Next major supports @7040$ -> 6425$

Key levels to watch if trend keeps going downHere are the key levels to watch (the black horizontal lines).

Updated Bitcoin Roadmap 23-4 [Elliot Wave & Key levels]Bulls still accumulating? Bears are trying hard with little result so far.
RSI is cooling down for another leg up (as long as this ascending triangle keeps intact).
Feedback always welcome. Have a good day!

GOLD SPOT IN A GOOD POSITION FOR A LONGThe position was taken because of the following aspects:
The trend is bullish, and we were waiting for a retest in the $1348 zone so we can take a quick long to a very important level found in $1365.
Besides, the upside trendline hasn't been broken so it is another confirmation for us to take that long trade. Furthermore the fibonacci tool has a previous retest in 50% and 38%.
Our target zone: $1365.00
Our Stop Loss: $1339.30
R/R: 1.75

Bitcoin Bullish Elliot Wave Count [Key levels & Roadmap]First published chart. Still learning.
Chart should be self explanatory. Feedback always welcome :)

BTCUSD: Bears Persist At Short Squeeze Levels?BTCUSD: Price pushes off of 7605, touches 8604 in a matter of hours, BUT it did not close strong. This price action is apparent across the board and for me means ones thing: bulls are not in control, yet. The next scenario that I am anticipating is a failed low formation which needs to unfold above 7401 if buyers are to return and initiate the next bullish leg.
All eyes are on this market. ETH and LTC are pretty much following this lead. Buying activity appeared at a very attractive support area BUT like I wrote about in my previous report, strong closes are required in order to prove that there is follow through. When indecisive or weak closes appear instead, that means the bearish momentum is still intact. That also means lower prices are a much higher probability.
The question is, how much lower? That is where the current location and price structure come into play. Price is now within the 8171 to 7239 minor support zone (.618 of recent bullish swing) which is also overlapping the broad 8174 to 4983 major support area (.618 area of entire bullish structure). I have been writing about this overlapping support area for weeks. Trading within a support area is an important piece of information to know, but not necessarily enough to buy into.
Within the minor support zone, there are two reversal zone boundaries that are important to note. Reversal zones are areas that are proportionate to a low or high point where price is most likely to reverse. If a fake out is going to happen, that is most often where it happens. In this case. 7776 and 7401 which overlap the 8171 to 7239 support zone are the lower boundaries of two reversal zones relative to the 8342 and 7665 lows respectively. That is why even though price is still controlled by bearish momentum, it still has a chance to reverse.
Right now in order to prove that bullish momentum is returning, price needs to reverse from where it is and break above 8200. Until that happens, this market is likely to continue lower, even beyond the reversal zones as long as momentum stays bearish. That is why it is more conservative to bet on the proof of the reversal (follow through) than a reversal attempt (pin bar alone).
In summary, if you took the recent pin bar long (there was a great signal posted on other site), it hit its short term target within the same day, but if you held onto it looking for a broader move higher, the fact that the next close after the pin bar was not strong was a clear sign that you should either get out, or sit on what you have and see if the failed low scenario plays out (which is much more risky). It all depends on what your goal is: short term or long term. I am still managing a position trade long, and holding for the next broad move higher. IF the reversal zones do not hold up, it means I will have to take more pain which I am willing to do. I have the long term perspective and recognize that these low prices in general are a buying opportunity. As long as the original premise and underlying technology maintain their relevance, these persistent sell offs offer better prices to buy.
Questions and comments welcome and see explanation of the recent trade on SC.
