BTCUSDT is testing the key level!Bitcoin reached The supply zone as I mentioned in my previous idea. Clear breakout with volume from the Channel and it creates a new HH and HL.
17400$ is the key level, you can see on the left the consolidation before the bearish impulse where the market creates the new low.
The market printed an Engulfing on the 4h timeframe after a shooting star candle.
These candles are reverse candles, for that reason, we could see a reverse movement.
Of course, two candles are not enough to open a new short position, we are waiting for a breakout of the 17k local demand zone in order to apply our strategies.
the scenario is going to invalidate if the market prints a daily candle above 17610 structures
Keylevels
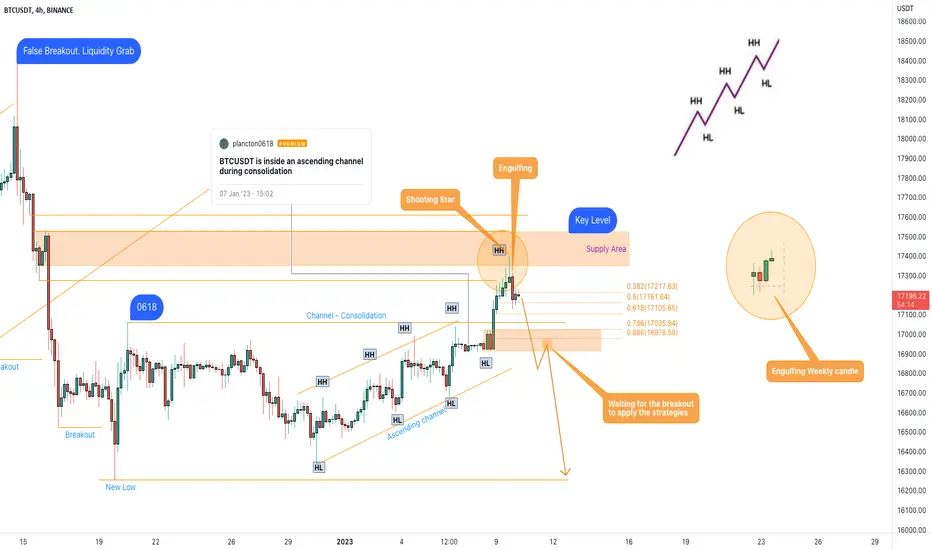
Next S/R if it keeps on going upHere are some weekly key levels to watch if the bitcoin keeps on going up.
It has just got above a weekly kijun sen (strong level).

Bullish Divergence FormingAUDNZD pairs is approaching my key levels on the higher timeframe. I am waiting for a bullish divergence that may form and my confirmation. I will update this post once I entered the trade. Follow me to be updated on this trade & more divergence ideas.

EUR-USD Local Support And Resistance Analysis!
Hello,Traders!
EUR-USD is trading in an uptrend
So our basic underlying bias is bullish
However, looking at the 1D TF we can see
That the horizontal resistance that we are seeing
On the chart above is a weekly resistance level
Which means that the soon breakout is
Somewhat unlikely therefore
We will be expecting a bearish correction
In the mid-term so these are the closest
Horizontal support levels to look at:
Horizontal Support 1= 1.06(weak)
Horizontal Support 2= 1.045
Horizontal Support 3= 1.025
Like, comment and subscribe to boost your trading!
See other ideas below too!

SILVER Technical Analysis!
Hello,Traders!
SILVER is trading in a rising wedge
And the picture resembles that one
Of the gold chart.
We've got two strong levels
Of support and resistance
That are currently limiting
The mobility of the price
But if we see a breakout
Of the wedge to the downside
I think we will see a retest
Of the support below
Analysis!
Like, comment and subscribe to boost your trading!
See other ideas below too!

✅EUR_USD SWING SHORT🔥
✅EUR_USD was growing from
Below the parity levels and has
recovered well, but now it has almost
Reached a weekly resistance level
So I am sceptical as to whether
Any further move is possible
In the near term so I think
We will see the pair ranging
From the resistance to support
And back for a while
SHORT🔥
✅Like and subscribe to never miss a new idea!✅

GOLD Key Levels! Analysis!
Hello,Traders!
GOLD has formed a narrowing
Rising wedge while retesting
A horizontal resistance 1
Which makes me somewhat
Suspicious because these
Wedges usually break
To the downside
In which case the horizontal
Support 1 will be retested
Other key levels on Gold are:
Horizontal Resistance 2 at 1870
Horizontal Support 2 at 1620
Like, comment and subscribe to boost your trading!
See other ideas below too!

✅SILVER KEY LEVELS|ANALYSIS📊
✅SILVER is trading in an uptrend
Alsong the rising support line
And is currently stuck between
The support 1 and resistance 1 levels
Once we see a breakout either way
The next key levels to retest
Will be either support 2 or resistance 2
ANALYSIS📊
✅Like and subscribe to never miss a new idea!✅

EUR-USD Key Levels! Sell!
Hello,Traders!
EUR-USD is trading in an uptrend
But a massive key horizontal level is ahead
So after the pair retests this level
I will be expecting a bearish correcton
Towards the 3 key support levels
That you can see on the chart
Sell!
Like, comment and subscribe to boost your trading!
See other ideas below too!

USOIL Key Levels! Sell!
Hello,Traders!
USOIL is trading in a downtrend
And made a pullback from the
Horizontal resistance 1
So we are bearish biased
And a retest of the support 1
Is to be expected. The final
Target of the move is
The horizontal support 2
At around 64.50 level
Sell!
Like, comment and subscribe to boost your trading!
See other ideas below too!

SILVER Key Levels Analysis!
Hello,Traders!
SIVLER is moving upwards
From the support level1 at 22.171
Towards the horizontal resistance 1 at 24.433
And I think it's highly likely we will see a retest
Of this resistance. If it gets broken
Then the next target level will be around 25.175
Let's wait for the market open and see how to goes
Analysis!
Like, comment and subscribe to boost your trading!
See other ideas below too!

✅EUR_USD KEY LEVELS ANALYSIS♨️
✅EUR_USD is trading in an uptrend
And the pair is now stuck between the
Horizontal support and resistance levels
So I believe we might see some
Back and forth between these levels
Should either be broken
Then the pair's next interacton
Will be with either support 2
Or resistance level 2
ANALYSIS♨️
✅Like and subscribe to never miss a new idea!✅

GOLD Key Levels! Analysis!
Hello,Traders!
GOLD has made a pullback
From the horizontal resistance level
Just as I predicted in my previous analysis
Now, the price is in the lymbo
Between the resistance at1810
And the nearest support level at1720
So we will be able to tell the
Potential direction of the next move
After the retest of the one of these levels
IF the current support breaks then
The next support level will be at 1620
So let's wait and see!
Like, comment and subscribe to boost your trading!
See other ideas below too!

FREE - EURUSD - Key Levels Mapped Out In this post we have mapped out all of the major key levels to watch over the coming weeks for EURUSD.
They comprise of Monthly, Yearly & Structural Major Key Levels essential for price action in EURUSD charts. For any new followers, you are able to use these key levels to guide your trading decisions and watch for how price reacts to them in order to place trades.
Monthly Key Levels:
Monthly key levels are important because they represent longer-term support and resistance levels. These levels are significant because they can provide traders with a better indication of where the market is likely to move next, and may be used as an entry or exit point for a trade. Long-term support and resistance levels can also be used to identify possible reversal areas and to set profit targets.
Structural Key Levels:
Structural key levels are important because they help traders identify potential areas of support and resistance. These areas are important because they provide insight into the underlying strength of a trend and can be used to identify potential entry and exit points. By analyzing these levels, traders can better determine when to enter or exit positions in order to maximize profits. Additionally, these levels can also be used to indicate when a trend is reversing, allowing traders to position themselves accordingly.
Summary
These are all important levels to be aware of when trading EURUSD. Being aware of these levels will help you to identify potential entry and exit points for your trades, as well as identify potential support and resistance levels. Additionally, it is important to remember that these are just a few of the key levels to watch out for, as there are many other levels that will be important to be aware of. Knowing these levels will help you to make informed trading decisions, and ultimately increase your chances of success in the market.
I encourage you to like, follow, and share to stay up-to-date with the latest news and information on this chart throughout the week.

✅EUR_USD KEY LEVELS TO WATCH🚀
✅EUR_USD has made a pullback from
A key resistance level and went down
So there is a possibility of a retest
Of the retest of the first support at 1.0228 level
And if that level gets broken then we will be watching
The area around 1.007 price mark for potential rebounds
✅Like and subscribe to never miss a new idea!✅

GOLD Technical Analysis! Buy!
Hello,Traders!
GOLD has already made a rebound
From the key horizontal support
While trading in an uptrend
So I am bullish biased
And while some local move down
Is indeed possible, I think that
We will see Gold retesting
The resistance above
Buy!
Like, comment and subscribe to boost your trading!
See other ideas below too!

EUR-USD Key Levels! Sell!
Hello,Traders!
EUR-USD is retesting a key horizontal level
Which best visible on the 1 Week TF
And is a wide supply level
So even though the pair
Might move higher from its current levels
The upward mobility of the pair
Is limited by this key level
Sell!
Like, comment and subscribe to boost your trading!
See other ideas below too!

DXY Key Levels! Buy!
Hello,Traders!
DXY collapsed today on the CPI news
Breaking all the key levels on it's way down
But the next key level is nearby
So after the retest a rebound
And a bullish correction
Are to be expected
Buy!
Like, comment and subscribe to boost your trading!
See other ideas below too!

✅GOLD TECHNICAL ANALYSIS|LONG🚀
✅GOLD is paining an interesting technical picture
But first thing first, the downtrend is over
Both the falling and horizontal resistance areas
Were decisively broken. However, the price
Went up by almost 8.5% in less than a week
Without any pullbacks so a correction is inevitable.
The price will gpo down into the supply ara below
And from there it can start growing again
With the next resistance being the 1800 level
LONG🚀
✅Like and subscribe to never miss a new idea!✅

Bitcoin levels - btc lvls for next weeks
- beware of news at the begin of next month. / see other charts (ETH,SP500)
- let me just post it here
- imo. pump before nuke.

USD-JPY What Next? Buy!
Hello,Traders!
USD-JPY rise seems to be unstoppable
As the pair has broken yet another
Key level which means that the next
Resistance level is 7.5% move away
At approximately 159.3 level
So a further move up is to be expected
In the coming months...
Unprecedented moves on the Yen this year indeed
Please, trade with caution guys
Buy!
Like, comment and subscribe to boost your trading!
See other ideas below too!

GBP-NZD Key Level Ahead! Sell!
Hello,Traders!
GBP-NZD is going up now
Just as I predicted before
But a strong resistance level
Is ahead so after the retest
We will see a move down
Towards the target below
Sell!
Like, comment and subscribe to boost your trading!
See other ideas below too!

DOW JONES Key Levels Analysis!
Hello,Traders!
DOW JONES is trading in downtrend
But the index has retested
A key horizontal level and IF
It gets broken, then we are officially
In the bear market and in the recession as well
So watch this level closely in the nearest weeks
Observe!
Like, comment and subscribe to boost your trading!
See other ideas below too!
