What Actually Happened To Bitcoin Price Action EditionSo I decided to see why this big ol' drop is happening with Bitcoin.
The answer?
We're filling a very old order block that was never
completed in July 2021. So it makes sense price has dropped ALL the
way to where we are now. Time to analyze where we may be going from
here.
According to this current situation, once the years-old order block is
retested, we should make a long push back up to the 38810.05 weekly
zone since it was never retested on the 4hr. It just dropped like a brick.
If we are not ready for the giant uptick back up yet, and we
breakthrough the monthly 28990.63 zone, the next pivot area will be
24337.80 daily zone. We're about to find out what happens.
BULL TPS:
• 32788.17
• 34337.72
• 35504.62
• 36622.43
• 38810.05
BEAR TPS:
• 29315.72
• 27774.40
• 26233.07
• 24475.42
Keylevels

AUDUSD shortOANDA:AUDUSD
A head and shoulder pattern formation on AUDUSD is a sign of a possible reversal in price direction. Should price break support/neckline. we go short on AUDUSD.

1D Market structureThe market is an emotional creature. Our market analysis is a subjective process. Let the market action tell you where it`s going. Don`t try to tell it where to go. Support and resistance are created by the decision making of market participants, as they operate within an environment of uncertainty.
Legend:
White lines - significant key levels;
Blue lines - trend lines;
Violet box - the largest trading volume was observed in this range;
Other lines - secondary zones

AUDUSD | New perspectiveThe Aussie staged a rebound on Friday in tandem with other recently hard-hit risk assets, though remains on course for a possible retracement into the major bearish trendline identified on the daily timeframe. Therefore, we are bound to witness two possibilities in the new week as I expect selling opportunities at around 0.705/0.71750 and below the key level at 0.69150 which also welcome a possible counter-trend where buyers could accumulate right above the key level to complete a retracement phase.
Risk Disclaimer:
Margin trading in the foreign exchange market (including commodity trading, CFDs, stocks etc.) has a high risk and is not suitable for all investors. The content of this speculation (including all data) is organized and published by me for the sole purpose of education and assistance in making independent investment decisions. All information herein is for your reference only and I take no responsibility.
You are hereby advised to carefully consider your investment experience, financial situation, investment objective, risk tolerance level, and consult your independent financial adviser as to the suitability of your situation prior to making any investment.
I do not guarantee its accuracy and is not liable for any loss or damage which may result directly or indirectly from such content or the receipt of any instruction or notification therewith.
Past performance is not necessarily indicative of future results.

Price action & key levels [Daily Primer 25.4/22]Hey Traders, a quick little video coming your way!
It is my 8 year anniversary with my wife, so I am rushing out of the door and cannot leave a detailed summary in text too.
The video goes over price action, key levels and some trades taken today on the DAX
Have a fab day and any questions are welcome!

The PIK Trading Strategy & Key Lessons for Day Traders!Hey Traders!
Happy Sunday!
In this video, which ends a little earlier as I didn't know videos have a limit, we go over a few key points, starting from the PIK trading strategy which you guys will hear about much more over the next few days, mindset, motivation and guidance is covered too!
When it comes to the PIK trading strategy, we go over the indicators that are used, price action and key levels!
The video isn't our best one, but it does have plenty of value and we hope you enjoy it!
Thanks and all the best!

BTCUSDT two key levels to watch!The price is testing the first support of the ascending change, where the price created a nice daily candle with a false breakout and hold the 40k support.
In 4h timeframe, the price is going to create a descending channel below the weekly resistance.
Now we need to monitor two levels, the weekly resistance for a long scenario and the daily 4h support for a deep retracement.
So how to approach it?
IF the price is going to have a clear breakout from the weekly resistance (above 42k ) we could see a new bullish impulse on 45k, otherwise if the price is going to lose the 40k, the next valid support is 1.13 Fibonacci Ext, 37k
–––––
Follow the Shrimp 🦐
Keep in mind.
🟣 Purple structure -> Monthly structure.
🔴 Red structure -> Weekly structure.
🔵 Blue structure -> Daily structure.
🟡 Yellow structure -> 4h structure.

NASDAQ trade idea and chart educationHey traders!
Hope everyone has had a fantastic weekend but its now slowly time to get back into the groove of day trading! The New York markets are open today even tough most European markets are closed... which means we will have a chance to finally trade after a long, and deserved, 3 day weekend!
In this video we go over a trade we have on the NASDAQ a trade we started to build and if opportunites present themselves we will continue to build.
Nevertheless, the main point YOU should take out of this video is our analysis and charting process, you will see me map in only the most important and relevant levels and then you see me focus on price action, since PA is the only way the markets can talk to us you all need to learn to read the charts by always focusing on price action (highs/lows)
Anyway, the video explains the rest!
Questions are welcome!
Have a fab day!

AUDJPY ShortReasons for bias:
-Bear flag pattern on 1H (continuation pattern)
-Inside of Daily Bull flag correction phase
-Expecting price to go down inside correction
before reversal to up inside Daily structure
Confirmations to look for Short:
-Bearish candle with high momentum closing below bear flag
-Break of 92.414 Key level to below

BTCUSDT is testing the key level! On the upper chart (weekly timeframe) the price is testing the previous weekly resistance as new support, 0n 0.5 - 0.618 Fibonacci level.
The current Weekly candle needs to close above the weekly structure.
On the daily timeframe, the price is creating a channel between the monthly structures (32k and 48k)
on the 4h timeframe, the price is creating an ascending channel and the price is testing the 0.786 Fibonacci level on the weekly support.
How to approach?
The price is in a key zone.
If the price is going to hold the weekly support we could see a bounce until the previous daily resistance on 44800, where the price has the M's neckline.
Otherwise, If the price is going to lose the support, the next Valid support si 40k
––––
Keep in mind.
🟣 Purple structure -> Monthly structure.
🔴 Red structure -> Weekly structure.
🔵 Blue structure -> Daily structure.
🟡 Yellow structure -> 4h structure.

XAUUSD LongReasons for bullish bias:
-Very strong timeframe confluence
-Bullish trend on daily timeframe
-Bullish trend on hourly timeframe
-Break of 1H & 15min local downtrend
-Bullish price action on 1H & 15min timeframe
-Rejection from below at daily key level area
Confirmations to look for:
-Break & retest of local downtrend on 1min timeframe
-Higher low & higher high on hourly timeframe
-Break & retest of daily pivot on hourly timeframe
This one may be very accurate entry on daily bullish trend.
Let's wait for confirmation before entry.
This is just idea, not trading advice, use at own risk.

XAUUSD ShortReasons for bearish bias:
-Break below daily bullish trendline
-Price sideways inside consolidation
-Double top pattern formed at key level
-Multiple rejections at 1947 level, which is also previous key resistance level
-DXY uptrending
Confirmations to look for:
-Break of local bullish trendline
-Break of 1937 level to below & retest of that level
-Trade is invalid if price breaks above consolidation and/or stays above bullish trendline!
This is just idea, not trading advice, use at own risk.

EURUSD LongReasons for bullish bias:
-Rejection at: Key level area 1.1000 + Bullish trendline + Fibonacci zone 0.5 - 0.618
-Break of local bearish trendline
-Higher highs and higher lows
-Crossing above EMA50
-Market sentiment is at 57% long positions
Confirmations to look for:
-Breaking above 1.1030 key level / retest of that key level
or
-Retest and rejection at bullish trendline
This is just idea, not trading advice, use at own risk.

GBPUSD ShortReasons for bearish bias:
-Downtrend on weekly/monthly timeframe
-Breaking below 1.32100 level
-Multiple hourly candle rejections at retest of 1.32100 area
-Multiple rejections from above at EMA50
-Crossing of EMA50 & EMA14
-RSI divergence
-Break below daily pivot
-DXY uptrending
Confirmations to look for:
-Break & retest of local bullish trendline
-Break & retest of key level 1.31750
This is just idea, not trading advice, use at own risk.

AUDCAD - Key ResistanceKey Resistance level, if the candle closes the way we are seeing now. I may head in for an aggressive shorting opportunity as I love to give a "short"(pun intended) especially when there is a RSI Divergence with Long Shadow candle within the Key Resistance Zone.
Going aggressive on this...
We shall see...
4hour candle closing in 19minutes time.

JICPT|NIO broke key level with another possible sell-offHello everyone. NIO has dropped by almost 60% from the high created on early Jan of last year.
On the monthly timeframe, the solid demand zone is $16-$20 with a rally-base-rally pattern.
On the weekly timeframe, the key levels of $33-35 violation trigged sell-off. We can see that the long-term MA in red color served as holder for a while. If the current level around $25-26 couldn't defeat the revisit. Another sell-off might be triggered with price likely to test the monthly demand zone.
What do you think? Give me a like if you're with me.

Know Your LevelsTodays daily primer is all about key levels, Don't make trading harder than it needs to be. Know your levels, keep track of them, have a system that says BUY or SELL as quickly as possible and then just execute your trades!
All you needed to do was follow up, know the key levels and execute. It makes this job much easier when you are prepared and this type of preparation is easy. We are looking for an edge and keeping track of levels is KEY at making easy money (at least for our day trading system).
Every Sunday I sit down and map out important levels, I also review my trades for the previous week, for development purposes, and during that review of past trades I specicially check these levels and how price behaved at them.
I'd like to show you just how important levels are, but you should also checkout our VWAP video released just before this video.

Update on BTC USD following the retest of 200 day MALooks like the 3rd wave DID in fact consist of a 3, 4, 5 on the Elliot wave. I am still holding onto this 200 day MA as support theory, while respecting the fib retracement levels at 46901 and 46232.
This would be the 3rd time we test / breach the 200 day MA in the last month. If we hold these levels again and start our reversal, I expect the whale bears will be returning to the market just in time to kick off Q1 2022 and a nice 3 month bull run.
What side are you on? Bull or bear?
#SeekingConfluence #BullWhale #BearWhale #WhaleWhales

What Are Key Levels? Learn To Identify Key LevelsIt's currently 12am and I thought why not drop a nugget.
So here it is... Finally, I dropped my supply and demand, support and resistance a.k.a Key levels tea.
Take this one seriously Cos' Nasdaq100 respects it a lot.
For better entries and exits you'll need to have a clear knowledge of key levels.

AUDUSD - H1: KEY LEVELS & BEARISH CORRECTION
Price has been rejected at resistance key levels for couple of times now.
Breakout of Bearish Correction trend line will move price (much) lower.
Lets not forget that the pair is very bearish due to massive Head & Shoulder Pattern on weekly chart.

ETH: Waiting for Daily Candle Close above $4385Into at least the first half of 2022 I'm bullish on cryptocurrency due to inflation expectations. The $4385 price point, being the May 12th all time high, has established itself as a key psychological level. After failing as support on Nov 16th, multiple attempts to break it have failed.
Today, we once again broke $4385, and for the first time the level has successfully held as support when tested on the hourly timeframe. To me, this indicates the past two weeks' accumulation phase is nearly complete.
If today's daily candle closes above it, I'm long to the $4771-$4868 region. For more conservative traders, I would recommend waiting for two daily candle closes.

Major Pairs Key Levels: Nov.22 - Nov.26Hi everyone,
Hope you have enjoyed the weekend.
Every week, I mark weekly levels for each currency pair to see how price reacts to them.
As you see in the charts, I have marked the last Week's and Last Month’s Highs and Lows for the 6 major pairs (actually they are 7 but there was no room for NZADUSD, but you can do that one by yourself as a practice)
Why are these levels important to us?
Because they are kind of support and resistance levels and when price approaches to them, any breakout or rejection on these levels is very important:
(Lows act like support and Highs act like resistance).
So, take a note for yourself and apply them on your chart to have an efficient setup for key levels.
Mn : Monthly (Red Lines) , W: Weekly (Yellow Lines)

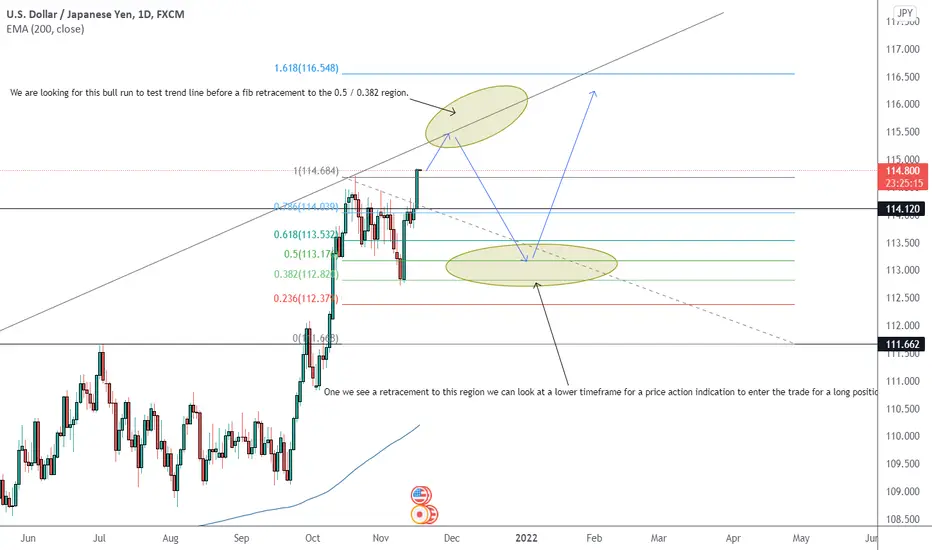
Fibonacci retracement prediction This time I have annotated the chart with my prediction highlighting the regions I will be paying attention to before checking lower timeframes for confluences in the chart confirming my theory and placing a trade.