[Growthbank] Identifying the Bank trade - EURUSDWe missed this trade by about 9 pips. What we should have done was identify the key levels from previous structure and set our entry and stop loss by those points. Reminder to always get more detailed values by using key levels.
Keylevels

GBPJPY Trendlines and FibStep by step video breakdown of 210 pip short on GBPJPY, no drawdown. Proper use of your tools can go a long way to building confluence and finding great entries as well as targets to take profit at. Enjoy.

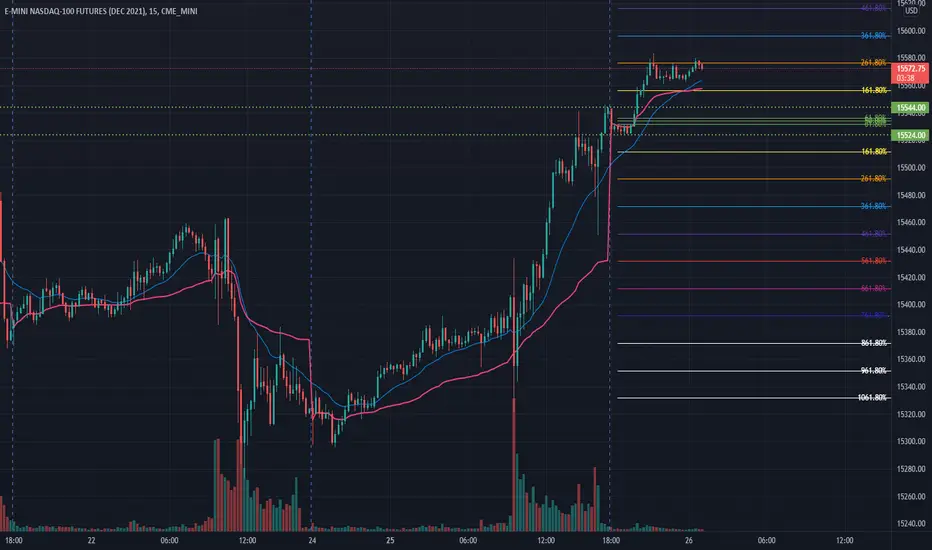
NQ Power Range Report with FIB Ext - 10/26/2021 SessionContract - CME_MINI:NQZ2021
- PR High: 15543.50
- PR Low: 15523.75
Evening Stats
- Gap: = N/A
- Session Open ATR: 212.62
- Volume: 24k
- Open Int: 240k
- Trend Grade: Long
- From ATH: -0.5% (Rounded)
Key Levels (Rounded - Think of these as a range)
- Long: 15819
- Mid: 15247
- Short: 14676
Keep in mind this is not speculation or a prediction. Only a report of the Power Range with Fib extensions for target hunting. Do your DD! You determine your risk tolerance. You are fully capable of making your own decisions.
Major Pullback Due From Monthly Zonehis pair is due for a major pullback right about now. Looking for this to pullback to the daily zone at 1.45811 or to 1.46638 lower low zone.
If the monthly doesn't test as support for the pullback, I'll look to hit the weekly zone area of 1.40569
BULL TPS:
• 1.43192
• 1.43955
• 1.44653
• 1.45718
BEAR TPS:
• 1.42745
• 1.42010
• 1.41566
• 1.41038
• 1.40569

Bearish Trendline Respected What About The Bullish CounterTrendGold is still technically in a downtrend overall according to the daily timeframe. It rejected off the trendline for the 4th time last week, so we may possibly break the monthly to continue to swing sell.
I've created a pullback trendline underneath to wait for a bullish continuation, or a break of the BULL trendline as additional confirmation of the bearish trend.
BEAR TPS:
• 1760.25
• 1750.37
• 1741.66
• 1726.44
]b]BULL TPS:
• 1772.14
• 1781.97
• 1793.93
• 1800.75

Major Pullback Due To Determine Bull ContinuationWe passed the monthly zone area of 156.552, but never retested the break of the zone. So it may test the monthly zone as support. If it fails as support, then price will push through to find its higher low at the daily zone of 154.859 or further down at the weekly zone around 152.594.
I haven't made the 4-hour zones yet to have all my Bull TPs. I'll add them and update it in the comments as a record.
BEAR TPS:
• 155.383
• 155.800 (If monthly fails as support)
• 155.041
• 154.258
• 153.473
• 152.704
BULL TPS:
• 158.552
• 160.007

ZILUSDT 4h - Buy OpportunityEntry zone: $0.099 to $0.101
Stop loss: $0.09
1st target: $0.116
2nd target: $0.1345
Beware of being hunted around $0.09, it could be a second entry point if the price drops suddenly, but we should wait and see the price action and the volume .
I will buy with half of the money I set aside for this position, and I will wait at the hunting point with the other half.
Trend Key Points Indicator have been used to draw important key levels and key points.

Cool Entry Strategy - Bullish Engulfing in Key LevelsYou are here to read about one of my best crypto-tested entry strategies, Bullish Engulfing in Key Levels . It’s a price action strategy and I’m going to explain its details but, even if you are not good at price action stuff, you could use it as well as I can. There are no requirements for dealing with this strategy except using two indicators.
The base success rate of this strategy was over 60% for me and by applying some filters and considering some best practices and being experienced in it, I could increase its success rate up to 76%.
This strategy is a combination of a Bullish engulfing candlestick pattern, pivot points, and key levels. By key level, I mean a trend line or a horizontal resistance/support line drawn by you or your added indicator. We can assume the base requirement of the strategy meet if a Bullish Engulfing (BE) pattern takes place near a key level or a pivot point.
We will use the Trend Key Point indicator to draw horizontal key levels and key points. It marks pivot points with a sign above and below the candles. If the pivot point is important, the indicator will draw a horizontal line as a key level. In this strategy the LL pivots are important to us. All necessary details will be applied to your chart by adding the indicator to it. You can also read more about Trend Key Point guide and best practices here .
There is also an indicator for finding and highlighting Bullish Engulfing patterns called Common Candlestick Patterns . By adding the indicator, you will see too many highlighted patterns because there are active by default. Therefore, after adding the indicator to your chart, you need to open its options and uncheck all except the Show Bullish Engulfing one to highlight just Bullish Engulfing patterns.
After adding indicators, you need to wait and capture entry points in a suitable state. But there are some tips and best practices we need to jot down to distinguish between good and bad states and increase the success rate of the strategy. I list below:
Ignore a BE pattern that does not occur at a key level or is far from key levels.
It’s a good sign if the BE pattern occurs on an LL pivot point (a candle that has a star under it) which meets a key level.
BE pattern must have an acceptable and strong body. You can ignore weak candles.
Ignore the BE pattern formed just below a resistance or potential reversal area.
It excites me to see a BE pattern at the lower point of the price but a BE at the end of correction sounds good too.
If the BE pattern occurs on the LL pivot seeing a key level and the volume also confirms that by crossing the VMA20 (volume moving average length 20), you can enter definitively.
If the entry requirements are met, the closing price of the BE pattern will be my entry point.
Do not enter if the green candle of the BE pattern is abnormally big. You can wait for a pullback or you can ignore the pattern.
BE pattern in the bottom of a range box could also be a good chance to enter but you have to be careful where the range is.
As you read before, this article is about finding the entry point and after clarifying that it's time to find out where you need to put your stop loss and your take profit but, these topics not fit in this article. You can refer to the other available resources covering these topics.
Both of the indicators mentioned are developed by myself, so I tried to apply my best practices to them. I hope it was useful for you. Feel free to submit your comment to improve the strategy or the indicators.

AMZN support and resistance in daily NASDAQ:AMZN
Hey everyone .
So in short term timeframes (1H , 4H) AMZN is moving in a descending channel which is leading price to two strong support levels :
3175.00 and the second support level which is 2900.00
well of course for investors the price 2900.00 is very nice to enter
But for traders 3175 can be very nice after bullish confirmations (candles , divergences ect ..) at this price
this is just technical analysis and we must see what's gonna happen to #DXY and U.S economy and also the company earnings report in further weeks , so also don't forget about fundamental analysis .
Anyway it's better to watch #AMZN for this week and next week .
what's your idea about this stock guys ?

it's so possible for USDJPY to fall when the market opens OANDA:USDJPY
hello guys , I hope you're all well and having nice time .
let's see USDJPY now , I think the bears are entering right away for a nice short , but we need to hold on and wait for the candle to be closed and also we must take the confirmations .
As we can see in the chart
1- the price has touched a very important resistance with 3 touches , so our resistance is very strong .
2- the momentum has decreased and it's becoming bearish
3- RSI is in overbought range (77)
4- there is also a bearish divergence (RSI) in 1h timeframe
5- there is a bearish cross on MACD but in 1h timeframe
So must we go a short ?
I also show the important support and resistance levels in the chart :
111.650
110.800
110.400
110.155
109.600
109.120
108.770
so your taking profit is better to be set on one of mentioned levels but anyway it's your personal decision according to your trading strategy , personality and your risk and and money management .

Upward Movement ExpectedA strong move may cause an up break for the range box and TL1. I will enter if that happened with a good candle. I also could wait for a pullback to the range box to enter. My stop loss or second buy could be around $0.9 according to the candle's status. and I'll take $1.28 as my first target and $1.5 as the second target.
TL2 has been broken by a range which reduces the importance of the breaking. Also, there are two abnormal pin bars in the range that prevent me from believing the price will keep falling. Even so, it’s possible to have a down break for the range. In this scenario, $0.87 to $0.9 could be a strong buy zone if it fit one of my strategies.
I'll update the idea according to the situation. : )
Indicators used:
- Trend Key Points
- Abnormal Pin Bar
- Common Candlestick Patterns
- Volume

51400 will be the next stopA pullback from the TL1 and $49300`s key level with a pin bar and TL2's up break shows that the price will go up. but, according to Trend Key Points indicator $51400 is an important key point and the price could range around it in the next run.
Indicators used:
- Trend Key Points
- Abnormal Pin Bar
- Common Candlestick Patterns
- Volume

AMD KeylevelAMD looks like forming a new keylevel (2). We need to watch our trend line if we break them in the next weeks.
If yes I expect to bounce back on keylevel 1, if not keylevel 2 is confirmed and I will do the next analyze to determine the next long position if possible.

GBPUSD - Respecting LevelsAs we can see from the chart, GBPUSD has been respecting the highlighted zones well.
I am expecting GBPUSD to reverse off its current level of support turned resistance, to revisit the June lows at the 1.36 region. Price has tried to break upward several times over the past couple of days, and for that reason my bias is short.

EURCAD: Potential Short Trade 🇪🇺🇨🇦
EURCAD is testing a peculiar intraday structure resistance.
Watching the reaction of the price on that we see multiple rejection and dodji candles.
The price started to trade in a local consolidation area.
To short the market with confirmation,
wait for a breakout of 1.477 - 1.4775 support.
It will be our trigger to open a trade.
Goals will be 1.473 / 1.469
In case of a bullish breakout of a yellow resistance,
the setup will be invalid.
❤️Please, support this idea with a like and comment!❤️

EURUSD... Ready to LongFX:EURUSD
The chart is well explanatory on its own, let me just clarify to prevent confusion and uncertainty
Denoted Terms:
1. Key support level (Lower rectangle)
2. Entry level :- Horizontal green line
3. Near resistance/support (Upper rectangle)
4. Take profit levels:- Horizontal blue and purple line
The indicator used :- Relative Strength Index (RSI)
1. From the indicator+chart analysis, there is a bullish divergence there, which clearly we can see its sitting on the key support level
2. Dynamic Support and Resistance (EMAs):- There is a tendency the 10 (yellow color) & 20-PERIOD (blue colour) EMAs become dynamic support after a close price on the entry level i denoted, followed by a confirmaton candle
Also on 4hr timeframe, trading 50% fibonacci retracement, see that below
Trade Setup
Trade Type : Buy
Entry : 1.17550 - 1.17650
T.p 1 :- 1.18465 (91 pip in profit)
T.p 2 :- 1.19060 (150 pips in profit)
Stop loss price :- 1.16930 (62 pips in loss)
RRR :- 1 : 2.5
Like and comment what you think on this... Let's trade and win together.
Happy trading CryptoKings!!!

BAJFINANCE looks undecisive and could breakout either wayJust marking a couple of levels on the daily where the stock has been taking support(5925) and resistance(6223) multiple times now. We wait for a breakout on either side. A strong closing above or below these levels could trigger our entry but caution is advised as it's been stuck in this zone for a while now. Entry looks good with 1:3 being the minimum target. Lower SL Bigger Targets. Cheers and Happy Trading.

AUD/NZD - My Outlook On The Pair for Next WeekBulls have been holding price at the 1.0550 level this week, a key long term sentiment level. We have seen price bounce previously from this level. If bears continue to dominate, we could see price sink to 1.0450 before a bullish bounce. We have this pair on our watchlist and are bullish and will continue to look for long opportunities into next week!

AJ - 4HR - Bearish StructurePrice has been in an overextended cycle to the upside. We are now beginning to see downtrend structure forming on the 4HR Chart, with lower lows and lower highs. Price has bottomed out at the 80 whole level. Will the channel continue to be respected?

Bullish Trend ExpectedA strong reversal candle is expected, such as Abnormal Pin Bar , which is also confirmed by the volume at key level 1 or key level 2. If this expectation comes true, the upward movement has begun.
The volume confirmation means to expect the volume to be higher than the volume moving average (20).

Wyckoff redistribution for BTCNote: This post is quite a reach from a bearish perspective and just an idea. I have about 70% confidence i n it.
This is looking more likely to be a Wyckoff redistribution than a reaccumulation simply from the patterns I'm seeing formed within the range. We will only know for sure though after a break below the range and a bearish retest of SC after breaking to the low (I'll be buying on bounces at all the fibonacci levels starting from 1.272 all confluent with monthly/weekly demand zones and selling on bounces until the 200% fib retracement target with stop losses at entry after bounces. I believe we can come as low as the 2.618 at around 13k not likely though.
In the recent short term there was a wyckoff reaccumulation to the 200% fib target which couldn't hold a bullish retest of its buying climax. I will try to get a short in between 33.3k and 33.7k. Key level I'm setting buy orders for now are at 30.3k for what I think will be one last bearish retest before breaking down from the larger range.
Avoiding buying alts until around 50% of the monthly imbalance on btc.d is filled. Bitcoin Dominance has a big imbalance on the monthly it is looking to fill. But once filled to maybe 50%-100% I think there will be a big fast drop again to new lows for a new big alt cycle from the pattern I'm seeing formed.
The monthly close 2 days ago was also the quarterly and half-yearly closes. If the first few months or 2 are started red, we might see the quarterly or half-yearly shift momentum to the upside and leave a wick to the lows.
You might be thinking we need to retest breakdown of previous wyckoff redistribution range. To that I would argue we might not get it because the target of the 200% fib retracement has already been reached. It has actually come down to 2.618.
Eth BTC also looking bearish on the weekly. Currently faking out from the shorter term .618 retracement.
Might be the last post for a while.

USD/JPY - Ascending Structure - Bullish MomentumHere we can clearly see higher lows and higher highs forming, creating this ascending structure marked by the white trendlines.
Key levels have been marked, including the bottom and top of current structure.
We have seen some strong bullish pressure of recent times on this pair.
Where will price head next? Drop your predictions in the comments!

Double Tap With Weekly Key Level Setup This is a major key level set up With the weekly level being the star of the show this week. I am looking for either a pullback off this level that will be bullish of course. Or a smaller pullback that could lead to a continuation further down.
My bias? This is about to be a reversal. We already reached this area on March 31st. Now we have returned. This could be a double-tap move for the bull run. We'll have to watch it and see.
BULL TPS:
• 1.47951
• 1.48377
• 1.49166
BEAR TPS:
• 1.46560
• 1.45902
