KSS Trading Guide 4/21/25Kohl's Corporation (KSS) Trading Analysis for Monday, April 21, 2025
Sentiment Analysis
----Overview: Sentiment on platforms like X and StockTwits leans bearish, driven by tariff concerns and Kohl’s weakening fundamentals, with projected sales declines of 5-7% in 2025. JP Morgan’s Underweight rating and $7 price target as of April 14 underscore margin pressures, though a ~12% dividend yield provides some appeal for income-focused investors.
----Implication: The prevailing negative sentiment, coupled with macroeconomic headwinds, is likely to exert downward pressure on KSS, overshadowing the dividend’s stabilizing effect.
Strategic Outlook
----Assessment: The outlook for Monday is bearish, fueled by significant put activity in weekly options, persistently oversold technical indicators without reversal signals, and a VIX at ~40, reflecting heightened market volatility.
----Implication: Anticipate a price range of $6.20 to $6.50, with a risk of breaching support at $6.20, potentially driving the stock toward $5.80 if bearish momentum persists.
Market Influences
----Overview: No new Federal Reserve decisions today; however, recent guidance on April 17 signals a cautious approach to rates, which could dampen retail spending. Kohl’s next earnings are scheduled for May 21, per TradingView data. Fitch Ratings downgraded KSS from BB to BB- on April 7, citing financial strain. Social media discussions on X, WallStreetBets, and StockTwits remain bearish, focusing on the impact of 10% baseline tariffs on margins. Additionally, the departure of Chief Technology Officer Siobhán Mc Feeney on April 1 introduces further uncertainty.
----Implication: The absence of positive catalysts, combined with tariff pressures and leadership changes, solidifies a bearish outlook for Monday.
Price Context
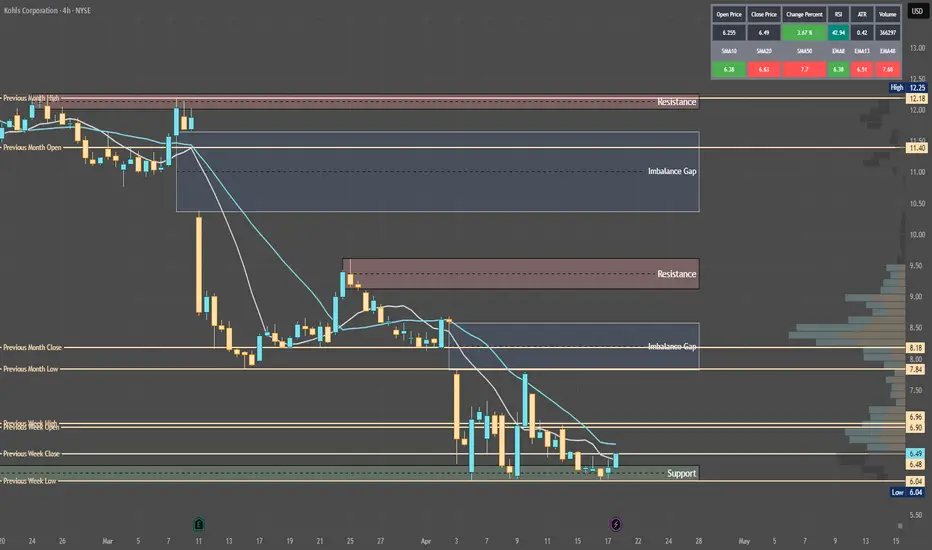
----Overview: Current price at $6.48. The stock has declined 21% over the past month from $8.20 on March 31 and is down 73% year-over-year from $23.94 in April 2024. Support lies at $6.20 (recent low on April 17), with resistance at $6.89 (April 14 open).
----Implication: Recent declines, driven by tariffs and executive turnover, suggest continued downward pressure, with a break below $6.20 likely to accelerate losses.
Technical Indicators
Monthly: RSI at 22 (oversold), Stochastic at ~12 (oversold), MFI at ~18 (oversold). Price below 10/20-month SMAs ($8.50/~$9.50, bearish).
Implication: Long-term bearish trend with extreme oversold conditions, yet no reversal signal is evident.
Weekly: RSI at 27 (oversold), Stochastic at ~17 (oversold), MFI at ~20 (oversold). Price below 10/20-day SMAs ($6.70/~$6.90, bearish).
Implication: Bearish trend confirms downside bias for weekly contracts.
Daily: RSI at 30 (nearing oversold), Stochastic at ~15 (oversold), MFI at ~22 (oversold). Price below 10/20-day SMAs ($6.40/~$6.50, bearish).
Implication: Daily trend supports weekly bearish bias.
4-Hour: RSI at 35 (nearing oversold), Stochastic at ~18 (oversold), MFI at ~28 (nearing oversold). Price below 10/20-period SMAs ($6.30/~$6.40, bearish).
Implication: Medium-term bias aligns with weekly outlook.
Hourly: RSI at 32 (nearing oversold), Stochastic at ~15 (oversold), MFI at ~25 (oversold). Price below 10/20-hour SMAs ($6.35/~$6.40, bearish).
Implication: Intraday bias supports weekly trade direction.
10-Minute: RSI at 38 (neutral), Stochastic at ~20 (oversold), MFI at ~30 (nearing oversold). Price below 10/20-period SMAs ($6.45/~$6.47, bearish).
Implication: Short-term bias reinforces weekly contract setup.
Options Positioning
Overview: Weekly options show high put volume at $6.50 (1,500 contracts, 70% at bid), with a put-call ratio of 2.5 (bearish) and IV skew favoring puts ($6.50: 50%, rising). Monthly options have a put-call ratio of 2.0, with put IV rising ($6.00: 48%). 3-Month options show a put-call ratio of 2.3, with put IV rising ($5.50: 45%). VIX at ~40 (down 5%, above 30-day average of ~35).
Option Flow Dynamics (OFD) Analysis:
Vanna:
Impact: -$0.10 intraday.
Insight: Rising put IV at 50% compels dealers to sell shares to hedge delta as IV increases, exerting downward pressure. A VIX of 40 heightens this effect.
Stance: Bearish for weekly contracts; neutral if IV falls below 48%.
Charm:
Impact: Pins price ±$0.05, adds $0.03 volatility.
Insight: High put open interest at $6.50 prompts dealers to sell shares to maintain delta neutrality near expiry, pinning the price with minor volatility.
Stance: Bearish for weekly contracts; neutral if price holds $6.50.
GEX (Gamma Exposure):
Impact: Pins price ±$0.10, adds $0.05 volatility.
Insight: Negative gamma from elevated put open interest drives dealers to sell shares on price declines, pinning at $6.50 while adding volatility on breakouts.
Stance: Bearish below $6.50 for weekly contracts; neutral at $6.50.
DEX (Delta Exposure):
Impact: $0.20-$0.30/day downward pressure.
Insight: High put open interest creates a delta imbalance, compelling dealers to sell shares on price drops, adding consistent downward pressure.
Stance: Bearish for weekly contracts, particularly on high volume.
OFD Summary: Weekly flows signal a bearish bias, with $0.30-$0.50 downward pressure driven by Vanna and DEX selling. Pivot at $6.50; weekly range $6.20-$6.50 (pinning). A VIX of 40 amplifies downside risk, and a break below $6.20 could trigger $0.15 volatility (GEX). Monthly and 3-month expiries, with put-call ratios of 2.0 and 2.3, provide bearish confluence.
Implication: Bearish bias for weekly contracts; elevated VIX suggests downside volatility, with a $6.20-$6.50 range for Monday.
ICT/SMT Analysis
Overview: Weekly: Bearish, support at $6.20, resistance at $6.89, SMT divergence versus WMT confirms weakness. Daily: Bearish, FVG $6.50-$6.89, OB $5.80. 4-Hour: Bearish, MSS below $6.48, liquidity below $6.20. 1-Hour: Bearish, MSS below $6.48, liquidity below $6.20. 10-Minute: OTE sell zone $6.50-$6.60 (Fib 70.5%), target $6.20.
Implication: Bearish across all timeframes; a breakdown below $6.20 is likely, aligning with the weekly contract setup.
Edge Insights
Dark Pool Activity: Large sell orders at $6.50 in recent dark pool prints (April 18) indicate institutional bearishness, potentially increasing selling pressure if retail traders follow suit on Monday.
Sector Dynamics: The consumer discretionary sector is down 17.8% year-to-date (Morningstar); Kohl’s heavy reliance on imported goods amid tariffs makes it more vulnerable than peers like Walmart, which benefits from stronger domestic sourcing.
Short Interest Pressure: Short interest at ~45% of float (MarketBeat) raises the risk of a short squeeze if the price breaks above $6.89, though current momentum favors shorts targeting $6.20.
Implication: Institutional selling and sector weakness reinforce the bearish bias for weekly puts; remain vigilant for a potential squeeze if the price approaches $6.89.
Trade Recommendation
Analysis:
Bearish: 55% likelihood (negative MSS, OFD flows, tariff pressures).
Neutral: 30% likelihood (GEX pinning at $6.50, high VIX choppiness).
Bullish: 15% likelihood (oversold indicators, potential bounce above $6.89).
Action: Recommend a bearish weekly trade below $6.20, targeting $5.80. Purchase $6.50 puts (weekly expiry) at ~$0.25, aiming for $0.50, with a stop at $0.15 if KSS breaks $6.60. Risk $50 (2.5% of a $2,000 account).
Conclusion for Monday: Kohl’s faces a bearish trajectory driven by tariff pressures, negative options flows, and leadership uncertainty. The recommended strategy focuses on a breakdown below $6.20 for weekly bearish trades, targeting $5.80. Elevated VIX and institutional selling add risk—execute with tight stops to manage volatility.