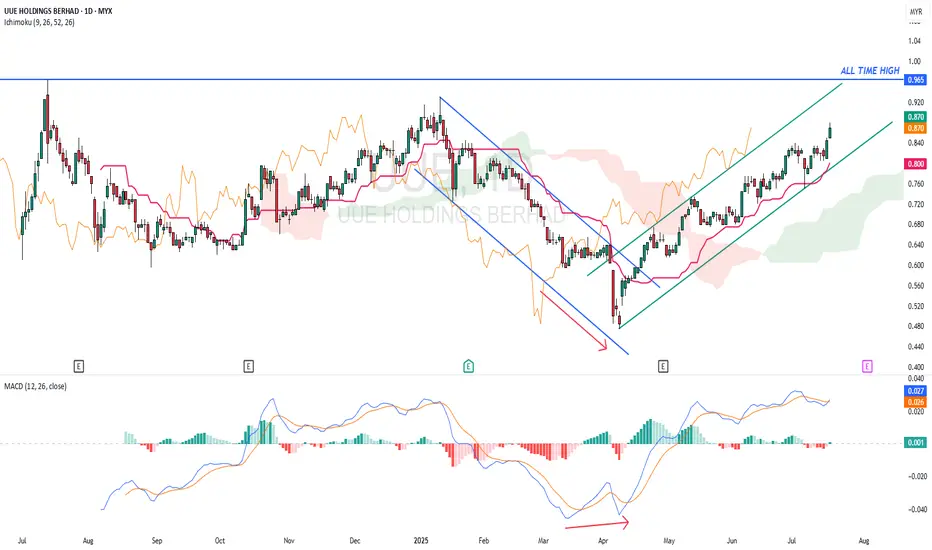
UUE - Potential hit All Time High ?UUE - CURRENT PRICE : RM0.870
The downtrend from January 2025 to April 2025 had changed to uptrend after the stock broke out the descending channel. Take note that there was a bullish divergence in MACD before the breakout of channel.
ICHIMOKU CLOUD traders may take note that the KIJUN SEN is rising steadily and CHIKOU SPAN also moving above candlesticks - indicating stock is uptrending. Today's closing price is higher than previous day's close suggesting a bullish breakout buy signal. A close below the KIJUN SEN may indicate a trend reversal (KIJUN SEN acts as support level).
ENTRY PRICE : RM0.865 - RM0.870
TARGET PRICE : RM0.930 , RM0.965 and RM1.03
SUPPORT : KIJUN SEN (cutloss if price close below KIJUN SEN)
Kijunsen
$BTC PARABOLIC RUN IS INEVITABLE! As seen in #Bitcoin past cycles, tenkansen and kijunsen bullish crossover occurred before the parabolic run and the cycle is repeating.

🔔GBPUSD Will it be ready for upside ? It seems that Tenkan-sen wants to direct the candlesticks to Kijun-sen. I think after a sharp drop in pounds, maybe now is the time to rest. It is also possible that the price wants to pull back on the Kijun-sen 216. what do you think? Be sure to tell me your opinion.

Short the Moving average + ichimoku.When I just opened the chart I saw a rapid decline from the Kijun-Sen and moving averages towards the bottom of the cloud. I expect price to move all the way to previous range low and put stop right above that range where the Kijun-Sen confluences with that line. Once I master this form of charting Ill start educating, my goal right now is to become a profitable trader first and not be a clown guru who does not even make money himself.

Probability of a pullback is highA couple days ago we got a morning star bounce from the 38K-39K support zone right into double Kijun-Sen. We currently are back into the zone and I expect the pair to consolidate for a while in between Kijun Sen and support area. This to me is day trader territory and not clear enough to see if we get a trend change to the upside for a multi week position.

💡Don't miss the great Buy opportunity in XAGUSD|SILVERHi everyone
All Ichimoku indicators indicate a rise in silver. I think silver can grow up to $ 32 and even more.
The Kijun sen Indicators 108 and 216 also confirm the climb.
❤️Please, support this idea with a like and comment!❤️

KiJun Sen on Ichimoku shows the BTC price pathyou can see a V shaped on kijunsen on ichimoku it shows that price will reach there , and you can look for another V shapes on ichimoku

BTCUSD - D1 - KEY PIVOT LEVEL @ 57'500DAILY PICTURE :
57'500 which is the double top trigger level should still be seen as a KEY PIVOT LEVE L for further development.
In addition, slightly below this level we can see the Tenkan-Sen or Conversion line, currently 57'368.
As already mentioned, a daily closing below both levels mentioned would add further selling pressure and put the
focus to lower levels towards the daily clouds bottom, currently around 53'300, which also coincides with the former
uptrend support line (in green !)
Price action over the coming hours should be monitor very closely and as already mentioned several times, shorter time frames
will give you early signal (s) such bullish divergence which would trigger short term reversal, in a first time, in a corrective move and
if confirmed in longer time frames may become a strategic trend reversal...
RSI indicator still below 50 !
Globally in this time frame and in order to neutralise the ongoing downside move, the BTCUSD should recover, firstly above the daily clouds which
should be confirmed by an upside breakout of the ongoing downtrend line resistance (in red)
INTRADAY PICTURE :
4 HOURS
In an ongoing downtrend channel, currently in its middle level, caugh between the Kijun-Sen on the upside and the Tenkan-Sen & Mid Bollinger Band on the downside.
Watch breakout of one of those points.
1 HOUR :
Upside breakout attempt failed; for the time being it hold above the Kijun-Sen and the MBB. On the upside, watch the top of the clouds and the KS as levels to break while on
the downside a failure to hold above the H1 clouds bottom would put the focus for lower level towards former low around 56'000 first and then lower.
Have a nice trading day.
All the best and take care.
Ironman8848

BTCUSD-D1- ADDITIONNAL BEARISH SIGNAL !As expected, yesterday's small recovery has been short lived !!!
Indeed, RSI bearish divergence on H1, triggered a corrective move only, pushing up the BTCUSD towards an intraday high of 57'882, missing to breakout
the clouds resistance area on this time frame... (magical clouds :-)...)
In addition, recent price action triggered an other bearish signal : the lagging line crossed under the Kijun-Sen which should be seen as a second warning bearish signal
following a first daily closing level (on Nov 22nd), below the double top trigger level of 57'500 !!
So what next ?
No change in my bearish view; current level are roughly in the middle of the daily clouds and I suggest to watch closely at the clouds which will tell you in which direction the BTCUSD will go.
On the upside , the TS @ 58'687 is the first significant resistance level to look at and as long as ww stay below this point, the bearish pressure will remains !
In order to neutralise this ongoing downside price action, we need to see a clear breakout of the psychological 60'000 former support which became now an important resistance level to break on the upside !
On the downside, , no secret, watch again the clouds support zone, currently around 53'400 which also coincides with the former uptrend line support (in green).
A failure to hold above 53'400 would directly put the focus on the 50'000 area ahead of the double top technical target @ 46'000
Have a nice trading day.
Ironman8848

BTCUSD -D1 - IN A CHANNEL...The breakout and the last D1 closing level above the 50'000 psychological level, accelerated the upside move towards
a high so far of 51'915.
Currently in a new uptrend channel with its first resistance around 52'000 (former yesterday's high) ahead of former of Sept 6ht @ 52'956.
On the downside the former resistance of 50'000 became now the new support to look at very carefully.
Indeed, as you can see on this D1 chart, this level coincides exactly with the middle of the long black candle (Sept 7th) and also, roughly to the previous
top of Aug 23rd; therefore, this 50'000 should really be seen as a PIVOT LEVEL and a failure to stay and hold above it would put the focus on the 48'000 zone,
which is currently the top of the clouds, ahead of the support trend line of the channel, currently around 46'330-45'430 , also cluster TS, KS and MBB !
Last, but not least, a potential double top @ 52'956 could be triggered and can not be totally ruled out (watch indicators to detect bearish divergences !!)
As always, monitor also shorter intraday time frames.
All the best
Take care
Ironman8848

BTCUSD - H4/H1 - INDECISIONGood morning, today we are going to look at the H4 and H1 time frames which are both showing some growing uncertainty about further development.
Indeed, I mentioned in my previous analysis to look carefully at the 48'000 as a barometer indicator and looking at recent and current price action we can
note, so far, some lack of momentum to clearly confirm a breakout of the level above mentioned.
In addition, on H4, a RSI bearish divergence has already been triggered which pushed, slighlty down the BTC towards KS and clouds support zone which hold for
the time being. Please note that the recent low (47613) also, coincides with the new minor support trend line (in green on H4)
So, on H4 :
on the downside , watch carefully the cluster support area (47'947-47'768) as a failure to hold above this zone would open the door for the clouds zone with
its bottom line currently around 46'000 !
on the upside , watch former high 48834 and check RSI which will validate (convergence) or invalide (divergence) further upside !!!
and on H1 :
watch the cluster (48'000-48'225) on a closing basis ! failure to close above 48'225 and hold in a sustainable manner, would put some short term selling pressure, opening the door first for the very thin cloud
support area (fragile !!!)
On the upside watch for a potential upside breakout of the ongoing slightly uptrend channel.
Have a nice Sunday and all the best.
Take care
Ironman8848

I see the market falling to 42 thousand dollarsDue to the formation of the shadow a few days ago, it is expected that Bitcoin will try to touch that price range. The most important bitcoin support in the fall can be considered in the range of $ 42,000. Given the USDT.D and BTC.D positions, a relatively weak fall is expected to occur.
Due to the proximity of MA50D and MA200D to each other and the position of Kijunsen line and Ichi Moku oscillator, it seems that the fall is weaker and the ascending trend will start soon. But I am cautious until I see a stronger uptrend in the market. I see the market falling to 42 thousand dollars.

Form a triangle pattern and hope to break upIn the four-hour time frame, a triangle pattern is formed. As we know in this pattern, the target of the triangle pattern is ascending or descending as the base of the triangle.
Due to the formation of the Dodge candle in the previous candle on the lines of Kijunsen and Senko Span, A above the Como cloud, which is itself an important support, as well as based on the good news heard from this currency and the possibility of intersection of Kijonsen and Tenkansen lines. If Bitcoin can keep its trend, I expect the triangle to break upwards, and the most important resistances ahead are 0.35, 0.3917 and the range of 0.42 to 0.45, which is a very important pivot. I put my loss limit below the Como line.
Please share your comments with me
Be profitable

BTC - H4 - Mid Bollinger Band under attack !H4 time frame is showing an ongoing bearish price action, putting now the Mid Bollinger Band, currently @ 43'238 under attack.
Therefore, MBB, should now be seen as the LEADING INDICATOR for the upcoming hours. Indeed, a failure to hold and stay sustainably
above this important support level, would open the door for further downside, having in mind the next significant support and key pivot level
@ 41'327.
In addition, the bearish mood has been confirmed by a RSI bearish divergence on D1 !
Watch carefully at shorter time frames and especially at the clouds support zone, around 42'300/42'400 as a short term intraday indicator as a breakout
of that support area would directly put the focus on KS @ 41'327
In order to neutralise the ongoing downside risk, the BTC should quickly recover and hold above TS or conversion line, currently @ 44'083.
Have a nice day.
All the best and take care.
If you like my analysis, please do not hesitate to show it and if you do not follow me yet please do it as well.
Ironman8848


EOS ready to go to the moooooon!Everything is perfect, a great opportunity can be proposed for EOS !

BTCUSD - D1 - STILL UNDER THE MID BOLLINGER BAND !D1 : Still in a broad bearish channel and below the Mid Bollinger Band.
Yesterday's price action triggered a doji ("hanging man" or "dragonfly", confirmation
will be given on D1 closing) !
Globally, as long as BTC does not breakout the downdrend channel first and does
not move and hold above MBB and Kijun-Sen (Base line), price action seen over the last couple of sessions
remains a corrective move in a bear trend.
As told several times, ONLY a CLEAR breakout confirmation of the "CLUSTER" three levels above mentioned,
would force to a view reassessment of the current scenario which potentially may change from
bearish to bullish.
On the downside, watch Tenkan-Sen (Conversion line) @ 47836, as the first significant support.
In the meantime watch shorter time frames to get intermediate clues for ongoing price action
Have a nice Sunday and have fun.
All the best and take care

LEARNING ICHIMOKU IN CRYOTOin this chart u can learn all of 5 lines of ichimoku kinkohayo.if u have any question fell free and commnet for us.thx

BTC - H1 - CORRECTION UNDERWAY...short term strategyH1 : Recent rally looks to be over ! Indeed, after having filled the 61.8% Fibonacci retracement, BTC is now showing
a potential double top in progress. In addition, indicators are turning down and a first confirmation will be given
by a breakout of the Tenkan-Sen (currently @ 37753, ahead of MBB@ 36963 and finally Kijun-Sen @ 36407 !
A failure to hold above the trading range above mentioned would trigger further dowside, targeting first 35514, 34500 and 33487.
The latter level being also, currently, the bottom of the clouds support.
Strategy : sell from current level (38288 and towards former high 38790)
TP @ 34'500
SL @ 39'484
RR : 1:3

BTC - D1 - H4 - H1 - MBB ON D1 @ 32455 IS THE KEY PIVOT LEVEL !D1 : As mentioned yesterday, failure to recover at least above former mid black candle (@ 36810) triggered renewed selling pressure, in putting, overnight the focus on MBB, currently @ 32455
MACD cross UNDER !!!
H4 : Failure to recover and hold above the clouds, in conjonction with a rejection at the 50 % Fibonacci retracement (@ 36130) triggered selling pressure
H1 : Picture is pretty clear, pullback failure from the Jan 11th low @ 30237, rejecting by both 50% Fibonnacci retracement, previously mentioned on H4 and
by the top of the clouds resistance area around the 36'000 level
CONCLUSION :
A failure to hold above the MId Bollinger Band (MBB) would trigger a downside move acceleration in opening the door for 29'000, which is the 50 % Fibonacci retracement of the 16218-42000 recent rally,
ahead of 26'066 (61.8% Fibonacci retracement)
On the upside, no change in my view and only a clear upside breakout of 36810 would force to a view reassessment of the expected bearish scenario, calling for lower levels.
For the time being, BTC remains a SELL on rally on a broad bear trend

BTC - TENKAN-SEN STILL ACTING PERFECTLY WELL ON ALL TIME FRAMESD1 : Technical targets mentioned in my yesterday's comments have easily been filled with an intraday of 30261.
Nice recovery on a daily closing basis above the Tenkan-Sen, currently @ 34867
Nevertheless, IN ORDER TO NEUTRALISE DOWNSIDE RISK, BTC needs to close today at least above the middle of the long black candle, which would trigger a "Piercing line" or
even better, above the opening of this same black candle which in this case would confirm a "bullish engulfing pattern", calling for higher levels.
Therefore, on a daily basis we have to wait until this evening in order to see how the price action will have performed over the day.
H4 : 50 % Fib ret & Kijun-Sen has been filled (@ 36130), currently trying to recover above the clouds support zone.
H1 : Watch closely at the price action around the clouds which would give more clues about short term price action.
Bullish above the clouds and bearish below
Have a nice day :-)

BTC - D1 / H4 - TENKAN-SEN REMAINS THE MAIN LEADING INDICATOR !D1 : Watch carefully at the Tenkan-Sen; BULLISH above and BEARISH below
H4 : Same comment than on D1
As long as we stay and hold above Tenkan-Sen, currently @ 39309, it is OK for further upside.
A failure to do it would put the focus on MBB currently @ 38357 ahead of Kijun-Sen
Global picture remains broadly bullish ,as for the time being any downside move should be seen as a corrective move only in
a consolidation phase, calling for higher levels.
Keep in mind the Risk Management in this high volatility environment !!!

